




Crypto Today: Bitcoin, Ethereum, XRP edge higher despite returning ETF outflows
- Bitcoin rebounds above $63,000 amid $390 million ETF outflows last week through Friday.
- Ethereum bulls hold support at the 50-day EMA, but the 100-day EMA caps the immediate upside.
- XRP consolidates around $1.00 but lacks strong catalysts to sustain gains.
The crypto market is broadly consolidating on Monday, with Bitcoin (BTC) holding above $63,000, Ethereum (ETH) approaching $1,900 and Ripple (XRP) sitting on top of the critical $1.00 support level.
Bitcoin and Ethereum ETFs see outflows
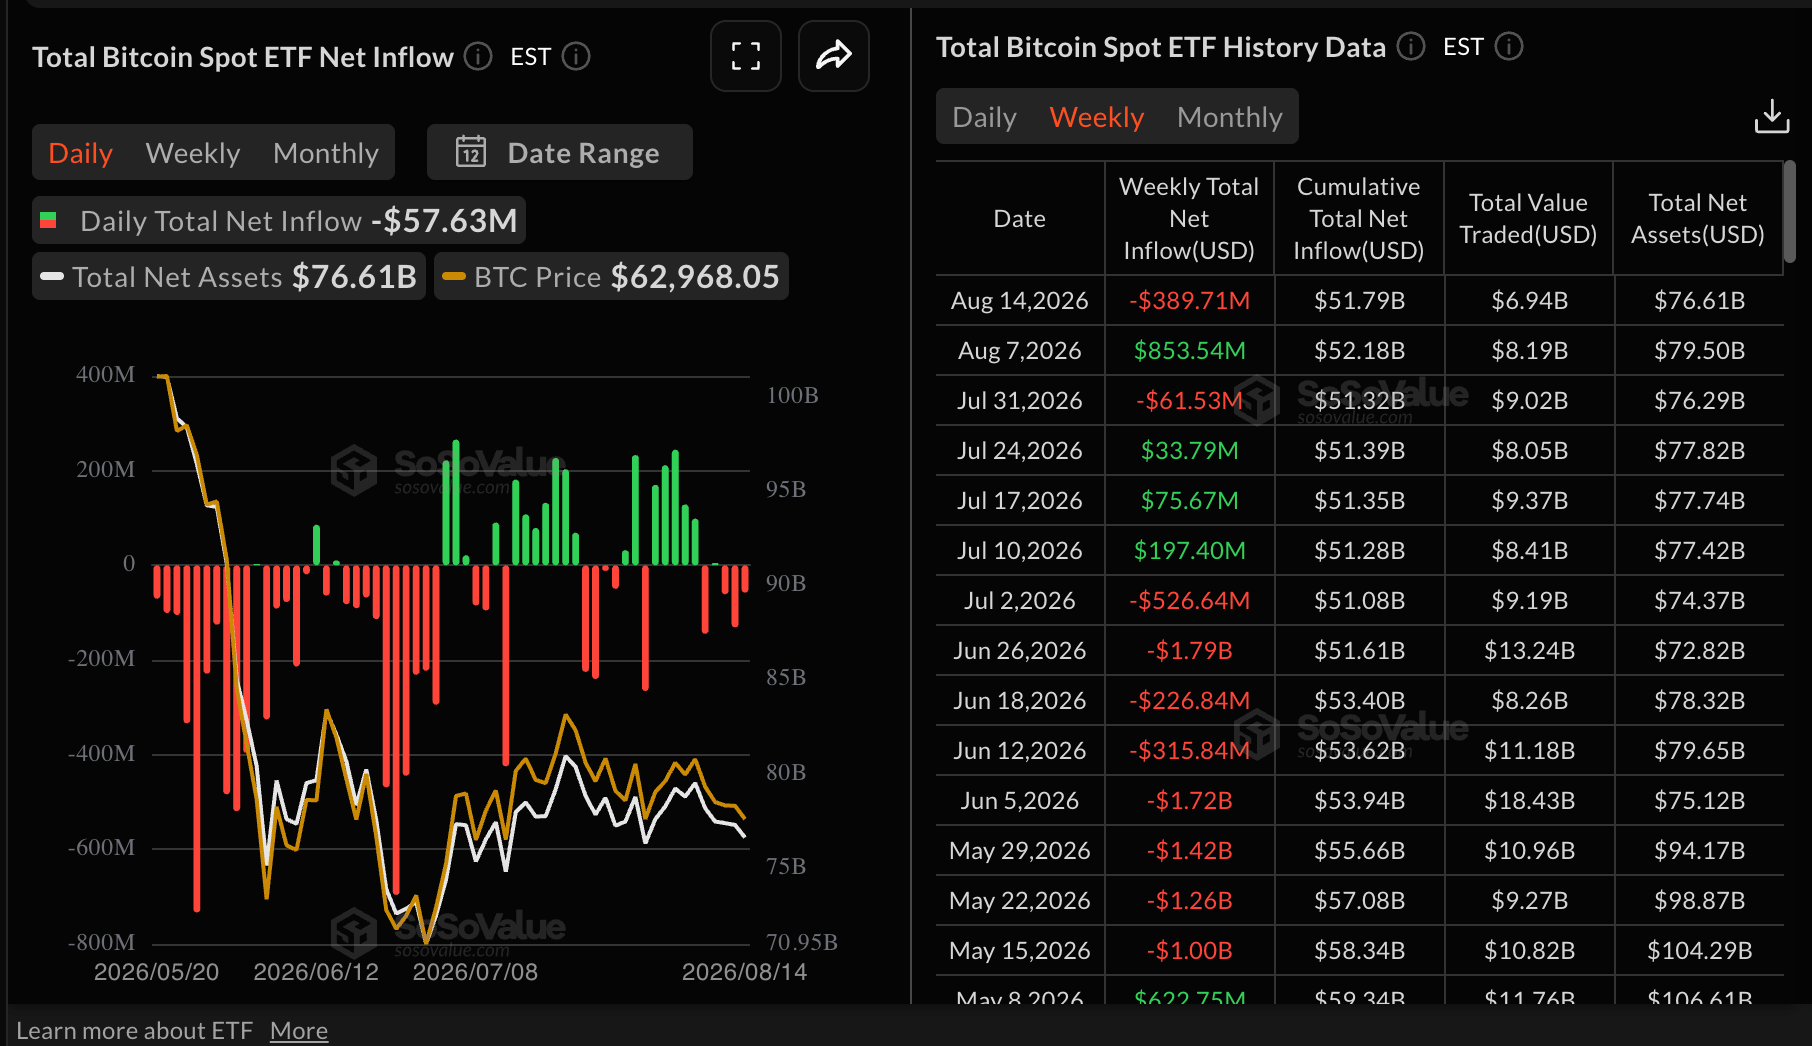
Bitcoin spot Exchange-Traded Funds (ETFs) recorded outflows totaling $390 million last week through Friday, aligning with risk-off sentiment and weakening demand.
Despite the returning outflows, cumulative inflows remain positive at $51.79 billion, with net assets at $76.61 billion, suggesting investors hold a long-term constructive outlook on the largest cryptocurrency by market capitalization.
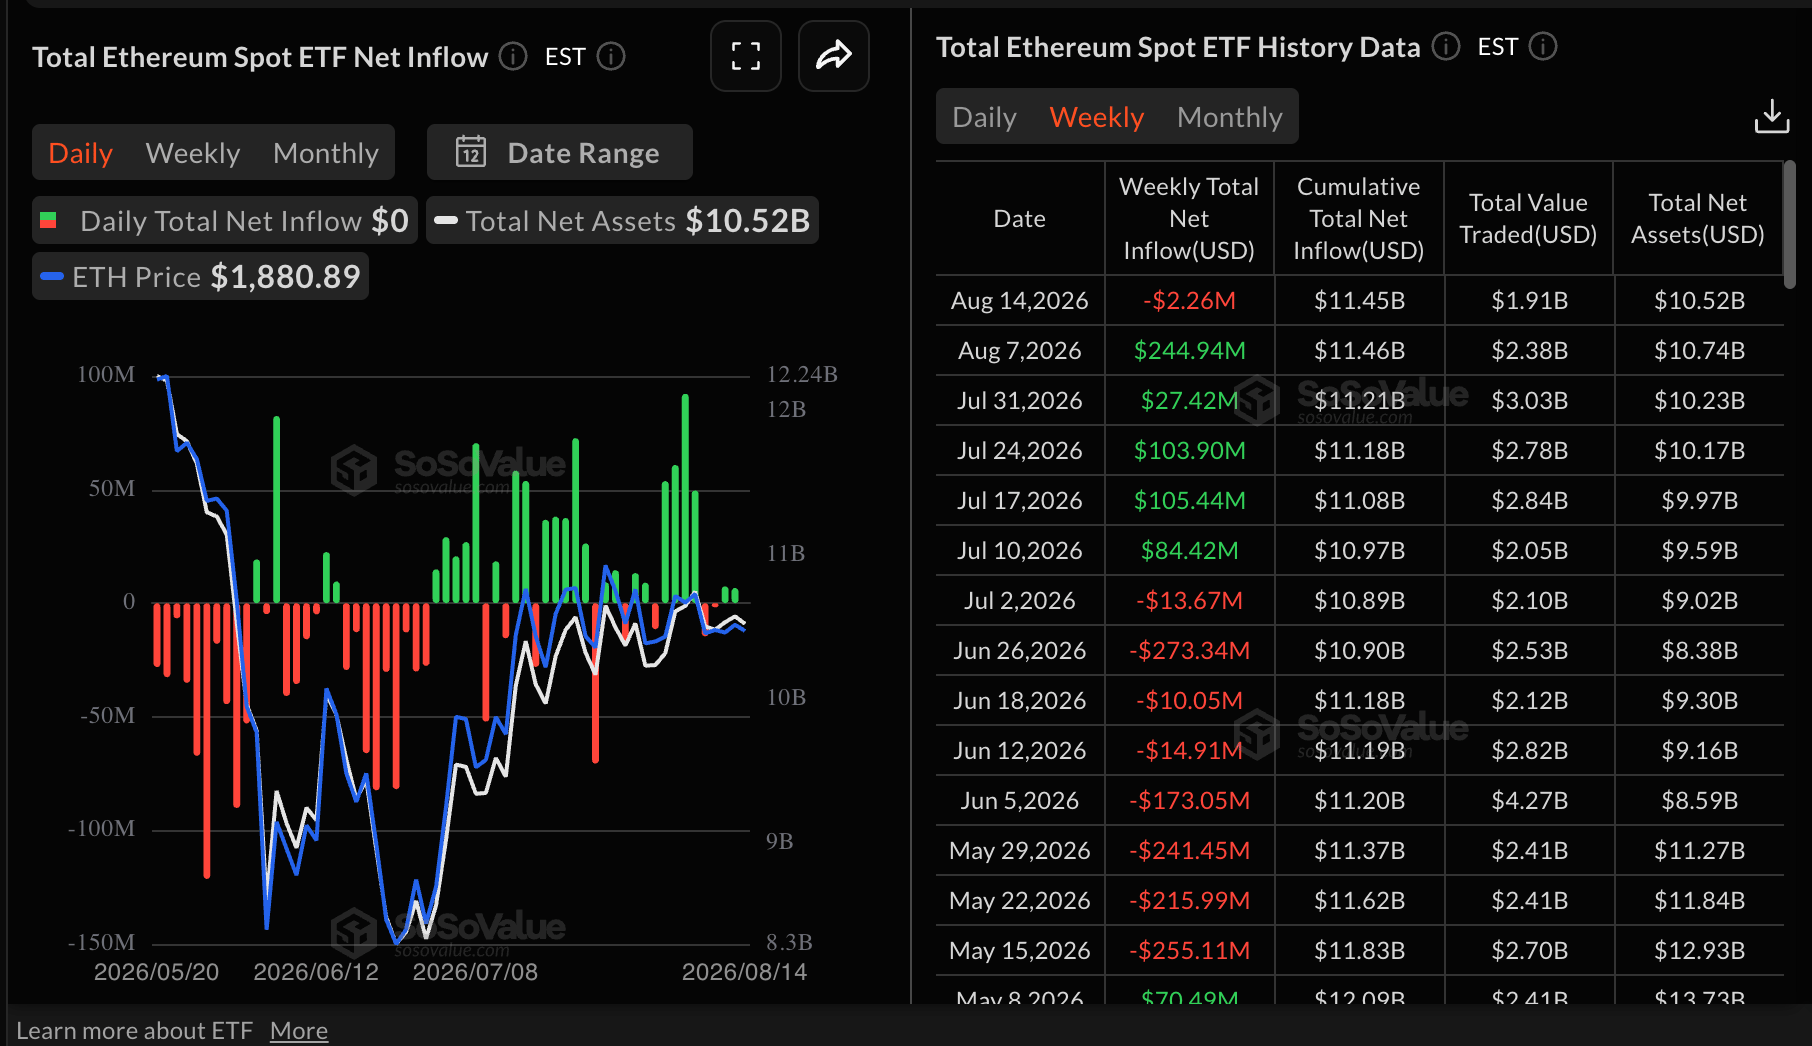
Ethereum also faced headwinds last week, as spot ETF outflows returned, totaling $2.26 million through Friday. This mild bearish shift broke five consecutive weeks of inflows. Meanwhile, cumulative inflows remain positive at $11.45 billion, while net assets under management stand at $10.52 billion.
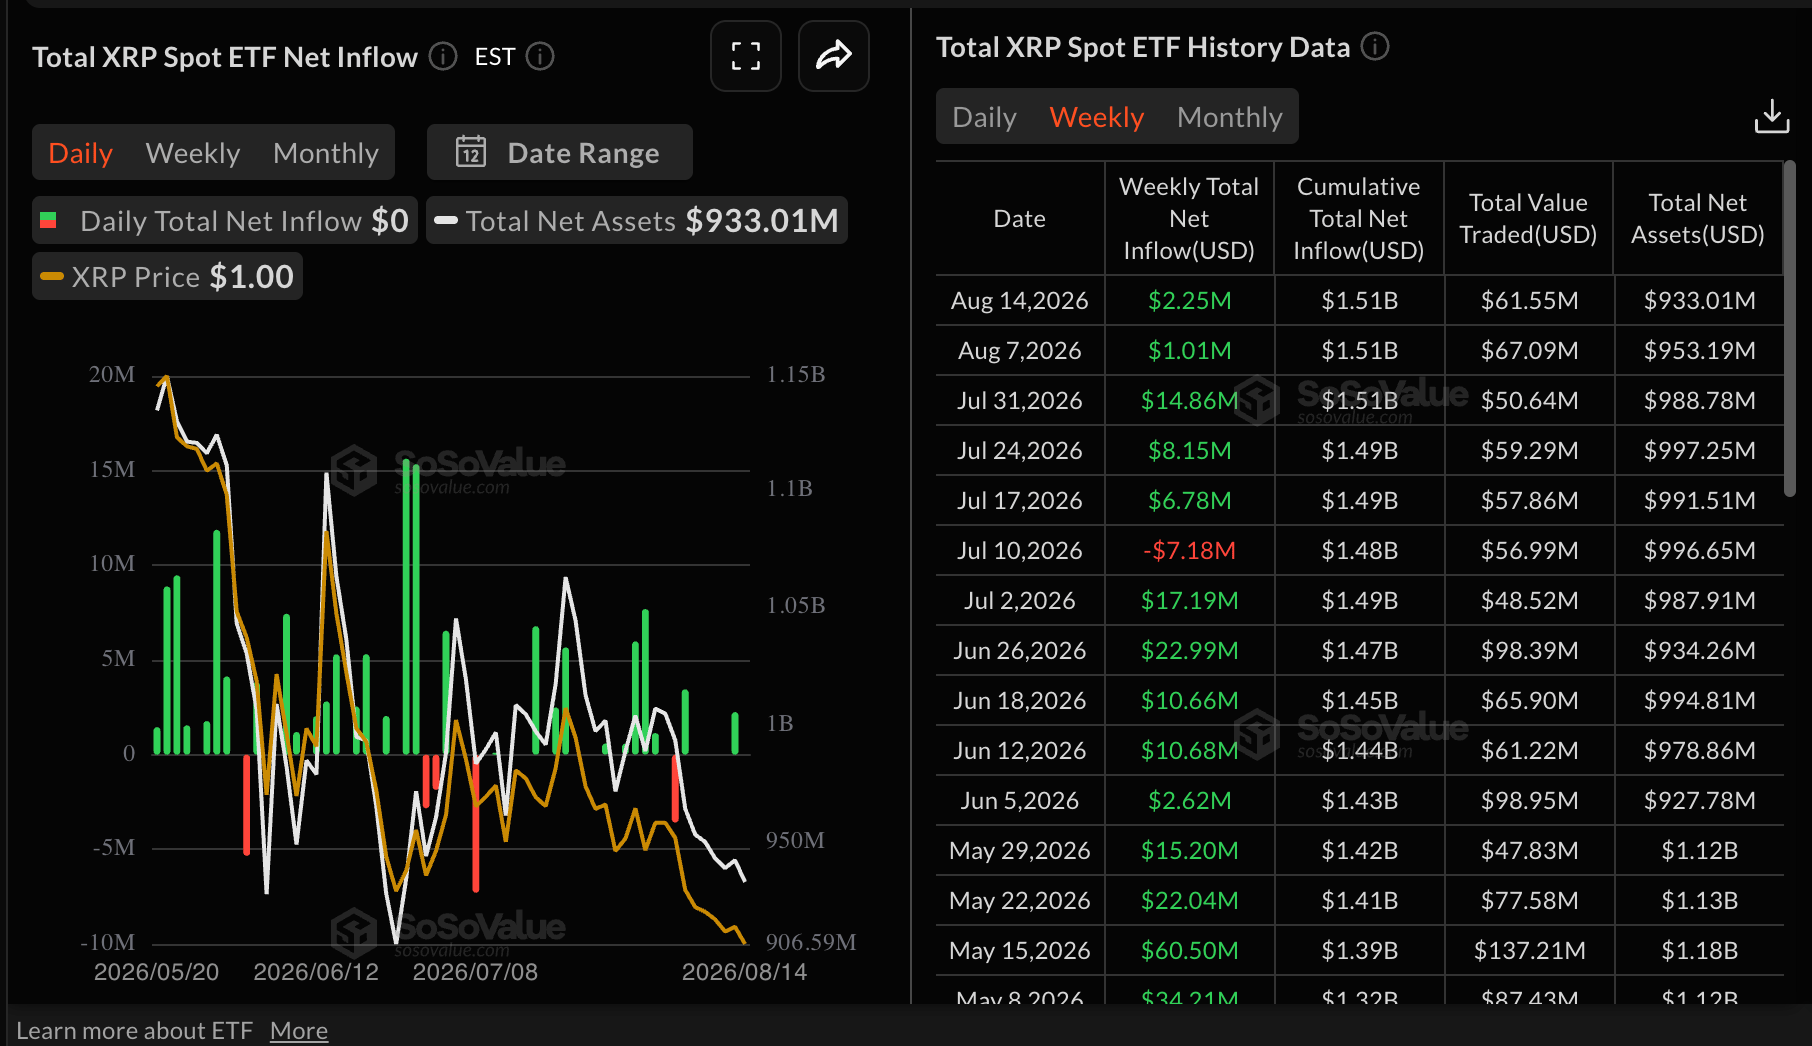
XRP spot ETFs retained a steady bullish streak, with mild inflows of $2.25 million recorded last week through Friday. This marks the fifth consecutive week of inflows, underpinning risk-on sentiment. Cumulative inflows average $1.51 billion, with net assets at $933 million.
Technical analysis: Bitcoin holds key support
Bitcoin trades at $63,416, maintaining a bearish near-term bias as it holds below key Exponential Moving Averages (EMAs). The spot price remains capped below the 50-day EMA at $64,317, with the 100-day and 200-day EMAs higher at $66,393 and $72,390, respectively, keeping the broader trend under downside pressure. The Relative Strength Index (RSI) at 46 leans slightly negative on the daily chart, while the Moving Average Convergence Divergence (MACD) remains in negative territory, both suggesting waning bullish momentum after recent rebounds.
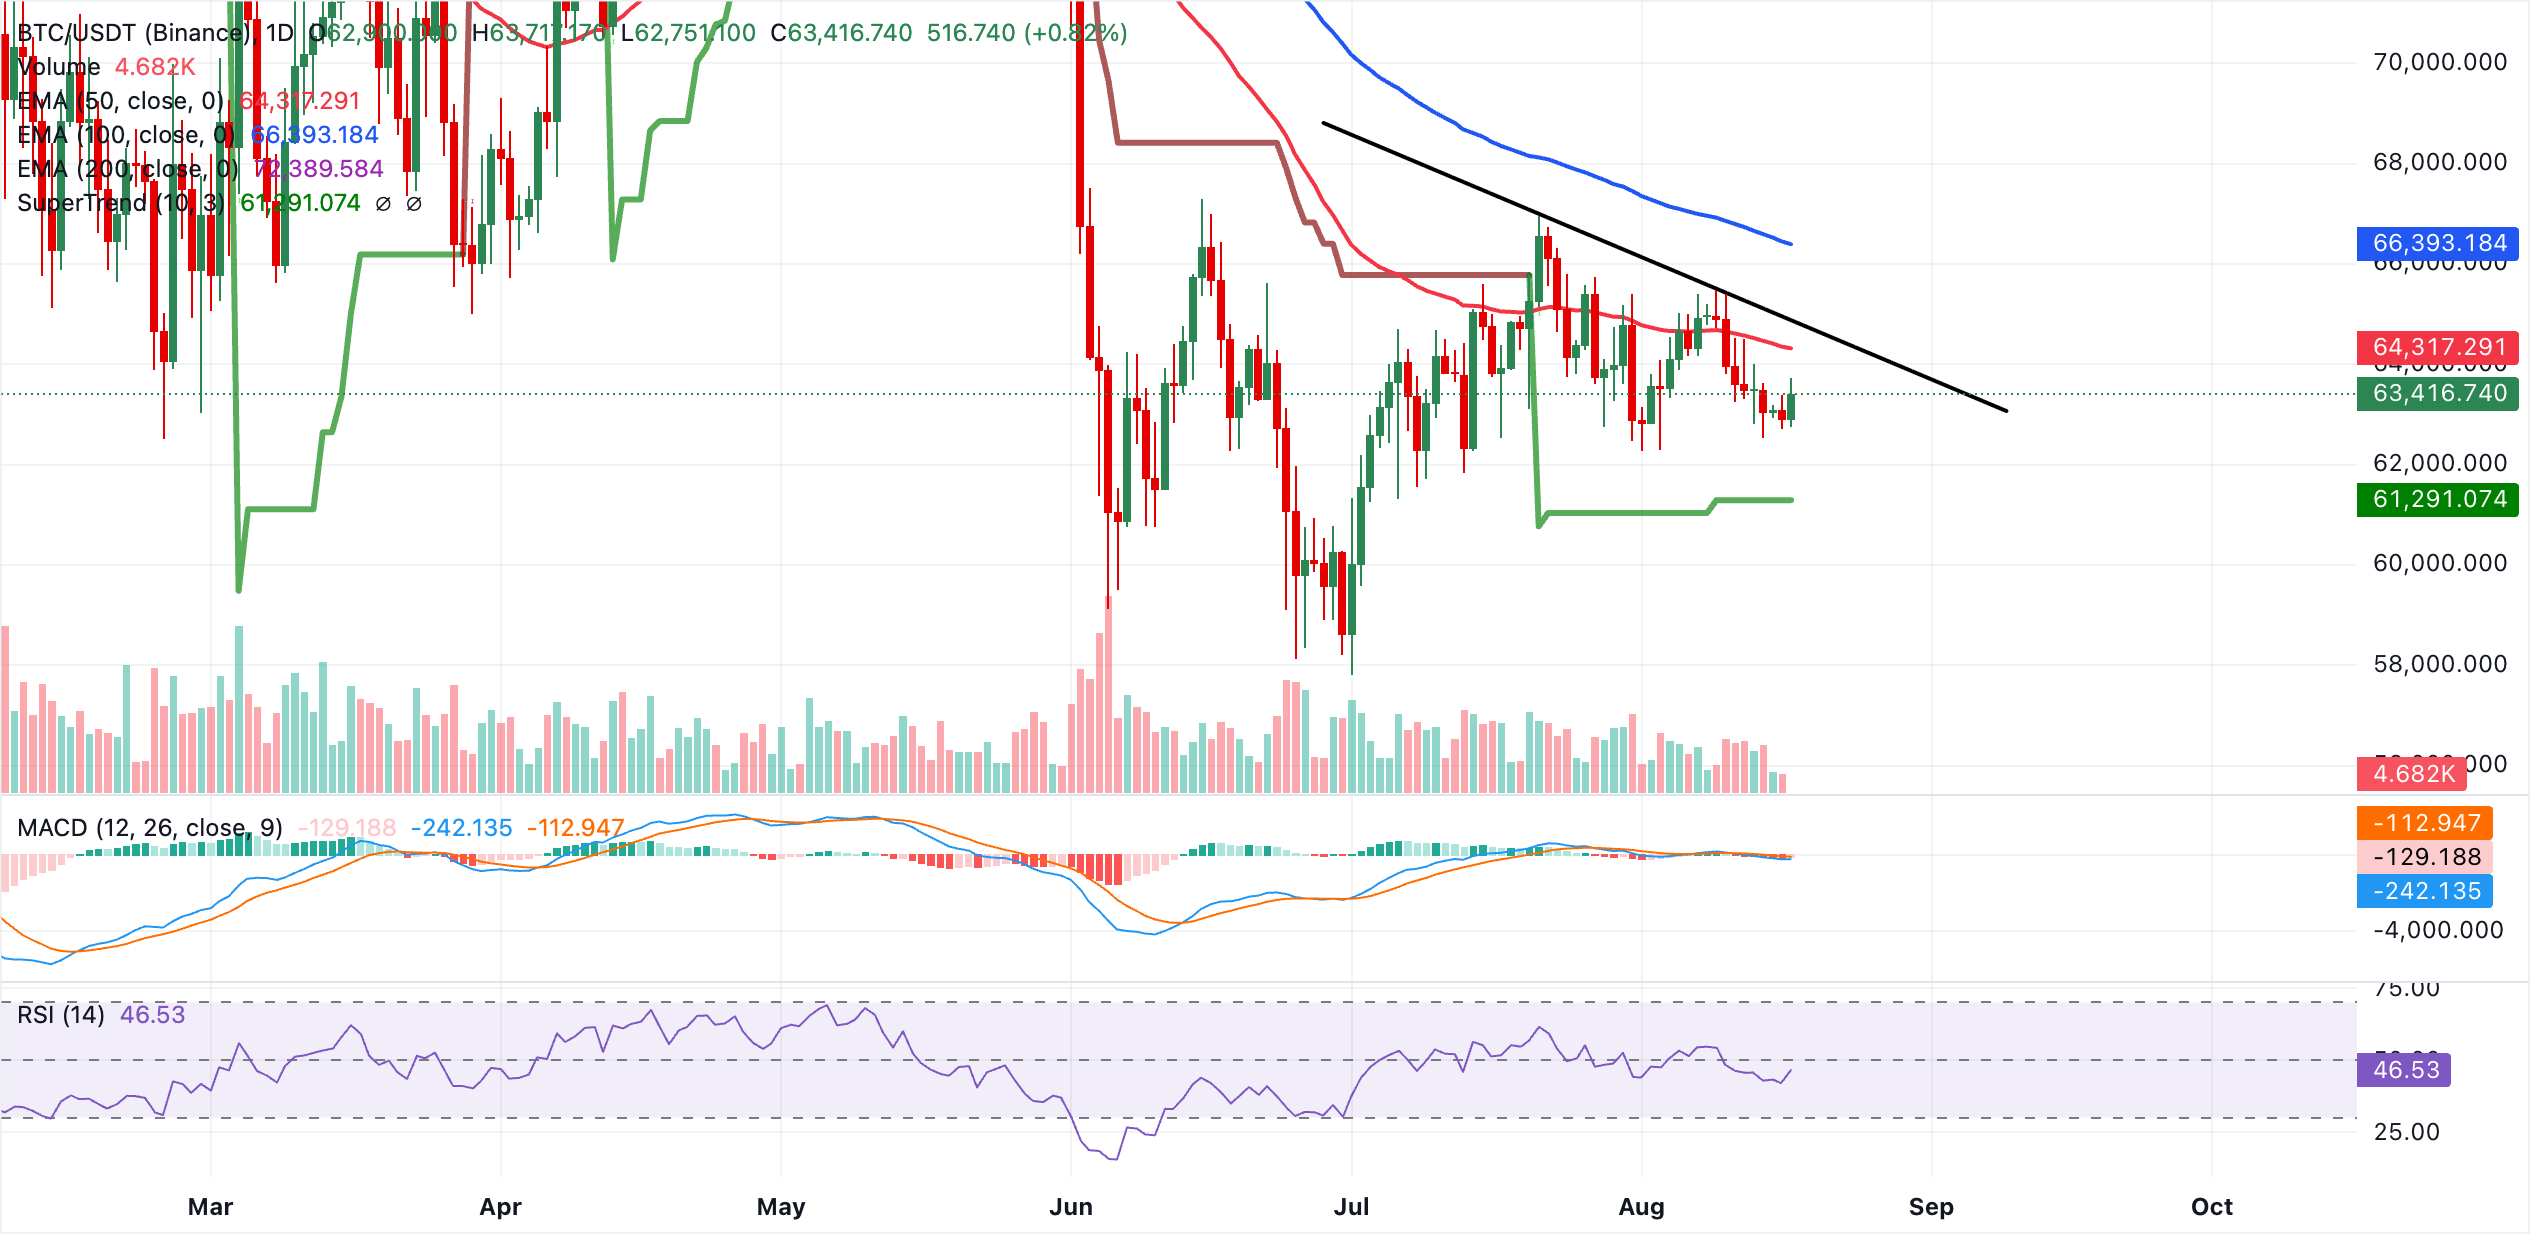
Initial resistance lies at the 50-day EMA around $64,317, followed by the downward resistance trendline break area near $64,850. A daily close above this cluster would be needed to ease the current cap. Further up, the 100-day EMA at $66,393 and the 200-day EMA at $72,390 act as successive resistance layers within the broader corrective structure. On the downside, the SuperTrend line at $61,291 offers the first notable support, and a break below this level would expose deeper retracement risk in the days ahead.
According to analysts at Santiment, selling pressure will likely remain high on exchanges, as exchange balances rose to 18,000 BTC last week, up from 4,200 the previous week.
“Coins on an exchange are easier to sell, so this cuts against the accumulation story. Whoever bought the panic in early August was not the dominant flow this week,” Santiment researchers said in the weekly report.
Altcoins technical outlook: Ethereum and XRP build mild recovery momentum
Ethereum trades at $1,894, holding a neutral-to-slightly bullish tone as the price sits above the 50-day EMA at $1,868 and the SuperTrend support near $1,769, yet remains capped beneath the 100-day EMA at $1,918 and well under the longer-term 200-day EMA at $2,108. This setup suggests the market has stabilized above near-term trend support but has not yet reclaimed its broader bearish breakdown area.
The RSI around 53 leans mildly constructive without signaling overbought conditions, while the negative MACD reading below zero hints that upside momentum remains fragile despite the recent recovery.
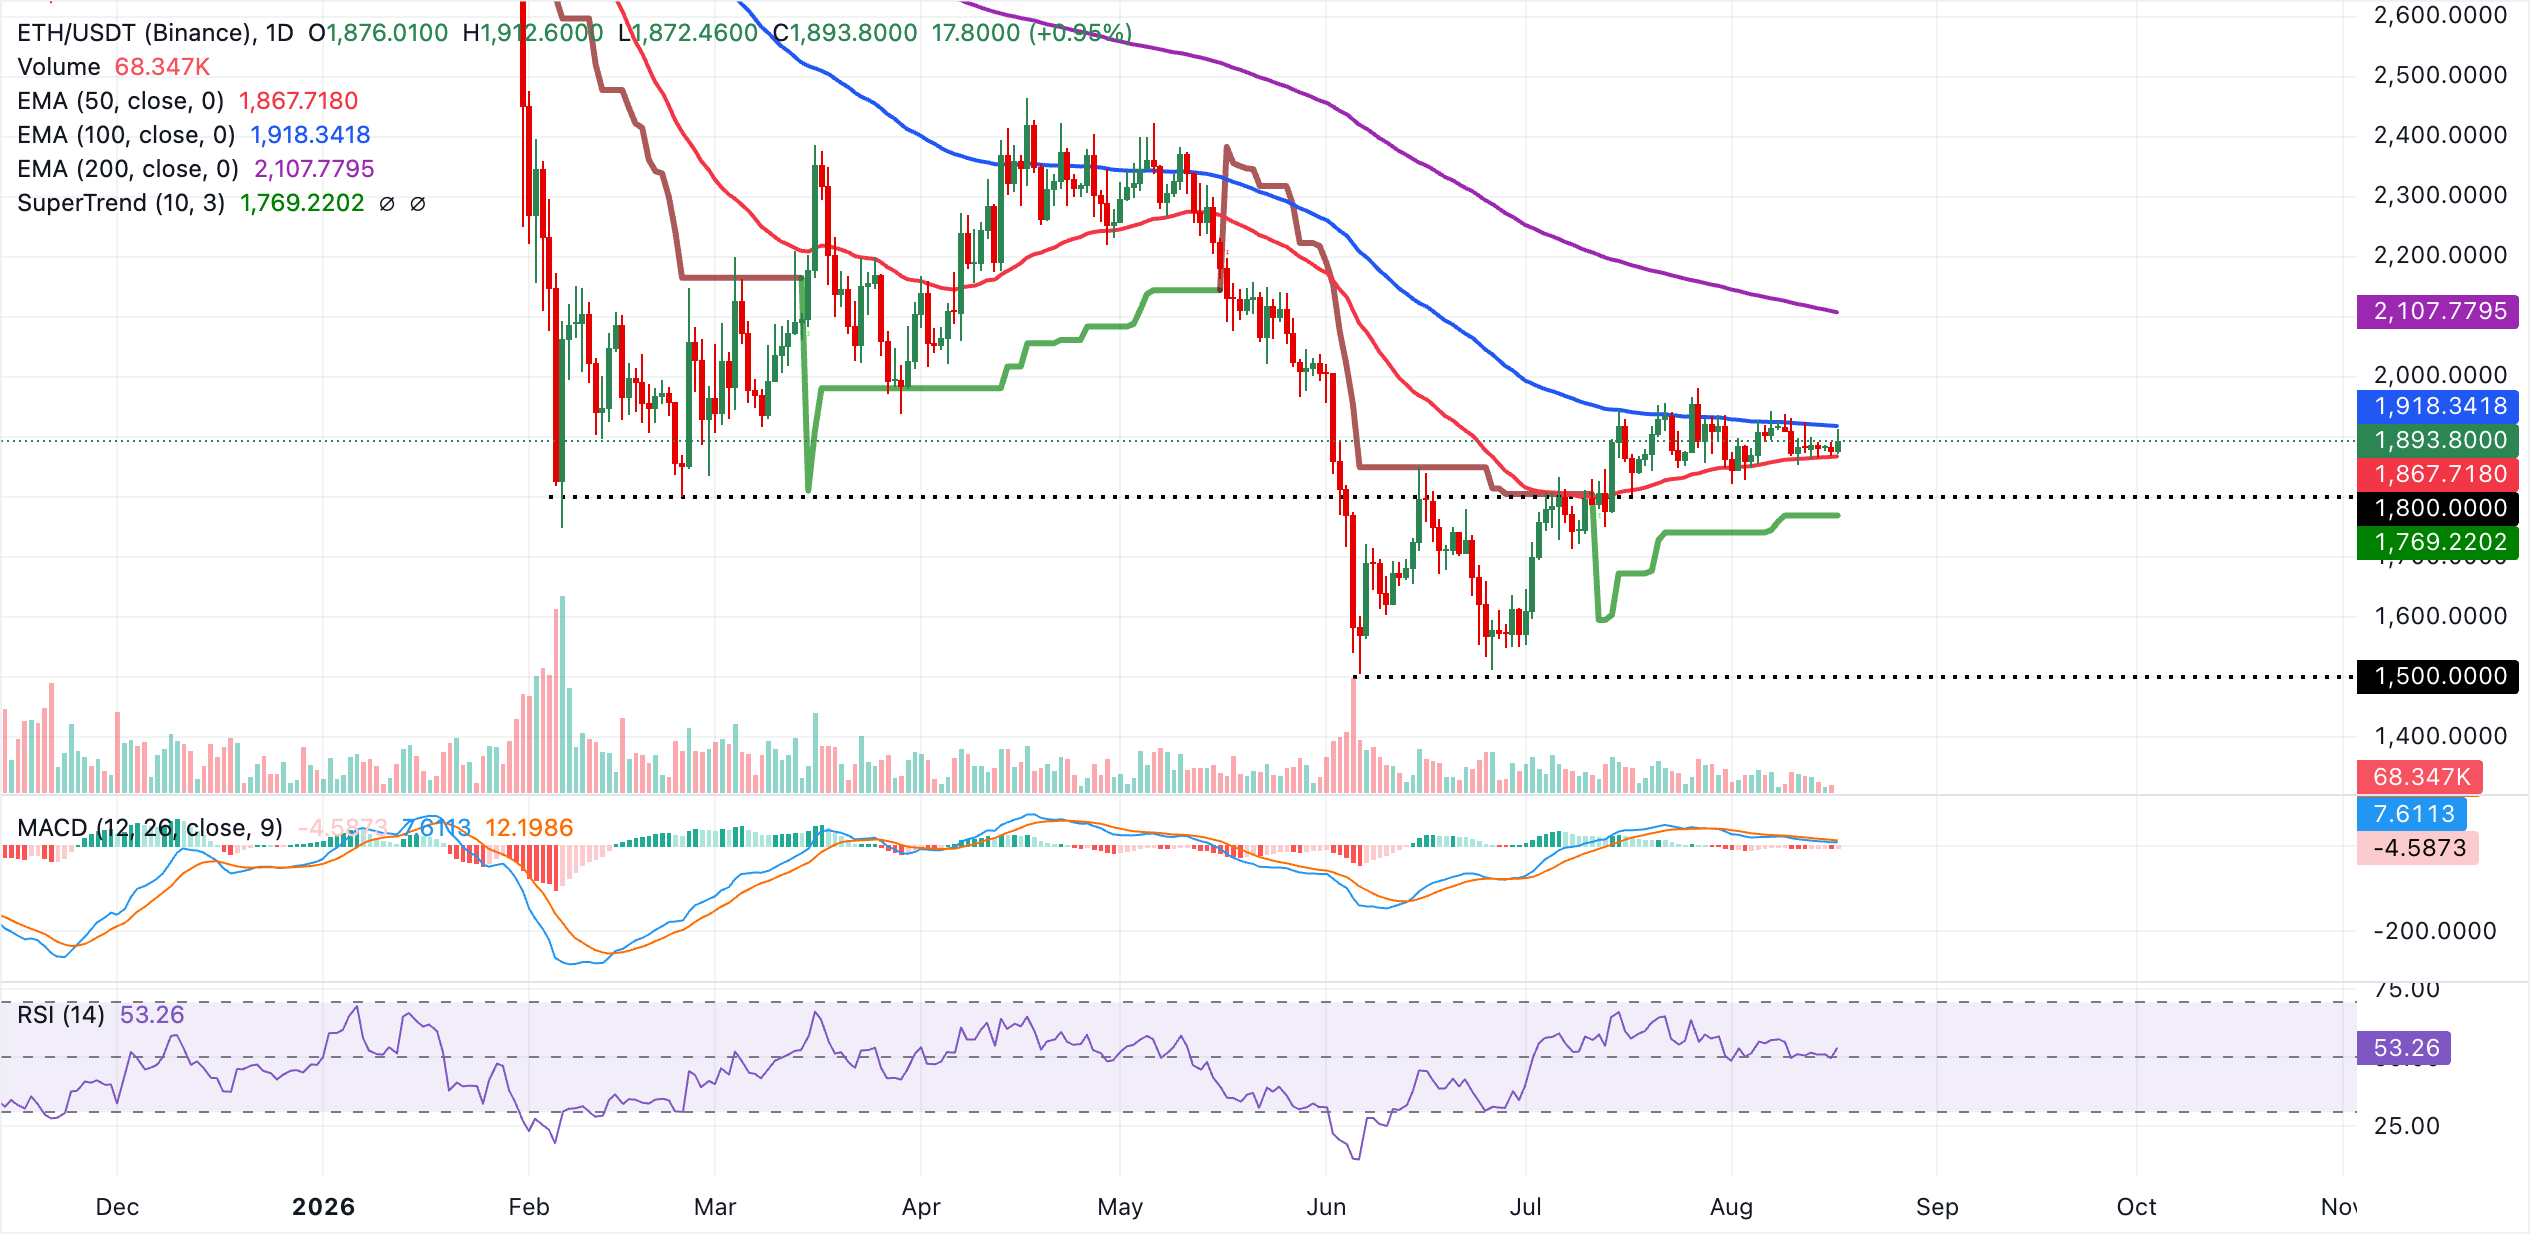
On the topside, immediate resistance sits at the 100-day EMA at $1,918. A daily close above this level would open the door to the 200-day EMA at $2,108, where sellers would likely regroup. On the downside, initial support is seen at the 50-day EMA at $1,868, with a break below exposing the SuperTrend line near $1,769 as the next key demand zone. A loss of this latter floor would undermine the nascent constructive bias and reassert the broader bearish backdrop.
XRP, on the other hand, trades at $1.00, maintaining a bearish near-term tone as price holds beneath the key EMAs and the active SuperTrend line. The pair is capped by the downward resistance trendline, with a break level of $1.01, while the 50-day, 100-day, and 200-day EMAs at $1.08, $1.16, and $1.35, respectively, stack overhead and suggest sellers still dominate.
Momentum aligns with this stance, as the RSI hovers near 37, staying in bearish territory, and the MACD remains negative, hinting that downside pressure is not yet exhausted despite some stabilization around parity.
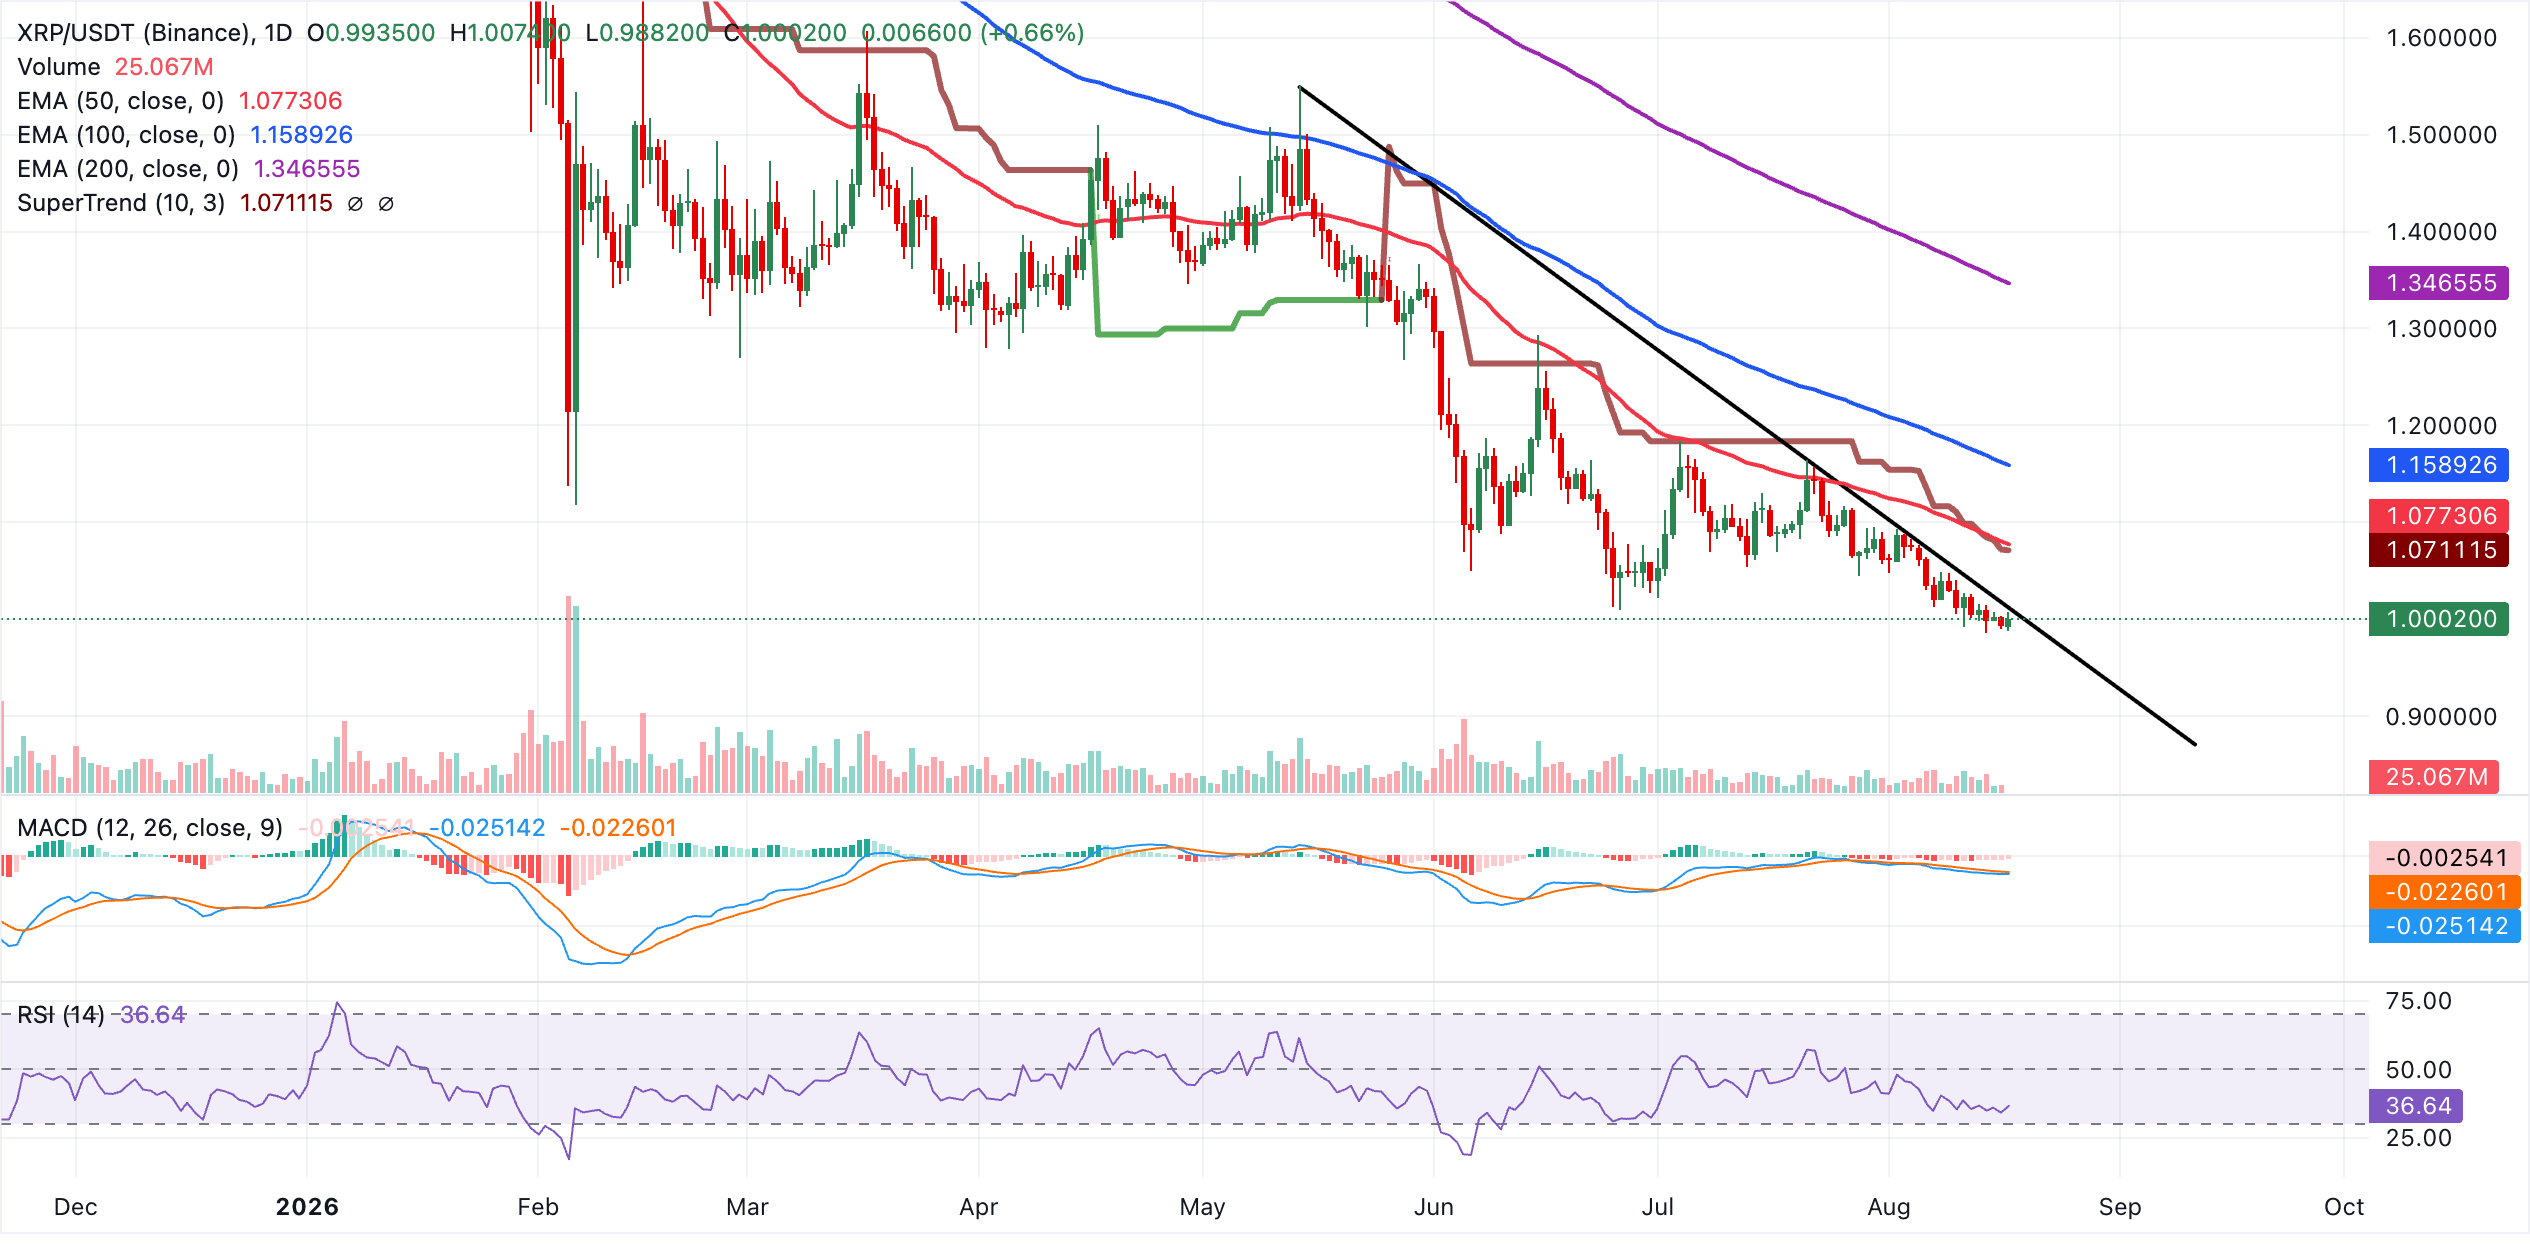
On the topside, initial resistance lies at the descending trendline break level at $1.01, and a sustained move above this barrier would open the way toward the SuperTrend line around $1.07. Further up, the 50-day EMA at $1.08 is the next hurdle, while a stronger recovery would likely struggle near the 100-day EMA at $1.16, with the 200-day EMA at $1.35 serving as a broader bearish pivot. A daily close back above $1.01 is needed to ease the immediate downside bias, whereas failure to reclaim that level would keep XRP vulnerable to renewed selling around the 1.00 area.
(The technical analysis of this story was written with the help of an AI tool. Know more.)
Open Interest, funding rate FAQs
Higher Open Interest is associated with higher liquidity and new capital inflow to the market. This is considered the equivalent of increase in efficiency and the ongoing trend continues. When Open Interest decreases, it is considered a sign of liquidation in the market, investors are leaving and the overall demand for an asset is on a decline, fueling a bearish sentiment among investors.
Funding fees bridge the difference between spot prices and prices of futures contracts of an asset by increasing liquidation risks faced by traders. A consistently high and positive funding rate implies there is a bullish sentiment among market participants and there is an expectation of a price hike. A consistently negative funding rate for an asset implies a bearish sentiment, indicating that traders expect the cryptocurrency’s price to fall and a bearish trend reversal is likely to occur.
Recommended Articles


