




Ripple and Stellar outlook: XRP and XLM steady as derivatives data points to easing downside pressure
- XRP steadies at $1.076 on Tuesday, holding above its key $1 support zone.
- XLM faces rejection from the $0.173 level, keeping upside capped.
- Derivatives metrics turn slightly bullish, while momentum indicators show fading bearish strength for both altcoins.
Ripple (XRP) and Stellar (XLM) show mixed price action on Tuesday, with XRP holding above the key $1 support zone while XLM faces rejection at $0.173. Meanwhile, improving derivatives metrics alongside fading bearish momentum suggest that the downside pressure may be easing for both altcoins.
Derivatives data supports a recovery ahead
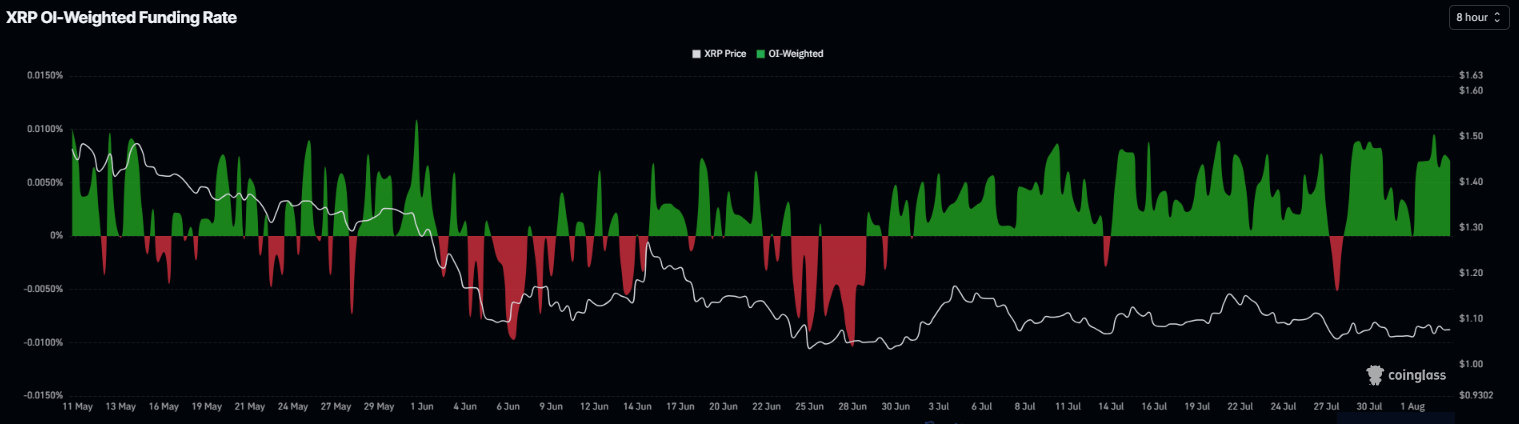
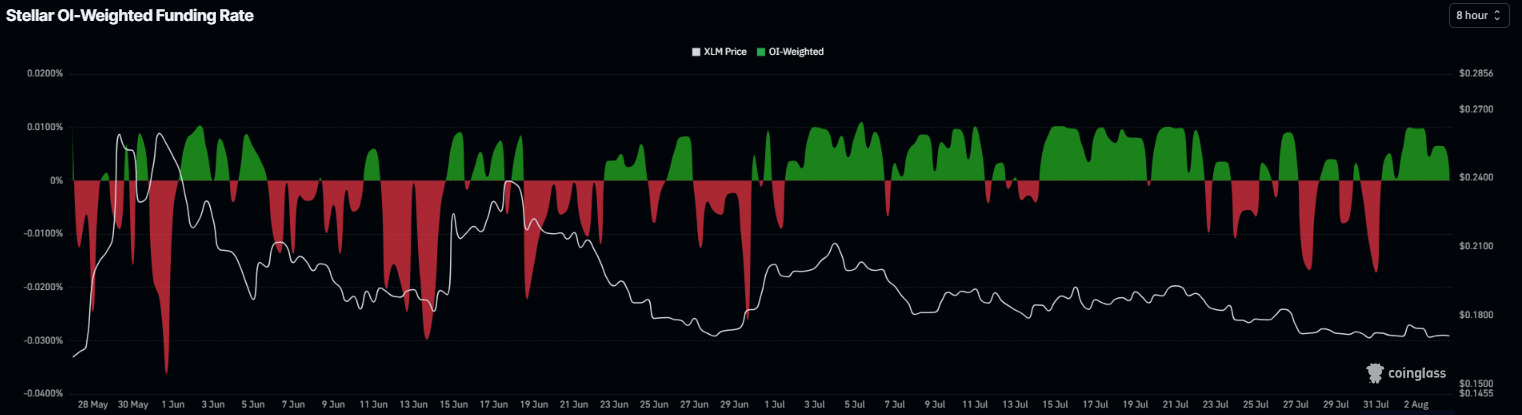
Derivatives data shows mild bullish sentiment among traders. CoinGlass’ funding rates metric for XRP and XLM flipped positive on July 28 and July 31, respectively, reading 0.0070% and 0.0017% on Tuesday. These positive rates indicate that long traders are paying shorts and reflect a bullish bias for both altcoins.
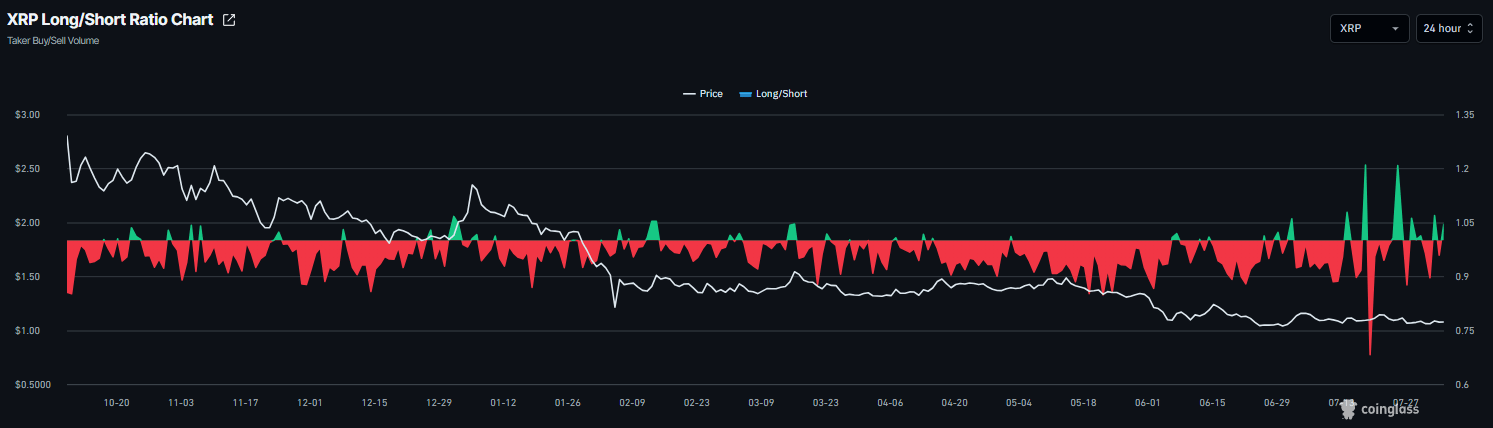
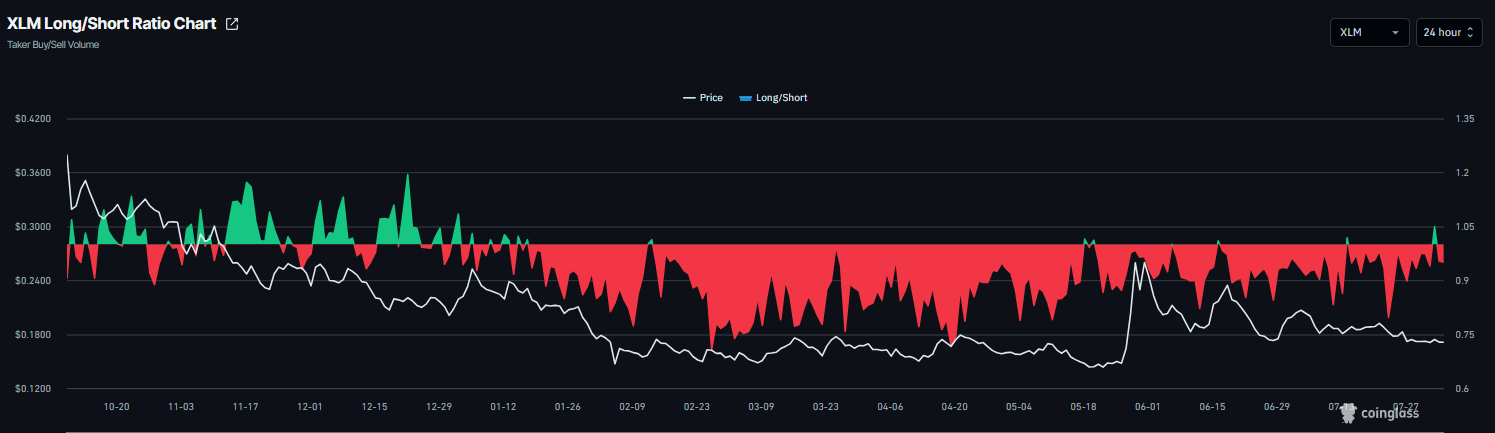
In addition, CoinGlass’ long-to-short ratio for XRP reads 1.04 on Tuesday. A ratio above one indicates bullish sentiment, as traders are betting the asset price will rise. Meanwhile, XLM's ratio has dropped to 0.94 on Tuesday, indicating traders are increasingly betting on further downside.
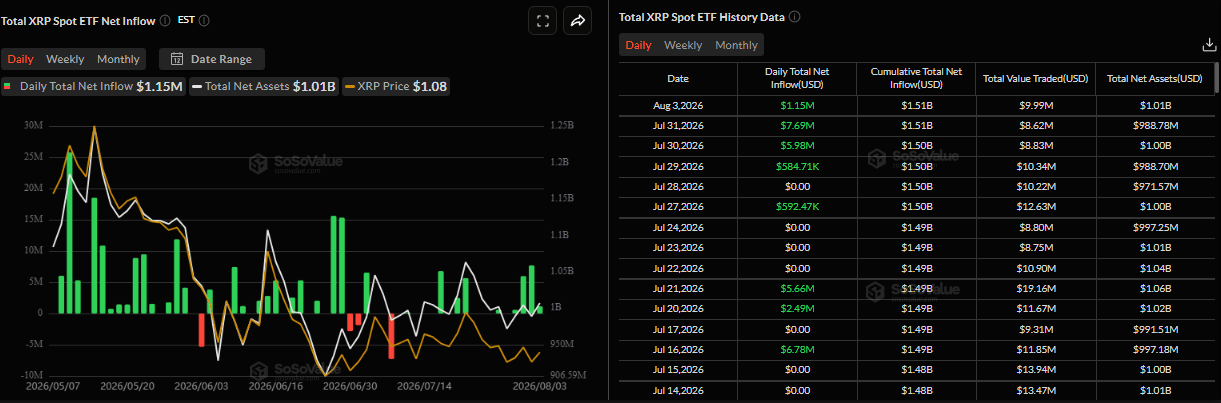
SoSoValue data shows that spot Exchange Traded Funds (ETFs) recorded an inflow of $1.15 million on Monday, marking the fourth consecutive day of positive flows since last week. If these inflows continue and intensify throughout the week, XRP could extend the recovery ahead.
XRP technical outlook: Holds above key $1 support
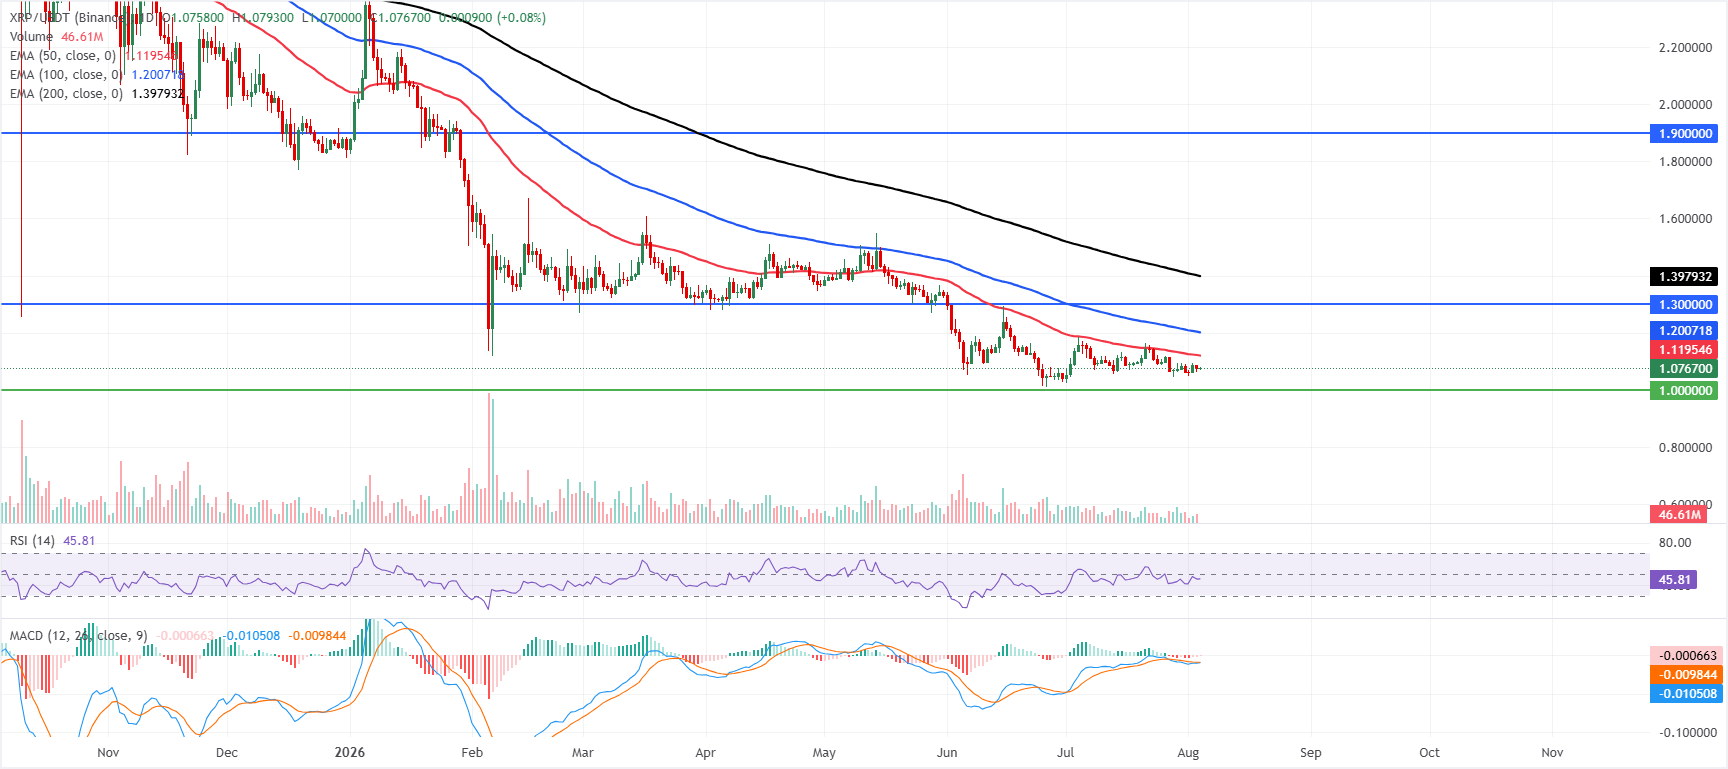
XRP price trades at $1.076 on Tuesday, keeping a bearish near-term tone as it holds below the key exponential moving averages (EMAs). The 50-day EMA at $1.119, the 100-day EMA at $1.200 and the 200-day EMA at $1.397 all sit overhead and collectively suggest that recent rebounds remain corrective within a broader downside phase.
Momentum is subdued, with the Relative Strength Index (RSI) hovering near 45 and the Moving Average Convergence Divergence (MACD) line marginally below zero, hinting that selling pressure still outweighs buying interest.
On the downside, immediate support is seen at the horizontal level around $1.000, where buyers could attempt to stabilize the pair if weakness extends.
On the topside, initial resistance appears at the 50-day EMA at $1.119, followed by the 100-day EMA at $1.200 and the prior horizontal barrier at $1.300; a sustained break above these levels would be needed to ease the current bearish bias before the more distant 200-day EMA at $1.397 and the structural resistance near $1.900 come into play.
XLM technical outlook: Faces rejection from key resistance zone
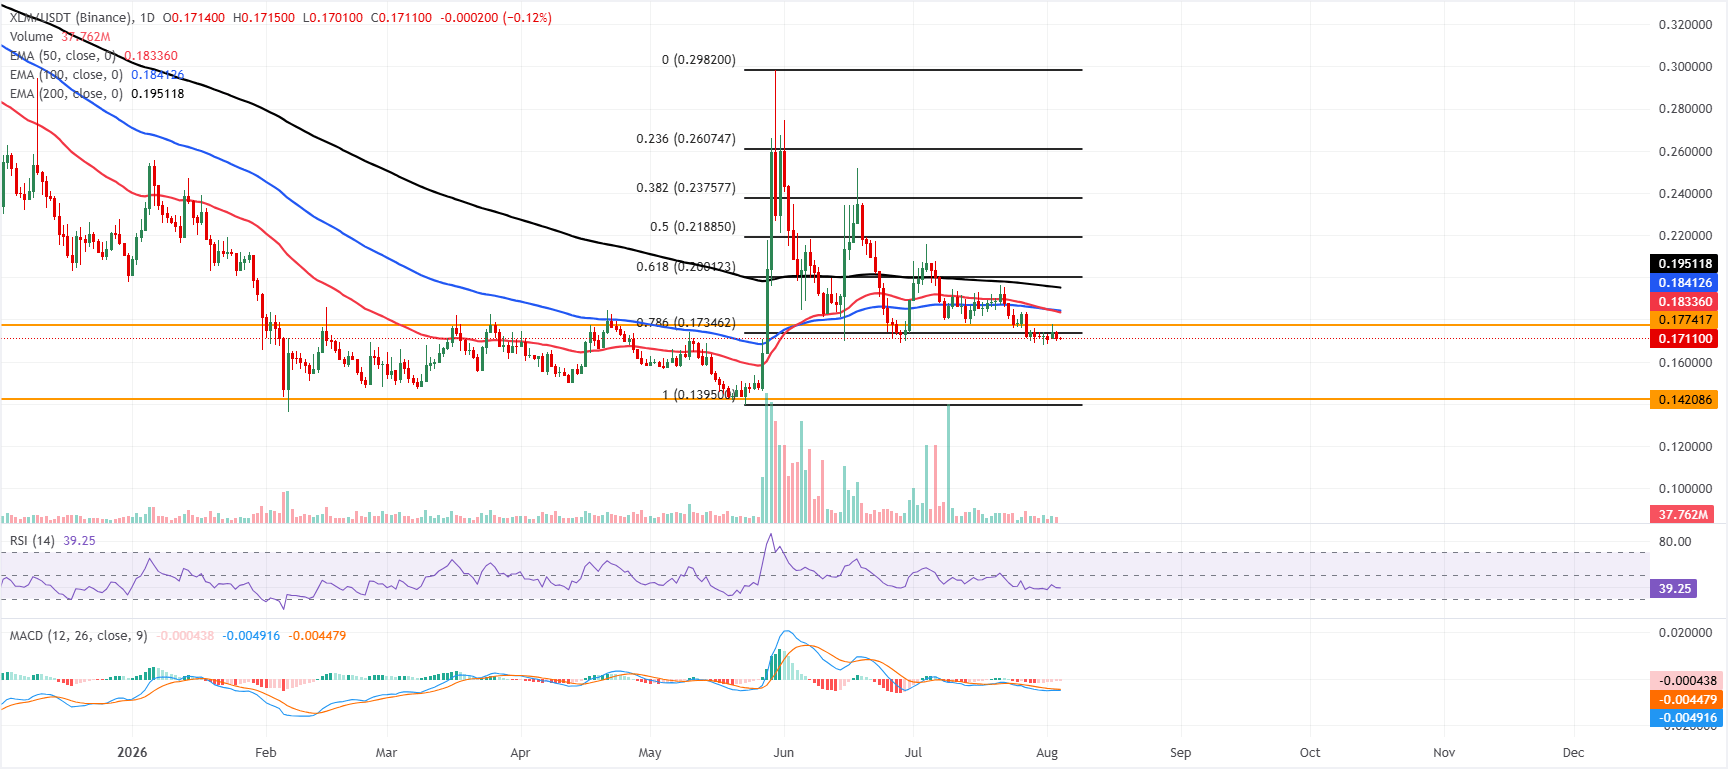
XLM price trades at $0.170 on Tuesday, keeping a bearish near-term bias as price holds below the 50-day, 100-day and 200-day EMAs clustered between $0.183 and $0.195. The pair is also trading beneath the 78.6% Fibonacci retracement at $0.173 and the nearby horizontal barrier at $0.177, while the RSI around 39 and a negative MACD reading hint at lingering downside pressure rather than an immediate recovery.
On the topside, initial resistance is seen at the 78.6% Fibonacci retracement at $0.173, followed by the horizontal cap at $0.177, with the 50-day and 100-day EMAs at $0.183 and $0.184 reinforcing a broader supply zone ahead of the 200-day EMA at $0.195 and the 61.8% Fibonacci retracement at $0.200.
On the downside, immediate support is defined by the recent daily open pivot at $0.170, while a deeper slide would expose the horizontal floor at $0.142 and the broader cycle low near $0.139.
(The technical analysis of this story was written with the help of an AI tool. Know more.)
Recommended Articles


