




Stellar XLM Bucks Trend to Surge Over 20%, Momentum Reversal or Bull Trap?
TradingKey - On May 28, while cryptocurrencies generally declined, Stellar ( XLM) bucked the trend to rally independently. Over the past 24 hours, Stellar surged more than 20%, reaching a high near $0.18—a new peak since April 22—making it today's top-performing cryptocurrency.
As of press time, the XLM price has pulled back slightly, with gains narrowing to around 14%, yet it remains the biggest gainer in the crypto market, significantly outperforming major coins. Today, Bitcoin ( BTC) fell more than 3%, dropping below $75,000; Ethereum ( ETH) shed over 4%, losing the $2,000 mark, while Binance Coin ( BNB ), Ripple ( XRP ), and others all experienced varying degrees of decline.
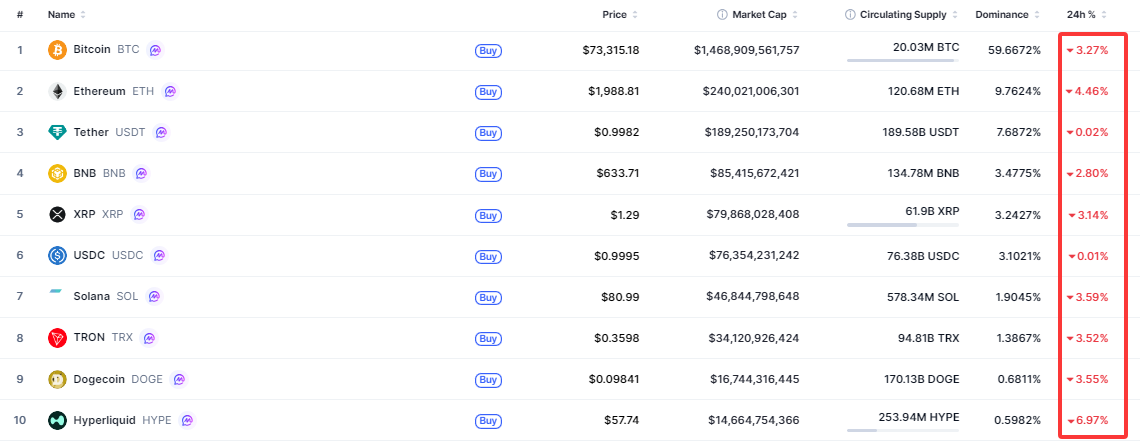
Price changes of the top 10 cryptocurrencies by market cap, Source: CoinMarketCap
What is Stellar (XLM)?
Stellar is a public blockchain focused on cross-border payments and asset tokenization (RWA), with XLM serving as the network's native token. Founded in 2014, Stellar was established by Jed McCaleb, a legendary figure in the cryptocurrency space. Notably, McCaleb was also a co-founder of Ripple ( XRP ), leaving to create Stellar following disagreements with the Ripple team.
While both XLM and XRP are designed to address cross-border payment issues, they differ in several key areas, as detailed below:
Stellar (XLM) | Ripple (XRP) | |
Launch Date | 2014 | 2012 |
Governing Body | Stellar Development Foundation (SDF): Non-profit organization | Ripple Labs: For-profit technology enterprise |
Target Audience | Individual users, fintech companies, RWA issuers, and small-to-medium payment gateways | Large multinational banks, central banks, and top-tier market makers |
Transaction Throughput | Tested at approximately 160+, with a theoretical upper limit of 5,000 TPS | Tested at approximately 10–20, with a theoretical upper limit of around 1,500+ TPS |
What is behind the sudden surge in Stellar (XLM)?
On May 27, the Depository Trust & Clearing Corporation (DTCC), which oversees more than $100 trillion in global securities and assets and handles the vast majority of clearing and settlement for U.S. securities markets, announced that its Depository Trust Company (DTC) asset tokenization service platform will officially integrate with the Stellar blockchain network, with a formal launch scheduled for the first half of 2027.
The DTCC and the Stellar Development Foundation may migrate traditional core Wall Street assets to the Stellar network in the future, including Russell 1000 constituents, large-cap index ETFs, as well as U.S. Treasuries and bonds. Following the announcement, the price of Stellar (XLM) surged rapidly—can it maintain this upward momentum?
Can Stellar sustain its upward momentum?
Although the DTCC's announced integration with Stellar is set to increase its on-chain Total Value Locked (TVL) and fee burning by its 2027 implementation, this implies that a short-term breakout is unlikely, and the asset is prone to a sideways consolidation phase once the initial frenzy cools. Furthermore, factors such as the situation in the Middle East and fading hopes for Federal Reserve rate cuts have triggered broad weakness in the cryptocurrency market, which will also weigh on XLM's price performance—a trend evidenced by today’s price action as XLM surged and then pulled back.
From a technical perspective, XLM's price has risen to around $0.18, a strong resistance level that has withstood multiple breakout attempts since February and is likely to trigger selling pressure. Should XLM break through this resistance, it could potentially surge by nearly 40% to challenge the next resistance level at $0.25; otherwise, it may retreat toward the year-to-date low of $0.14.
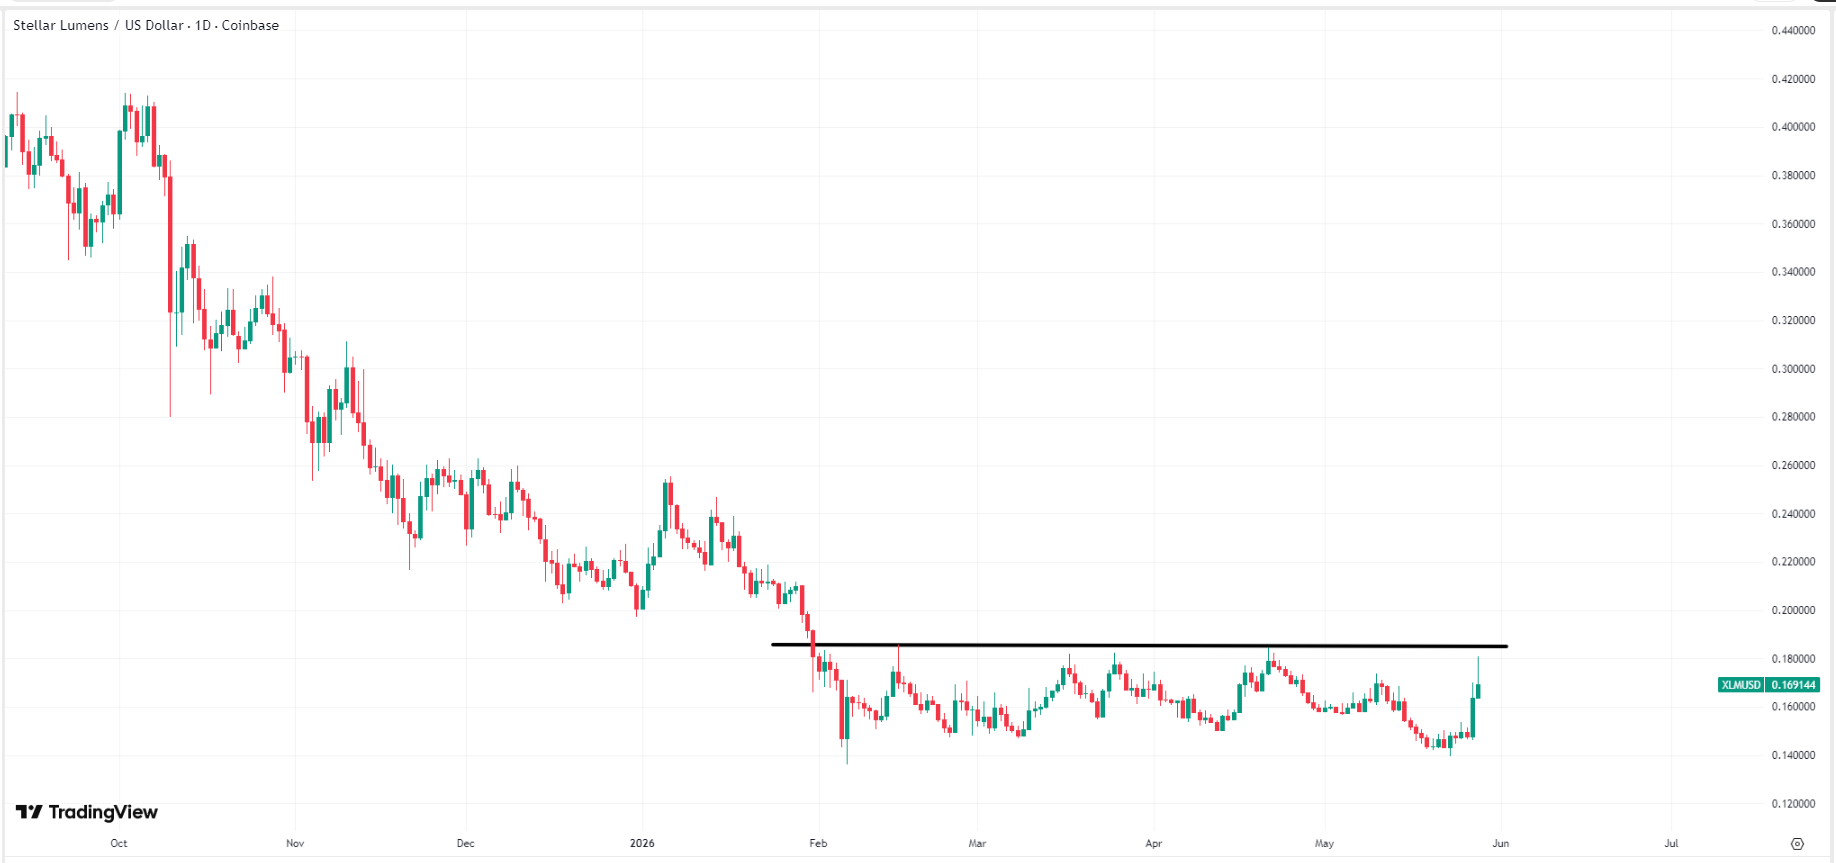
XLM price chart, Source: TradingView
Recommended Articles


