




This Bitcoin Pattern Could Repeat Itself, But The Bottom Could Lie Below $50,000


Bitcoin is showing a monthly momentum signal that has appeared near several major cycle lows, which raises the possibility that the current correction is entering its final stage.
The setup is based on the monthly logarithmic MACD histogram, where previous Bitcoin bottoms formed only when the red bars began fading for at least two straight months. The same signal may now be forming again, but there is one important catch.
Bitcoin MACD Repeating Bottom Pattern
The technical outlook in question is based on the monthly candlestick timeframe chart, but May has not closed yet, and Bitcoin is still trading in a fragile zone below $76,000 after failing to hold above the $80,000 region, which it broke above earlier in the month.
Technical analysis done by crypto analyst Washigorira focuses on a simple but historically significant feature that involves two consecutive lighter red bars on Bitcoin’s monthly logarithmic MACD histogram. In past cycles, the darker red histogram bars showed expanding bearish momentum, while the lighter red bars showed that the downside pressure was beginning to weaken.
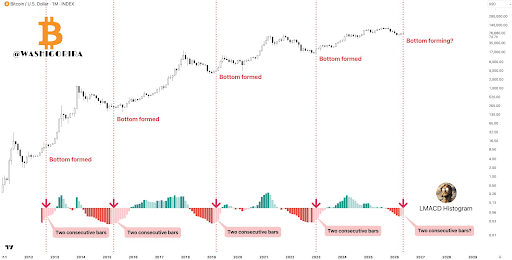
This same pattern appeared around previous Bitcoin bottoming phases. The Bitcoin monthly candlestick chart, shown below, points to similar monthly MACD transitions in 2012, the 2015 bear market bottom, the 2019 cycle reset, and the late 2022 to early 2023 recovery phase. In each case, Bitcoin did not immediately explode higher the moment the first lighter red bar appeared, but the signal showed that sellers were losing control on the monthly timeframe.
The May Close Is The Real Signal
The same configuration now appears to be forming again. Bitcoin’s monthly MACD histogram turned deep red in September 2025, but April 2026 delivered the first lighter red bar since that flip, indicating that bearish momentum had started to ease.
May is in progress and has not yet printed its final reading. If the month closes with a second consecutive lighter bar, the pattern will have repeated again, and Bitcoin’s bottom may already be in. “If history rhymes, the worst of the downside may already be behind us,” WashiGorira noted.
On the other hand, a weak close that creates a deep red histogram again would delay the signal and keep the bear case alive. Bitcoin’s short-term price action is stuck between relief and weakness, and it is currently unclear how May will close. The cryptocurrency has held above the lower panic levels at $74,000 for now, but it has struggled to reclaim the $80,000 zone in May.
Bitcoin is currently struggling with outflows from Spot Bitcoin ETFs and low spot demand on crypto exchanges. None of this necessarily breaks the technical histogram pattern WashiGorira is tracking.
The bearish reading is that the pattern could still leave room for one final crash before a bottom is confirmed. Some technical analysts have warned that the Bitcoin price could still break below $50,000.
 Don't Miss Today's Market Moves Start trading Forex, Gold & Crypto today Regulated platform | Fast withdrawals
Disclaimer: The content presented above, whether from a third party or not, is considered as general advice only. CFD trading involves significant risk of loss. Past performance does not guarantee future results. This article serves informational purposes only and does not constitute financial advice. Consider your risk tolerance before trading.


