


The Graph price prediction 2026-2032: Will GRT recapture its ATH?
Key takeaways:
- The Graph price prediction anticipates a high of $0.0440 by the end of 2026.
- In 2028, it will range between $0.075323 and $0.09214, with an average price of $0.084712.
- In 2032, it will range between $0.173119 and $0.187992, with an average price of $0.182251.
The Graph offers access to competitive and cost-efficient decentralized data sets.
The network boasts a 99.99% uptime and 24/7 availability. Central to The Graph’s operations are subgraphs, APIs that organize and serve blockchain data to data consumers and developers.
The Graph has over 100 indexer nodes, 1.23 trillion served queries, and over 70,000 hosted projects. The GRT token acts as an incentive mechanism for the Graph Network. It incentivizes network participants to provide data to end users and organize it effectively.
So, how high will GRT go? Is it a good investment? What will be its price in 2026? The following sections explore these questions and more.
Overview
| Cryptocurrency | The Graph |
| Ticker | GRT |
| Current price | $0.0278 (+0.65%) |
| Market cap | $300.76M |
| Trading volume (24 Hour) | $37.17M |
| Circulating supply | 11.53B GRT |
| All-time high | $2.88 on Feb 12, 2021 |
| 24-hour high | $0.0292 |
| 24-hour low | $0.02741 |
The Graph price prediction: Technical analysis
| Metric | Value |
| Price Volatility (30-day variation) | 5.46% |
| 50-day SMA | $0.02502 |
| 200-day SMA | $0.03577 |
| Fear and greed index | 43 (Fear) |
| Green days | 14/30 (47%) |
| Sentiment | Bearish |
The Graph price analysis
Key takeaways:
- The Graph price analysis shows a mixed trend as the altcoin is trading at $0.0278.
- Cryptocurrency reports 0.65% gains for the past 24 hours.
- GRT coin faces resistance around $0.0294.
On May 15, 2026, The Graph (GRT) analysis confirms a mixed trend, as the price has retreated to $0.0278, but the token still shows a 0.65% gain over the past 24 hours. This minimal gain is the result of a significant price swing yesterday being entirely erased by today’s correction. Despite the lack of net movement since yesterday, the intraday trend remains unfavorable for bulls as the token continues to trade below its recent peaks.
The Graph 1-day chart analysis
The one-day price chart of The Graph token confirmed a mixed trend. The cryptocurrency’s value has decreased to $0.0278 over the last 24 hours, and it now trades just above the lowest price envelope of the year. The high volatility levels also suggest a higher chance of a reversal or further decrease in the price levels.
The distance between the Bollinger Bands defines the intensity of volatility. This distance is wide, suggesting high volatility in the market. Currently, the upper limit of the Bollinger Bands indicator, acting as the resistance, has moved to $0.0294. Conversely, its lower limit, serving as the support, has moved to $0.0228.
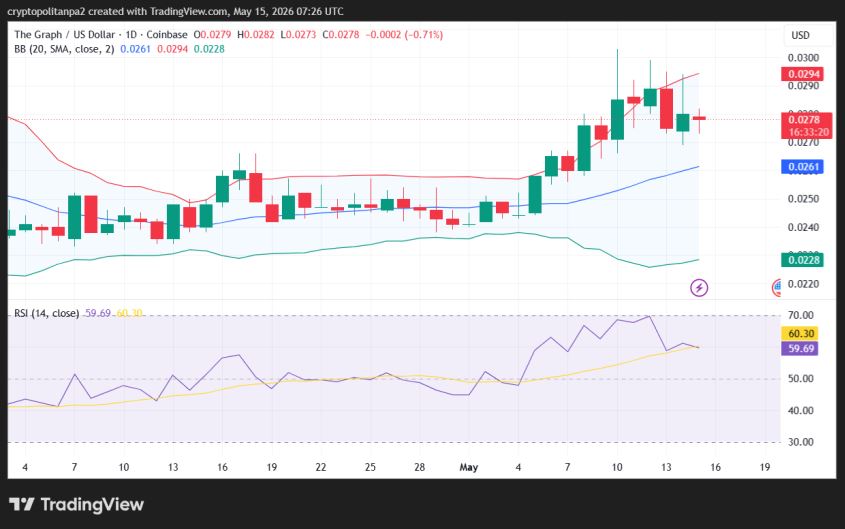
The Relative Strength Index (RSI) indicator confirms persistent selling pressure. The index has decreased to the 59 level today and is trending within the neutral region. If bearish momentum continues to grow, further instability in the market can be expected.
The Graph 4-hour chart analysis
The four-hour price analysis of The Graph coin also indicates some degree of bearish price action, but support is also present just below the current price level at $0.0276. Sellers are now aiming for a push below the immediate support level. Though the selling pressure is returning, it is happening at a mediocre pace.
The Bollinger Bands are maintaining their distance, but the distance between the indicator’s arms is still narrow, resulting in low volatility levels. This decreased volatility signifies higher market predictability in the short term. Moving forward, the upper Bollinger Band has shifted to $0.0296, indicating the resistance point. Conversely, the lower Bollinger Band has moved to $0.0270, securing the support.
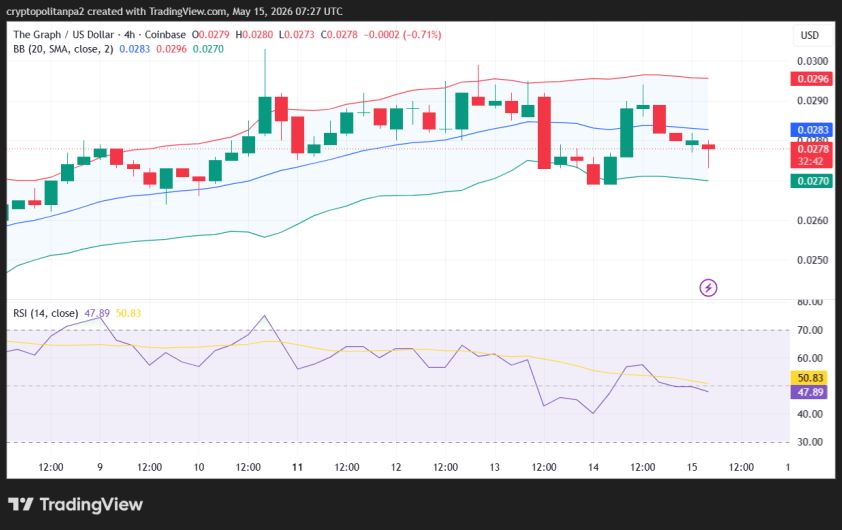
The RSI indicator is moving downwards within the neutral area for now, and it is trending below the centerline of the neutral region. The indicator’s value has reached 47 in the last four hours. The downward curve on the RSI graph represents an imbalanced trading setup in the market. A further downside is possible given the recent bearish progression.
The Graph technical analysis: Levels and action
Daily simple moving average (SMA)
| Period | Value ($) | Action |
| SMA 3 | 0.02815 | SELL |
| SMA 5 | 0.02832 | SELL |
| SMA 10 | 0.02746 | BUY |
| SMA 21 | 0.02596 | BUY |
| SMA 50 | 0.02502 | BUY |
| SMA 100 | 0.02583 | BUY |
| SMA 200 | 0.03577 | SELL |
Daily exponential moving average (EMA)
| Period | Value ($) | Action |
| EMA 3 | 0.02802 | SELL |
| EMA 5 | 0.02793 | SELL |
| EMA 10 | 0.02739 | BUY |
| EMA 21 | 0.02648 | BUY |
| EMA 50 | 0.02599 | BUY |
| EMA 100 | 0.02851 | SELL |
| EMA 200 | 0.03830 | SELL |
What can we expect from GRT price analysis next?
The Graph price analysis gives a mixed prediction regarding the ongoing market events. The coin’s price decreased to $0.0278 in the past 24 hours. A continuation of the current price action might diminish any opportunities for investors. The high volatility on the daily chart shows that there is a higher chance of further price decrease, which, if it occurs, can lead to a retest of the $0.0270 support. At the same time, if buying interest takes over, the token may increase to the $0.0294 level.
Why is GRT down?
The decrease in The Graph’s value could be attributed to the general market sentiment. Moreover, the past four days mostly supported the bears, as the price curve remained downwards despite the bullish episodes, from an overall view, as the price was decreasing, so the coin is moving down today after continuing its downtrend.
Is The Graph a good investment?
The Graph rivals some Web2 data oracles for its efficiency and low costs. GRT, its native token, however, remains a victim of general market dynamics and high volatility. If observed over the larger picture, the current sentiment is bearish, with predictions pointing to higher price growth. It is advised to do your own research and conduct investment advice before investing in the volatile market.
Will GRT reach $0.5?
The Graph token should trade near $0.2 in 2032. In that year, the price will range between $0.173119 and $0.187992, which is quite lower than $0.5.
Will GRT reach $1?
Per the analysts’ The Graph forecast, it remains unlikely that GRT will get to $1 by 2032.
Will GRT reach $10?
Considering GRT’s current price and market cap, it remains highly unlikely that it will reach $10 in the next ten years.
Does GRT have a good long-term future?
According to the market assumptions, GRT is set to trade higher in the years to come. However, factors like market crashes or difficult regulations could invalidate this bullish theory. Hence, it is advised to do your own research and conduct in-depth investment advice before investing in the volatile market.
Recent news/ opinions
- The Graph Protocol announced that its gateway now supports X402 payments. API keys, accounts, and sessions are no longer needed, as any agent or application can query subgraph data by paying per request in USDC.
The Graph price prediction May 2026
A break above resistance is critical to end The Graph’s bear run this month. The price will range between $0.0217 and $0.0355 and average at $0.0260 per current The Graph sentiment.
| Month | Potential low ($) | Potential average ($) | Potential high ($) |
| May | 0.0217 | 0.0260 | 0.0355 |
GRT price prediction 2026
As the third quarter of 2026 unfolds, GRT will likely recover to previous highs. The coin will trade between $0.0172 and $0.0440, with an average price of $0.0322.
| Year | Potential low ($) | Potential average ($) | Potential high ($) |
| 2026 | 0.0172 | 0.0322 | 0.0440 |
GRT price predictions 2027-2032
| Year | Potential low ($) | Potential average ($) | Potential high ($) |
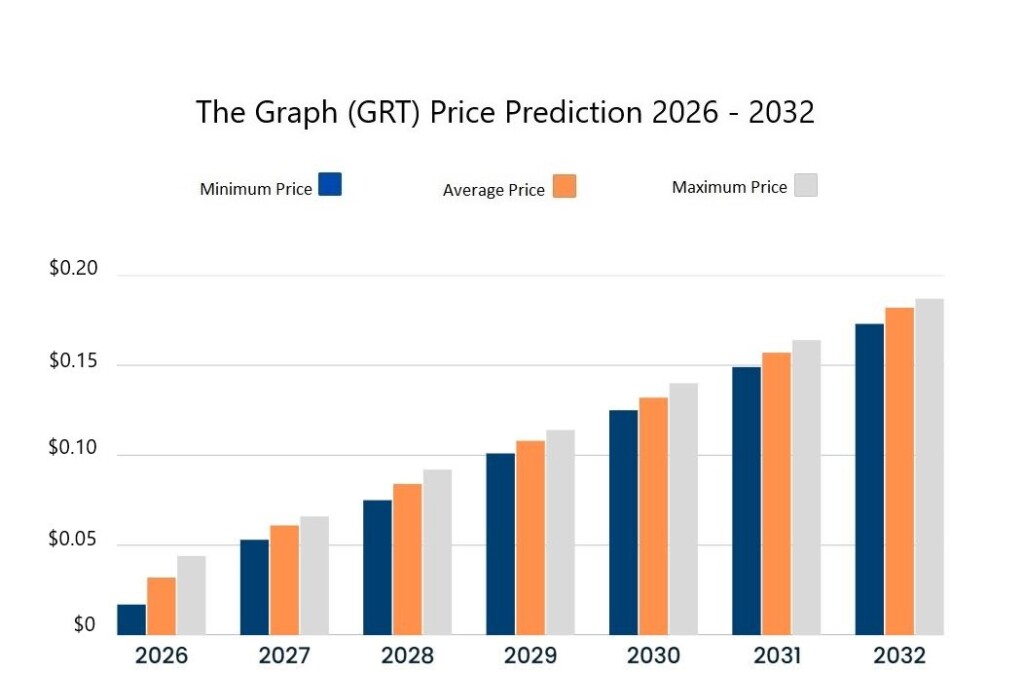
| 2027 | 0.053211 | 0.061413 | 0.06651 |
| 2028 | 0.075323 | 0.084712 | 0.09214 |
| 2029 | 0.101389 | 0.108749 | 0.114819 |
| 2030 | 0.125618 | 0.132916 | 0.140201 |
| 2031 | 0.149832 | 0.157079 | 0.164206 |
| 2032 | 0.173119 | 0.182251 | 0.187992 |
The Graph price prediction 2027
The year 2027 will experience more bullish momentum. As per the Graph GRT price prediction, it will range between $0.053211 and $0.06651, with an average trading price of $0.061413.
The Graph price prediction 2028
The Graph prediction climbs even higher into 2028. According to the prediction, it will range between $0.075323 and $0.09214, with an average price of $0.084712.
The Graph GRT price prediction 2029
The analysis suggests a further acceleration in GRT’s growth by 2029. As per the GRT price prediction, the price of The Graph will range between $0.101389 and $0.114819, with an average of $0.108749.
The Graph price prediction 2030
According to the GRT price prediction for 2030, GRT’s price will reach a maximum and minimum of $0.125618 and $0.140201, respectively, with a year-round average Graph price of $0.132916.
GRT price prediction 2031
In 2031, our prediction suggests a minimum price of $0.149832, a maximum of $0.164206, and an average of $0.157079.
The Graph price prediction 2032
The Graph price forecast for 2032 sets the high at $0.187992. However, in the case of a market correction, the GRT price will rest at a minimum of $0.173119 and an average of $0.182251.
The Graph Market price prediction: Analysts’ GRT price forecast
| Platform | 2026 | 2027 |
| DigitalCoinPrice | $0.00464 | $0.00908 |
| CoinCodex | $0.02816 | $0.02402 |
Cryptopolitan’s GRT price prediction
Our predictions show that GRT will achieve a high of $0.0440 in the second half of 2026. In 2027, it will range between $0.053211 and $0.06651, with an average of $0.061413. In 2032, it will range between $0.173119 and $0.187992, with an average price of $0.182251. Note that the predictions are not investment advice. Seek independent professional consultation or do your research.
The Graph historic price sentiment
- Yaniv Tal, Brandon Ramirez, and Jennus Pohlman launched The Graph on the Ethereum blockchain in 2018.
- In June 2020, The Graph held its private token sale, raising $5 million. Some participants included Multicoin Capital, Digital Currency Group, and DTC Capital.
- The public sale, which took place in October 2020, raised $12 million. Each token sold for $0.03. The mainnet launched in December 2020.
- In January 2021, another sale led by Tiger Global Management raised $50 million.
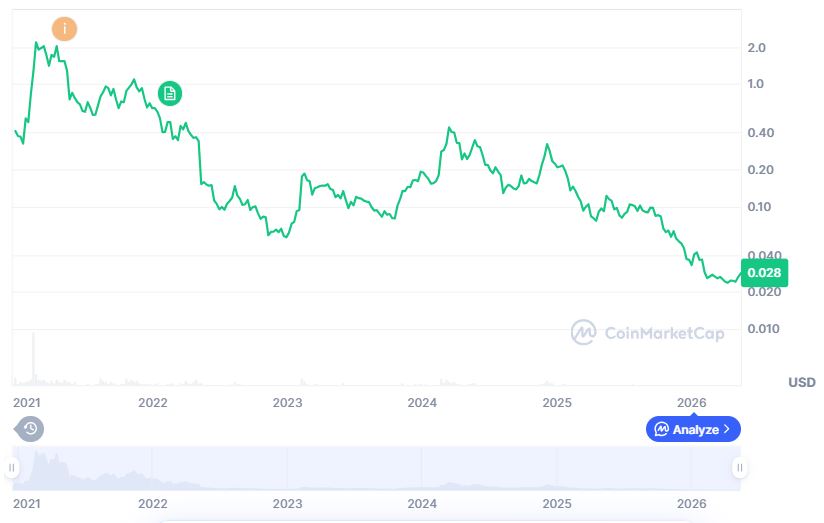
- Looking back, GRT had its best performance in 2021, when it registered its all-time high at $2.88 on February 12, 2021, as per crypto market data.
- In Feb 2022, venture capital firms DCG, Multicoin Capital, NGC Ventures, Gumi Cryptos Capital, and Hashkey announced the launch of a $205 million ecosystem fund, The Graph Protocol.
- In preceding years, GRT consistently traded below $0.7. According to historical data, in 2023, it fell below $0.2.
- In 2024, GRT reached a high of $0.45 in March before falling below $0.20 in July and dipping to $0.1280 in August, with a brief spike to $0.1767. After a gradual decline, it closed at $0.1470 by October.
- Recovery followed, with GRT climbing to $0.281 in November and peaking at $0.337 in December before ending the year at $0.198.
- At the start of January 2025, GRT was trading at $0.23, which decreased to $0.13 in February.
- In March, the price of GRT triggered a decline and touched the ground below $0.09.
- By the end of April, the GRT price recovered toward the crucial $0.1 mark, while in the first half of May, GRT touched $0.127 while surging to $0.132 when the market sentiment was bullish.
- In June, GRT touched the lowest point of $0.0695, and in July 2025, GRT saw a high of $0.1210.
- In October, GRT once again plunged below $1, reaching $0.088, and at the start of November, GRT was trending near $0.057. In December, the token plummeted to the $0.046 range as market sentiment turned negative.
- At the start of January 2026, GRT was maintaining the $0.04 range, and in March, it slipped to $0.0255, as the market sentiment turned bearish.
- In April, GRT was trending near the $0.024 range, and in May, it slightly increased to $0.028.
Recommended Articles


