


Tron Price Prediction 2026–2032: Will Tron reach $1?
Key Takeaways:
- Our Tron price prediction anticipates a high of $0.593794 by the end of 2026.
- In 2028, TRX will range between $1.06 and $1.25, with an average price of $1.15.
- In 2032, TRX will range between $2.38 and $2.57, with an average price of $2.47.
TRX is the native token of the Tron network used to govern and settle transaction fees. In retrospect, Tron (TRX) has performed better than most mega-altcoins. Over the long term, TRX is set to trend higher.
Is TRX a good investment? Will it go up? Where will it be in three years? Let’s get into the TRX price prediction to answer these questions and more.
Overview
| Cryptocurrency | Tron |
| Ticker | TRX |
| Current price | $0.339 (+0.51%) |
| Market cap | $32.17B |
| Trading volume (24-hour) | $800.22M |
| Circulating supply | 94.79B TRX |
| All-time low | $0.001091 on Sep 15, 2017 |
| All-time high | $0.4313 on Dec 04, 2024 |
| 24-hour low | $0.3405 |
| 24-hour high | $0.3372 |
Tron price prediction: Technical analysis
| Metric | Value |
| Price Volatility (30-day variation) | 1.58% |
| 50-day SMA | $0.3190 |
| 200-day SMA | $0.2969 |
| Market Sentiment | Bullish |
| Fear and greed index | 40 (Fear) |
| Green days | 16/30 (53%) |
TRON Price Analysis
TL;DR Breakdown
- Tron price analysis confirmed an upward trend with price recovering to $0.339.
- Cryptocurrency gains 0.51% of its value.
- TRX faces resistance around $0.343.
On May 4, 2026, Tron price analysis reveals a bullish trend for the altcoin. The altcoin’s price has recovered to $0.339 today, and it has gained 0.51% in value in the last 24 hours. The buyers’ support appeared when the altcoin touched $0.322 on April 28 amid negative market sentiment. However, the bulls are now back on track again.
TRX/USD 1-day chart analysis
The one-day chart shows that TRON’s price prediction is bullish, as a further recovery has been observed in the market. The coin’s price increased to $0.339 today following yesterday’s high spike. The coin is trending in its upper price envelope of the year, but it also faces resistance at $0.343, which is hindering the upward price movement.
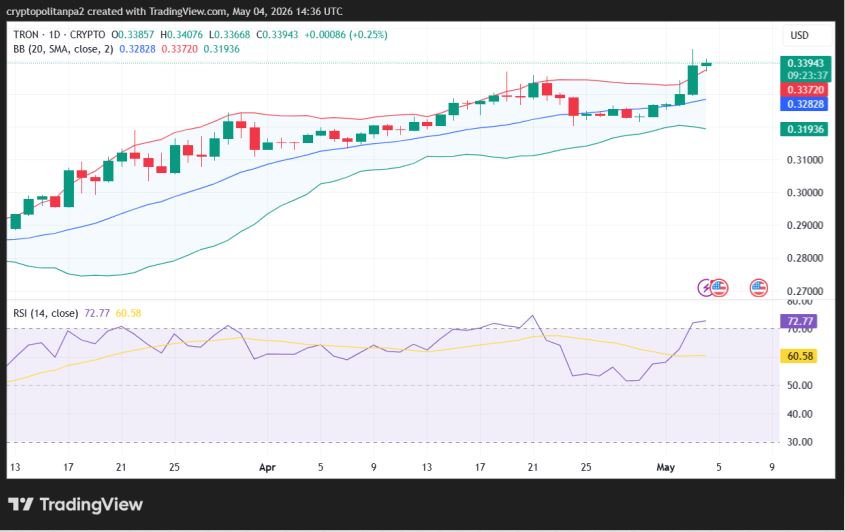
The volatility level is low but the Bollinger Bands are diverging. The indicator’s upper limit is currently at $0.337, indicating a breached resistance; meanwhile, the lower limit has adjusted to $0.319, acting as the strongest support.
A number of technical indicators show bullish signs, and the Relative Strength Index (RSI) indicator is currently hovering in the overbought region as it moves upward. The indicator’s value has increased to index 72 in the past 24 hours. The upward curve on the RSI graph reflects a balanced market setup. However, if the bulls persist, we can expect a further upturn in the coin’s value.
TRX/USD 4-hour chart analysis
The four-hour price analysis of Tron indicates a decreasing trend for the cryptocurrency. The TRX/USD price has slightly decreased to $0.339 in the past few hours. Immediate support is also present just below the current price level at $0.338, as the token is floating above that level. Simultaneously, the high volatility suggests a higher chance of a price reversal or further price appreciation.
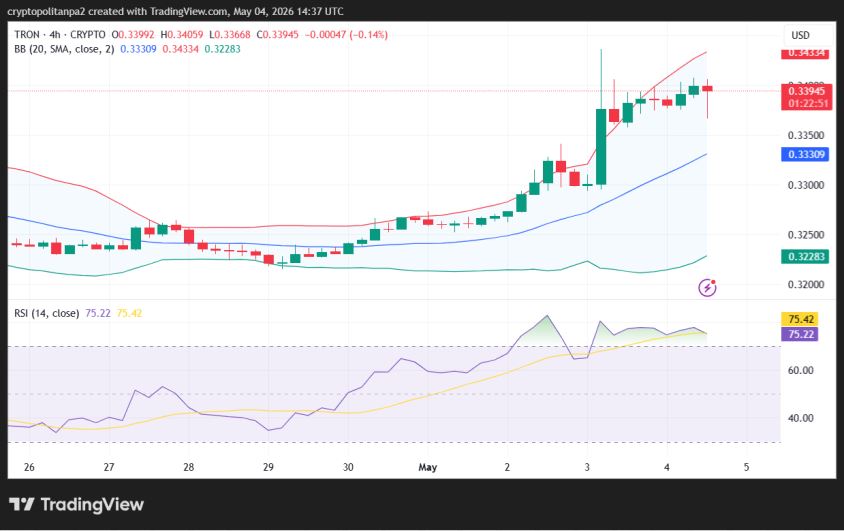
The Bollinger Bands are expanding and the distance is wide, hinting at high volatility on the price chart. This level of volatility signals increased market movements. Moving ahead, the upper Bollinger Band has shifted to $0.343, indicating the resistance point. Conversely, the lower Bollinger Band has moved to $0.322, securing the support.
Multiple technical quantitative indicators are bullish, and the RSI indicator is also in the overbought region. The indicator’s score has increased to 75 in the past four hours. The upward curve on the indicator’s graph signifies bullish presence; if the bulls succeed in continuing their lead, a further uptick in the coin’s value can be expected.
TRX technical indicators: Levels and actions
Daily simple moving average (SMA)
| Period | Value ($) | Action |
| SMA 3 | 0.3319 | BUY |
| SMA 5 | 0.3291 | BUY |
| SMA 10 | 0.3265 | BUY |
| SMA 21 | 0.3272 | BUY |
| SMA 50 | 0.3190 | BUY |
| SMA 100 | 0.3022 | BUY |
| SMA 200 | 0.2969 | BUY |
Daily exponential moving average (EMA)
| Period | Value ($) | Action |
| EMA 3 | 0.3334 | BUY |
| EMA 5 | 0.3310 | BUY |
| EMA 10 | 0.3286 | BUY |
| EMA 21 | 0.3260 | BUY |
| EMA 50 | 0.3182 | BUY |
| EMA 100 | 0.3096 | BUY |
| EMA 200 | 0.3019 | BUY |
What can we expect from Tron price analysis next?
Tron price analysis gives a bullish prediction regarding the ongoing market events. The coin value has further increased to $0.339 today. At the same time, the cryptocurrency gained up to 0.51 percent of its value during the past 24 hours. Technical indicators give bullish signals, and the price charts also showcase support for the buyers, as the price may increase above $0.343 again.
Is TRX a good investment?
TRX is a coin with utility that continues to trade higher, indicating growing adoption among crypto investors. Despite this, the coin remains a victim of uncertainties and volatility. It is advised to do your own research, design an investment strategy according to your risk tolerance, and consult expert opinions before investing in the volatile market.
Why is Tron up?
Tron is showing bullish signs. The coin has slightly recovered to $0.339 amidst a rising bullish trend. After gaining significant support, buyers gain confidence, and the trend seems to be resuming in an upward direction again.
Will Tron reach $0.5?
TRON (TRX) is projected to surpass the $0.50 level in 2026, with its predicted price expected to fluctuate within a range of $0.210 to $0.593794 throughout the year.
Will Tron reach $1?
Yes, Tron should rise above $1 in 2028. During that period, its forecasted price will range between $1.06 and $1.25, which is quite higher than the current Tron price.
Can TRX reach $10?
Per expert analysis, Tron may not reach $10 before 2032, considering its future performance.
What will be the price of 1 TRX in 2026?
The average Tron price for 2026 is expected to be $0.494829.
What will be the price of TRON in 2030?
The highest price of Tron in 2030 is expected to be around $1.91.
What will TRX be worth in 5 years?
The minimum expected price of Tron after 5 years will be $2.38.
Does Tron have a good long-term future?
According to the Tron price predictions, Tron is set to trade higher in the coming years as the Tron blockchain evolves. However, factors like market crashes, regulatory developments, or difficult regulations could invalidate this bullish theory.
Recent news/opinions on Tron
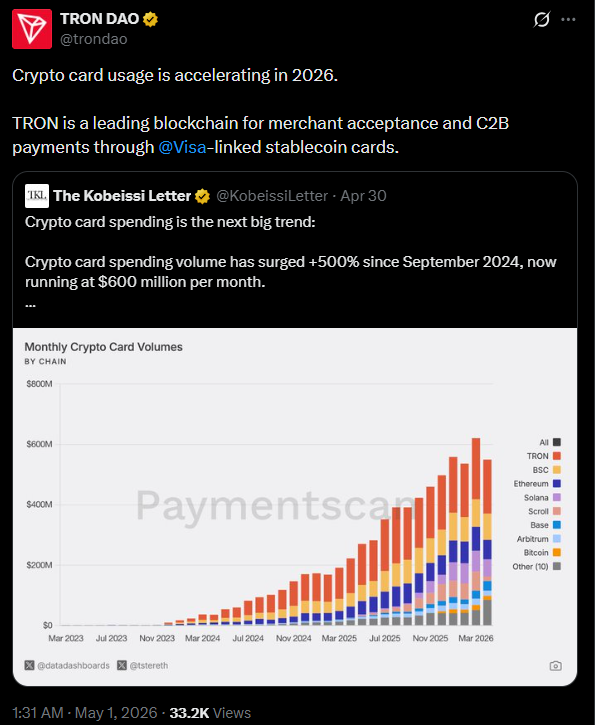
- Tron shared a post from the Kobeissi Letter, a capital markets analysis firm, examining recent data on the acceleration of crypto card usage. The post identified Tron as a leading blockchain for merchant acceptance and C2B payments through Visa-linked stablecoin cards.
Tron price prediction May 2026
A break of resistance will result in a mini bull run, with the next target at $0.351. This May month, TRX will trade at an average of $0.311 and drop to $0.281 at its lowest.
| Month | Potential low ($) | Potential average ($) | Potential high ($) |
| May | 0.281 | 0.311 | 0.351 |
Tron price prediction 2026
The technical indicators are bullish on TRX in the second half of 2026. It is anticipated to trade between $0.210 and $0.593794, with an average price of $0.494829.
| Year | Potential low ($) | Potential average ($) | Potential high ($) |
| 2026 | 0.210 | 0.494829 | 0.593794 |
Tron price predictions 2027-2032
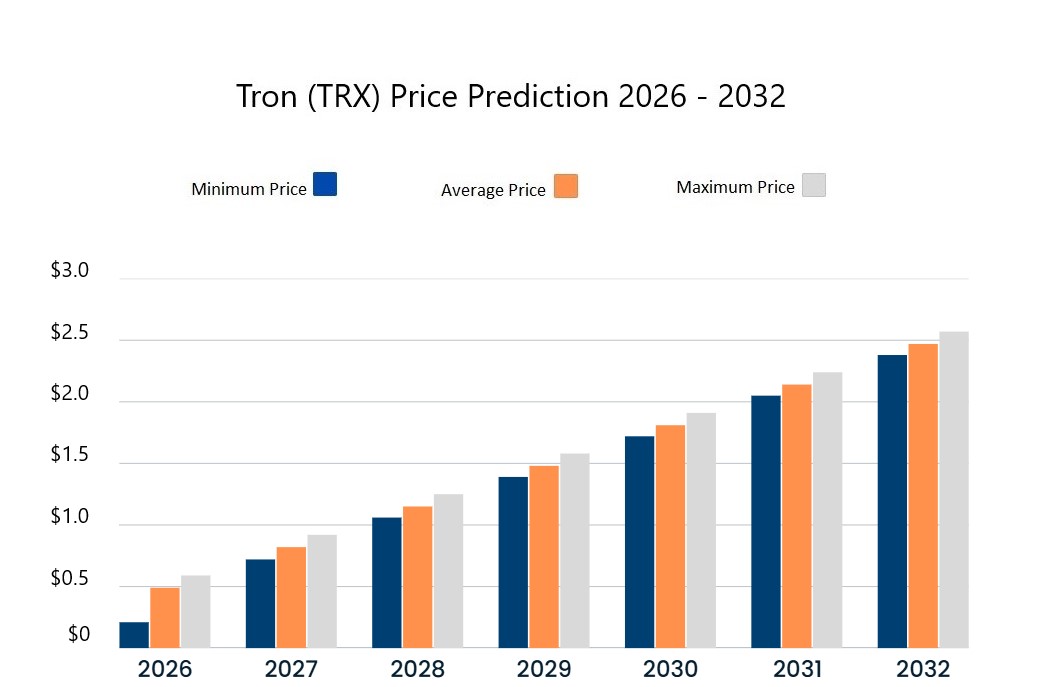
| Year | Potential low ($) | Potential average ($) | Potential high ($) |
| 2027 | $0.725748 | $0.824714 | $0.92368 |
| 2028 | $1.06 | $1.15 | $1.25 |
| 2029 | $1.39 | $1.48 | $1.58 |
| 2030 | $1.72 | $1.81 | $1.91 |
| 2031 | $2.05 | $2.14 | $2.24 |
| 2032 | $2.38 | $2.47 | $2.57 |
Tron price prediction 2027
TRON will experience more bullish momentum in 2027. According to the Tron price prediction, it will range between $0.725748 and $0.92368, with an average price of $0.824714.
Tron price prediction 2028
The TRX prediction climbs even higher in 2028; according to the prediction, it will range between $1.06 and $1.25, with an average closing price of $1.15.
Tron price prediction 2029
The analysis suggests a further acceleration in TRX’s growth by 2029. According to the Tron price prediction, the price of Tron will range between a minimum price of $1.39 and a maximum price of $1.58. The average price for the year will be $1.48.
Tron price prediction 2030
According to the Tron forecast for 2030, TRX price will reach a maximum and minimum of $1.91 and $1.72, respectively, with a year-round average of $1.81.
Tron price prediction 2031
The Tron TRX price prediction for 2031 indicates a price range of $2.05 and $2.24 and an average future value of $2.14, considering the future price movements.
Tron price prediction 2032
The Tron price forecast for 2032 sets the high at $2.57. The lowest price for the year will be $2.38, and the average price will be $2.47.
Tron market price prediction: Analysts’ TRX price forecast
| Platform | 2026 | 2027 |
| Digitalcoinprice | $0.21 | $0.12 |
| CoinCodex | $0.4340 | $0.5419 |
Cryptopolitan’s Tron price prediction
At current levels, Tron remains bullish. According to our predictions, TRX will achieve a high of $0.593794 in the second half of 2026. In 2027, it will range between $0.725748 and $0.92368, with an average of $0.824714. Note that the predictions are not investment advice. Seek independent professional consultation or do your research.
Tron historic price sentiment
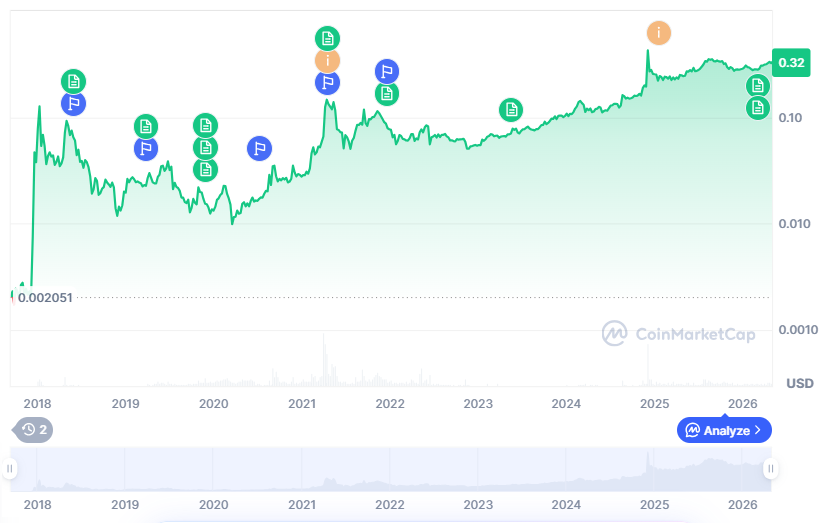
- Tron, founded by Justin Sun in 2017, raised $70 million through an ICO the same year; it launched its mainnet in May 2018 and migrated TRX from Ethereum to Tron in June, which temporarily boosted TRX’s price to $0.09.
- TRX reached an all-time high of $0.3004 in January 2018 before dropping below $0.05 a month later; it consistently traded under $0.05 until late 2020, when it began to rise again.
- In 2021, it reached a high of $0.16. Tron was also reorganized as a DAO as Justin stepped down as CEO of Tron Foundation.
- TRX was in a bear trend for the best part of 2022, as per crypto market data.
- In 2023, TRX maintained a consistent bull run, rising from a low of $0.05, increasing its market capitalization significantly.
- In March 2023, the SEC sued Justin for allegedly selling unregistered securities and promoting Tron and Bittorent tokens.
- In February 2024, Circle’s announcement to cease USDC on Tron led TRX to correct from $0.1429. TRX held above $0.1234 until mid-May, then dropped to $0.1113.
- The price rebounded to $0.1398 in July but fell again to $0.1213 in early August, as supply and demand dynamics kept changing.
- By late September, TRX recovered to $0.166, reaching $0.1691 in October and touching $0.2130 in late November, as the price action remained in the upward direction. TRX ended 2024 with a price tag of $0.255.
- Tron was priced at $0.255 at the start of January 2025, and it was trading in a range of $0.204 to $0.257 in February, as the market trends kept flipping with decreasing market volatility.
- In March 2025, Tron (TRX) dipped to $0.212, but it recovered to the $0.23 range in April and $0.278 in May, while it observed its yearly high price of $0.370 on August 14. In October, Tron started its descent and fell below $0.30 by the end of the month.
- In December, Tron was trending below the $0.30 range, maintaining its price above $0.23.
- At the start of 2026, TRX was trading near $0.28, and in March, the token is trending near the same price range.
-
In April, Tron jumped to $0.31, and in May it increased to the $0.32 level, as the current Tron sentiment is bullish despite the fact that the broader crypto market sentiment is still bearish.
Recommended Articles


