




Zcash Price Forecast: ZEC gains momentum as bulls eye 12% upside move
- Zcash gains nearly 4% on Friday, defying the broadly sideways trend in the broader crypto market.
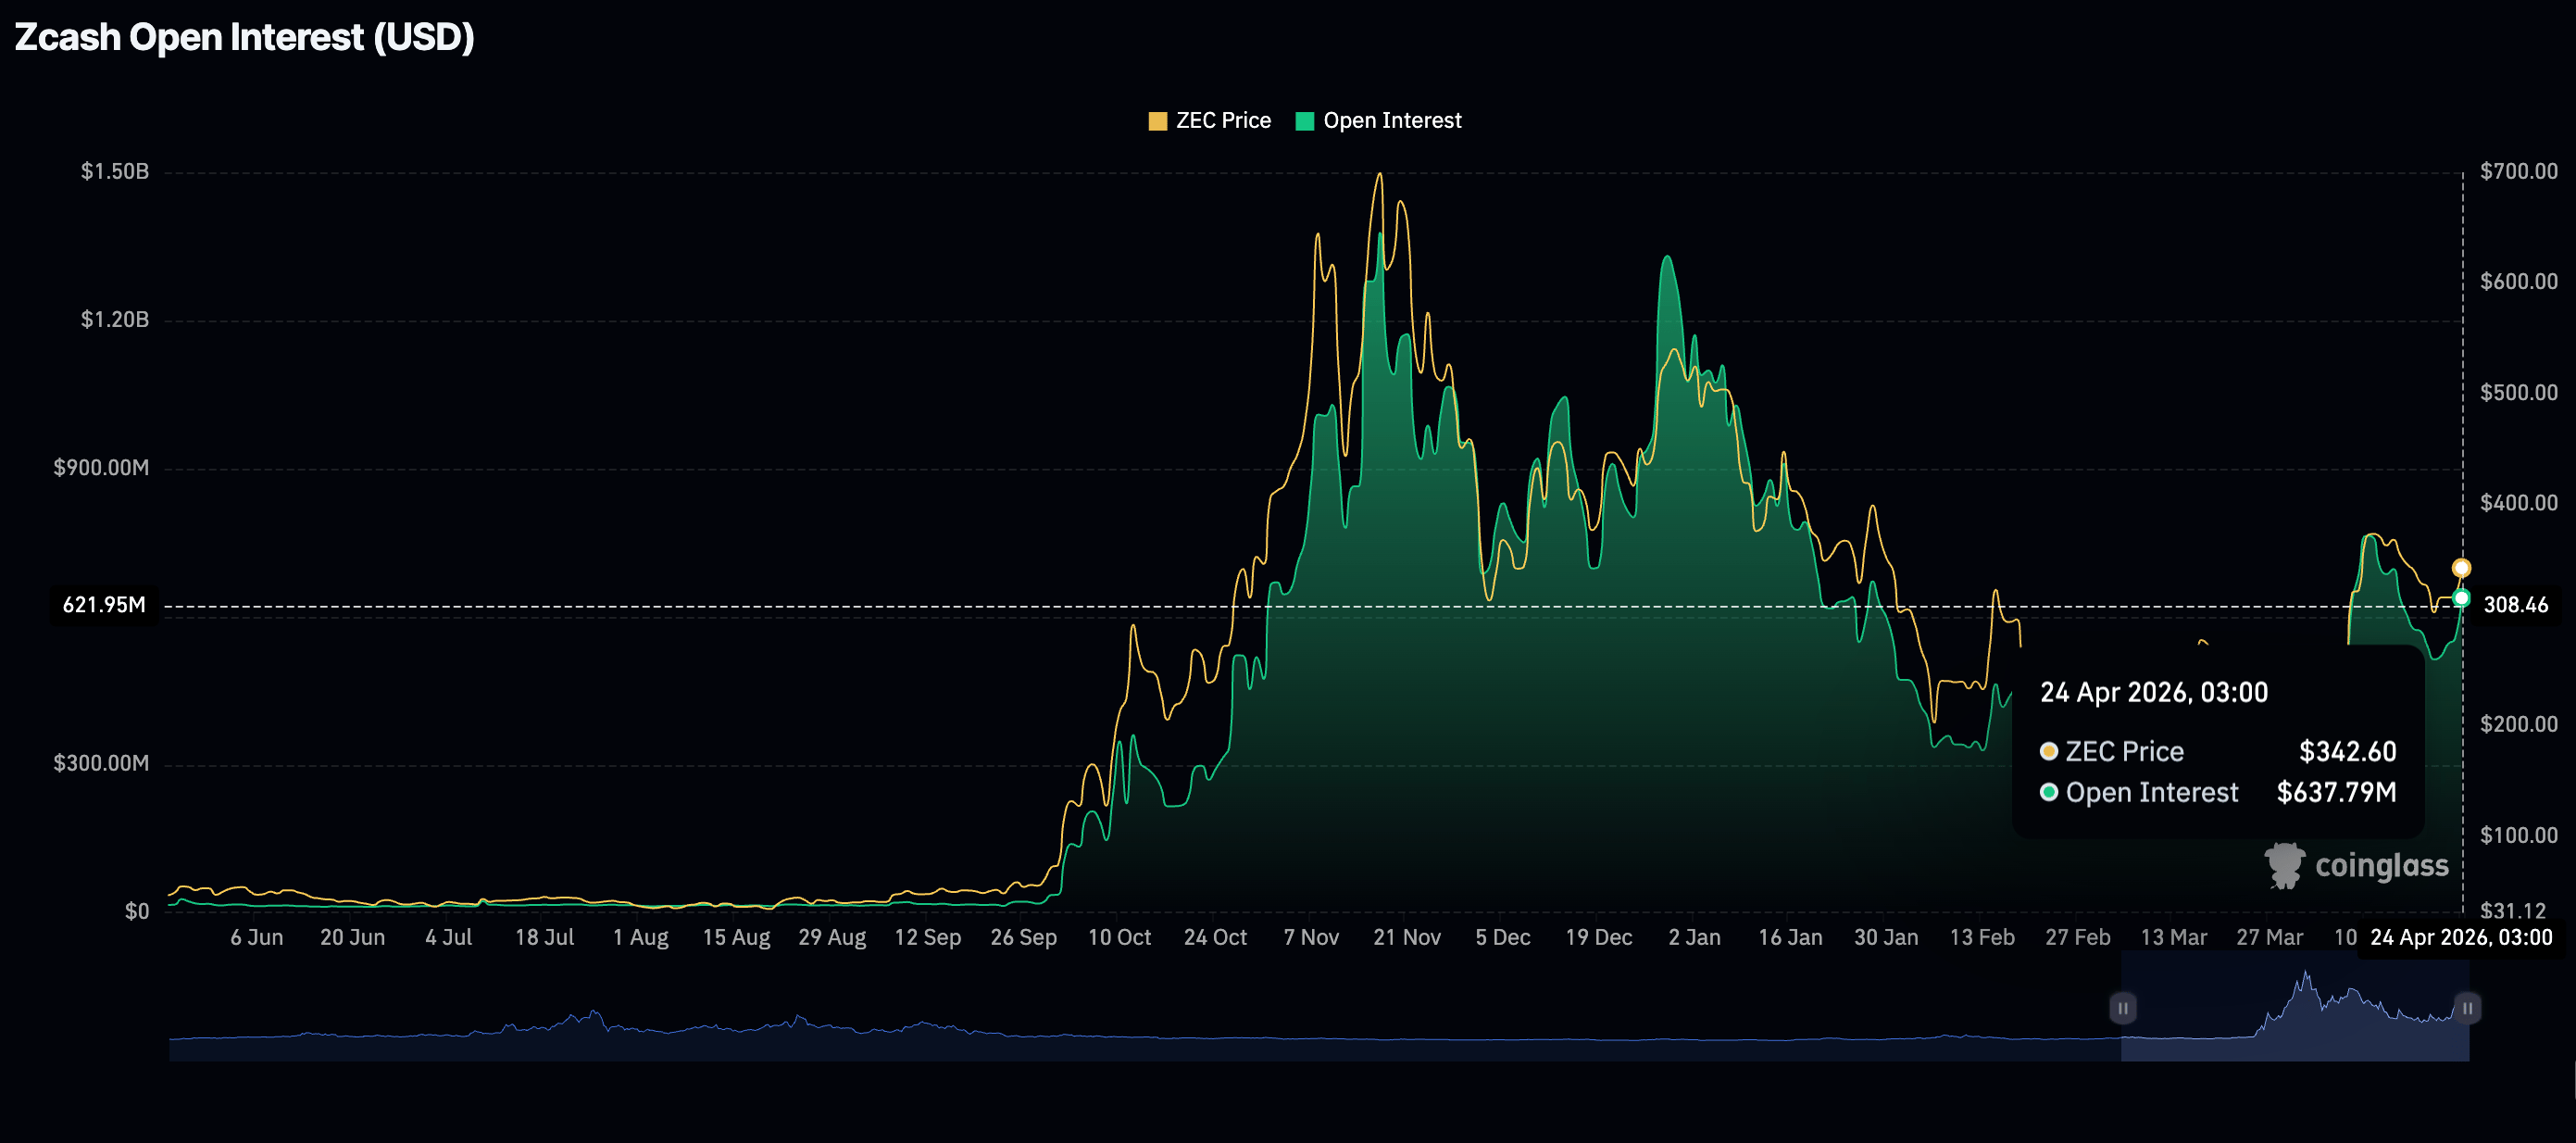
- ZEC’s futures Open Interest climbs back to $638 million, suggesting that retail demand is returning.
- Recent gains could embolden bulls to target $400, a 12% increase from current prices.
Zcash (ZEC) is grinding up above $355 at the time of writing on Friday, shrugging off emerging headwinds in the broader crypto market. The privacy-oriented token tested support at $300 on Sunday, allowing bulls to increase their risk exposure and build momentum for the current gains.
ZEC’s 18% weekly gains could increase bullish conviction and raise the odds of a 12% surge to the next key resistance objective at $400. On the downside, robust support aligns with a key technical indicator at $331. As long as Zcash can hold about that level, dips could be absorbed by fresh demand.
Zcash derivatives strengthen recovery outlook
Retail investors are returning to the Zcash derivatives market, raising the perpetual futures Open Interest (OI), which reached $638 million on Friday, up from nearly $555 million the previous day.
Following ZEC’s rejection of its April high at $394, the OI faded to $513 million. Meanwhile, the increase in OI alongside the price underscores bullish conviction in the token’s recovery as traders lean into risk.
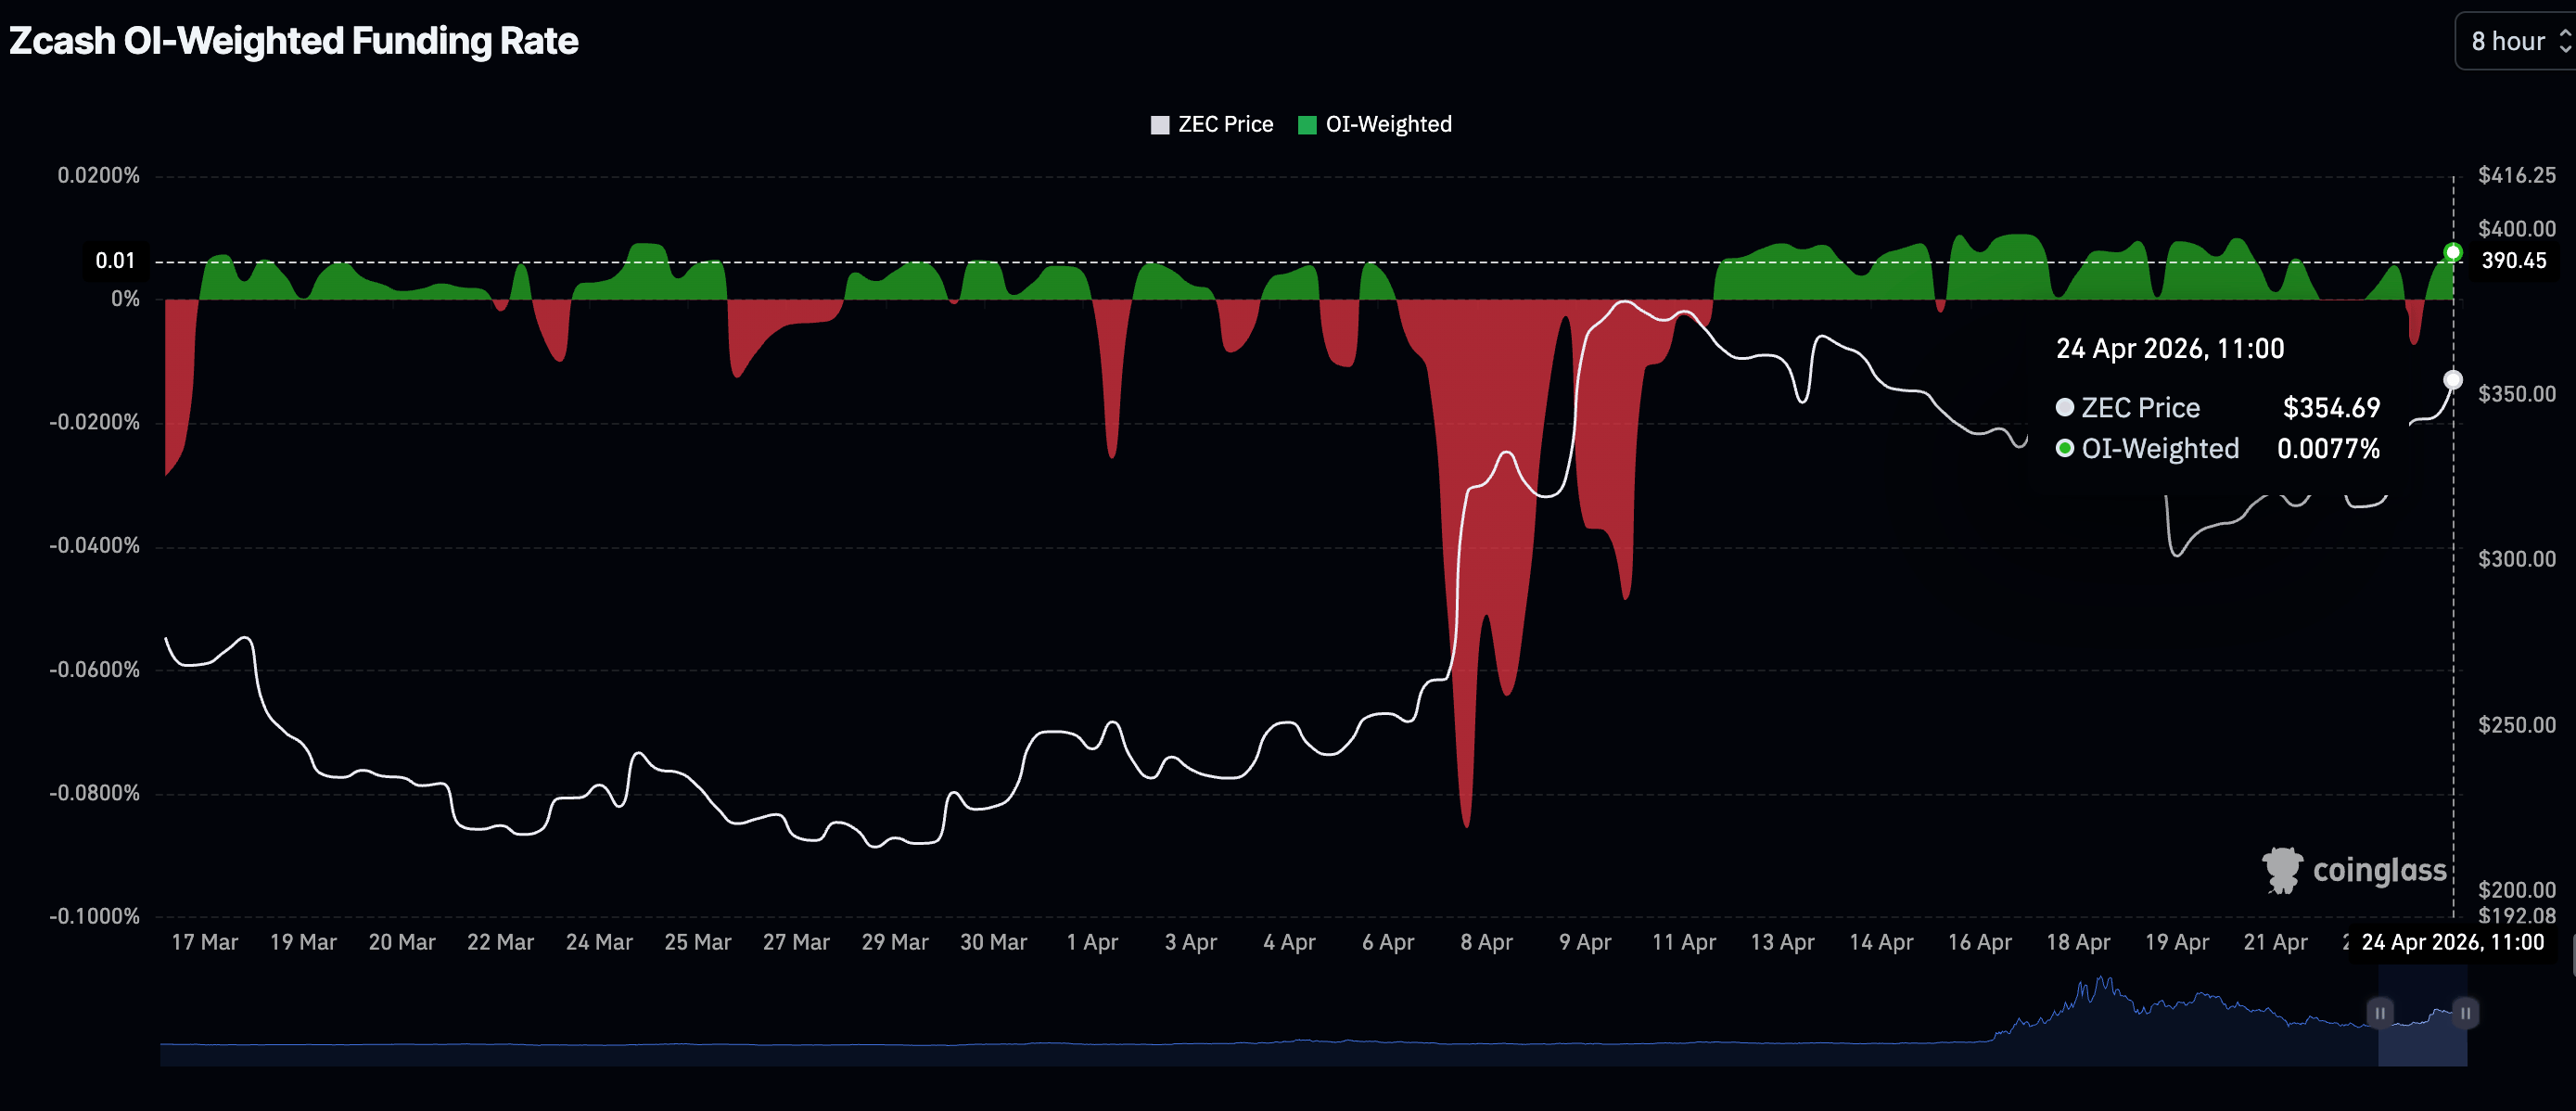
Meanwhile, investors are increasingly willing to pay a premium to hold onto their long positions, as evidenced by the OI-Weighted Funding Rate climbing to 0.0077% in the positive territory. CoinGlass data shows that this ZEC’s OI funding rate has largely remained in positive territory since April 11, emphasizing growth in risk appetite.
Technical outlook: Zcash breakout beckons
Zcash trades at $355, maintaining a constructive bullish bias as price remains well above the 50-, 100-, and 200-day Exponential Moving Averages (EMAs), clustered between roughly $284 and $296, and above the Bollinger middle band at about $331, which now acts as dynamic support.
Momentum appears mixed, with the Relative Strength Index (RSI) sitting around 64 on the daily chart, sustaining a positive tilt without yet being overbought. At the same time, the Moving Average Convergence Divergence (MACD) histogram remains in negative territory on the same chart, suggesting the recent rebound is advancing against a still-fragile underlying momentum backdrop.
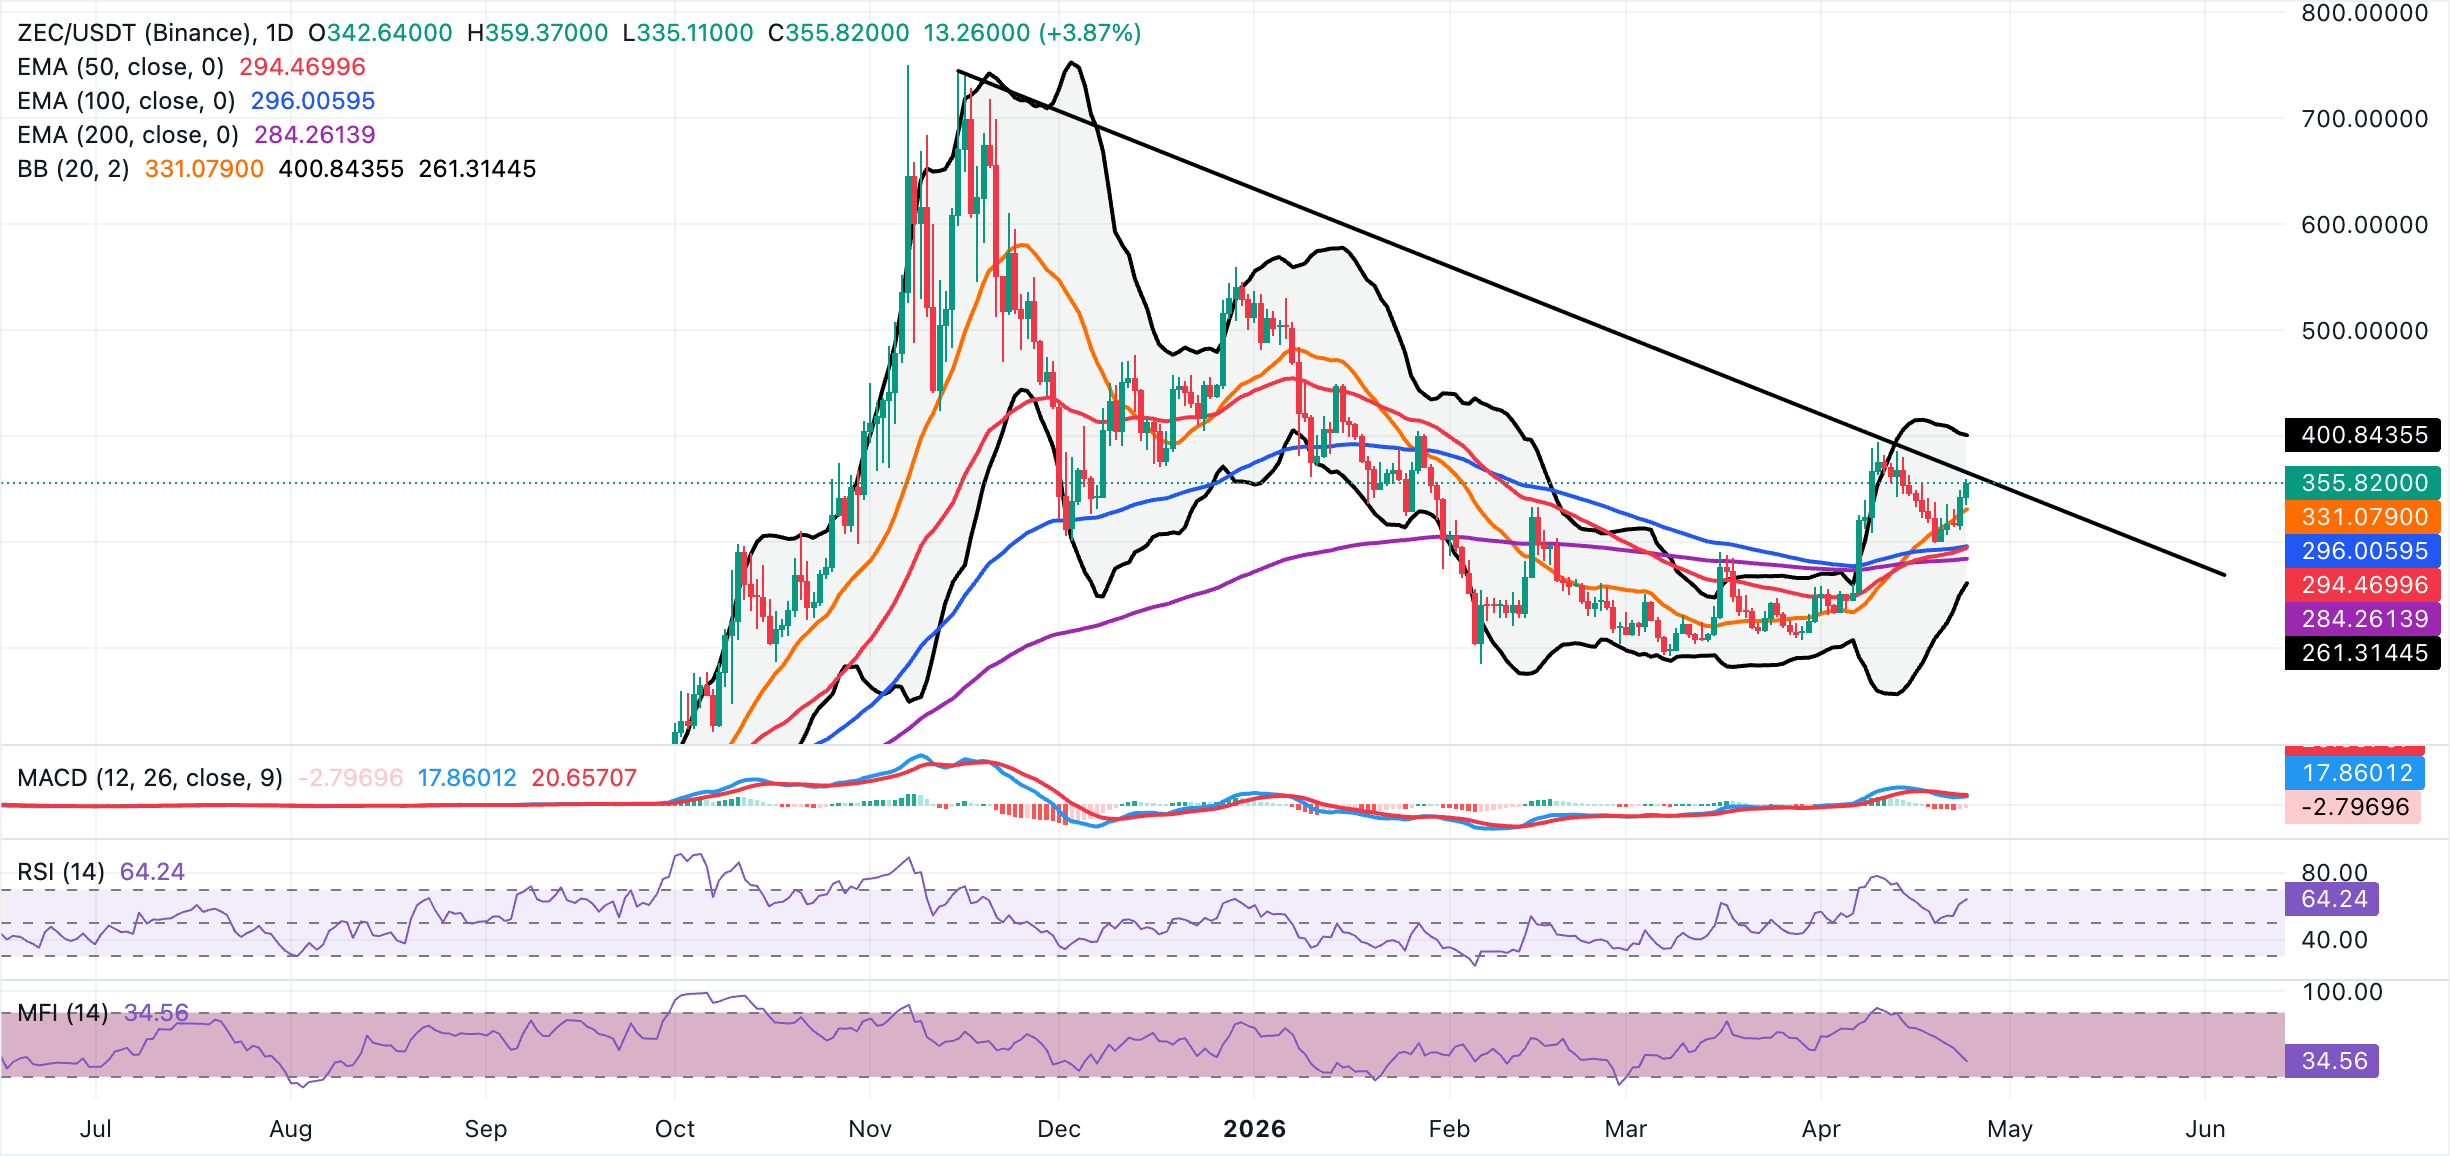
On the topside, immediate resistance is seen near the descending trendline around $365, with the Bollinger upper band at $401 acting as the next hurdle if bulls extend the move. On the downside, initial support is provided by the Bollinger middle band at roughly $331. A deeper corrective phase is likely to lean on the moving-average cluster formed by the 100-day EMA at $296.00, the 50-day EMA at $294, and the 200-day EMA at $284.
(The technical analysis of this story was written with the help of an AI tool.)
Open Interest, funding rate FAQs
Higher Open Interest is associated with higher liquidity and new capital inflow to the market. This is considered the equivalent of increase in efficiency and the ongoing trend continues. When Open Interest decreases, it is considered a sign of liquidation in the market, investors are leaving and the overall demand for an asset is on a decline, fueling a bearish sentiment among investors.
Funding fees bridge the difference between spot prices and prices of futures contracts of an asset by increasing liquidation risks faced by traders. A consistently high and positive funding rate implies there is a bullish sentiment among market participants and there is an expectation of a price hike. A consistently negative funding rate for an asset implies a bearish sentiment, indicating that traders expect the cryptocurrency’s price to fall and a bearish trend reversal is likely to occur.
Recommended Articles


