




Gold Plunged Nearly 5% Last Week to Near One-Year Low: Can Cooling US October PPI Spark a Rebound?
TradingKey - As of the Asian session on Monday (Nov. 16), gold prices (XAUUSD) remained range-bound with a weak bias today following last week's sharp decline, trading near $3,865, down about 0.4% intraday. Previously, gold closed near $3,880 last Friday, falling 4.68% for the week to log its largest weekly drop since early June. Although the latest U.S. PPI data came in below expectations, easing market concerns over aggressive Fed rate hikes, the U.S. dollar and Treasury yields remained elevated, limiting gold's rebound.
US PPI Below Expectations, but Fed Rate-Hike Pressure Has Not Significantly Eased
Data released by the U.S. Bureau of Labor Statistics last Friday showed that the U.S. PPI rose 0.3% month-over-month in October, below market expectations of 0.4% and slowing markedly from an upwardly revised 1.4% in September; year-over-year, it climbed 6.5%, hitting its highest level since November 2022. Core PPI, which excludes food and energy prices, rose 0.3% month-over-month, while the price index further excluding trade services gained 0.5% month-over-month, indicating that some underlying price pressures remain firm. Following the data release, gold briefly rebounded to near $3,923 before giving up its gains, suggesting that the lower-than-expected headline PPI was not enough to reverse the market's assessment of a high-interest-rate environment in the U.S.
Following the PPI release, the market-implied probability of the Federal Reserve hiking rates by 50 basis points in December fell from 11.5% previously to 8%, while the probability of a 25-basis-point hike rose to 92%. Although expectations of a sharp rate hike have cooled somewhat, the previously released October CPI came in higher than expected, and coupled with ongoing resilience in the U.S. labor market, the likelihood of further monetary policy tightening by the Fed remains elevated. Last week, the U.S. two-year Treasury yield rose by approximately 35 basis points cumulatively, while the U.S. dollar also remained strong. Higher bond yields raise the opportunity cost of holding non-yielding gold, serving as a major driver of the recent sustained decline in gold prices.
Gold Price Technical Analysis
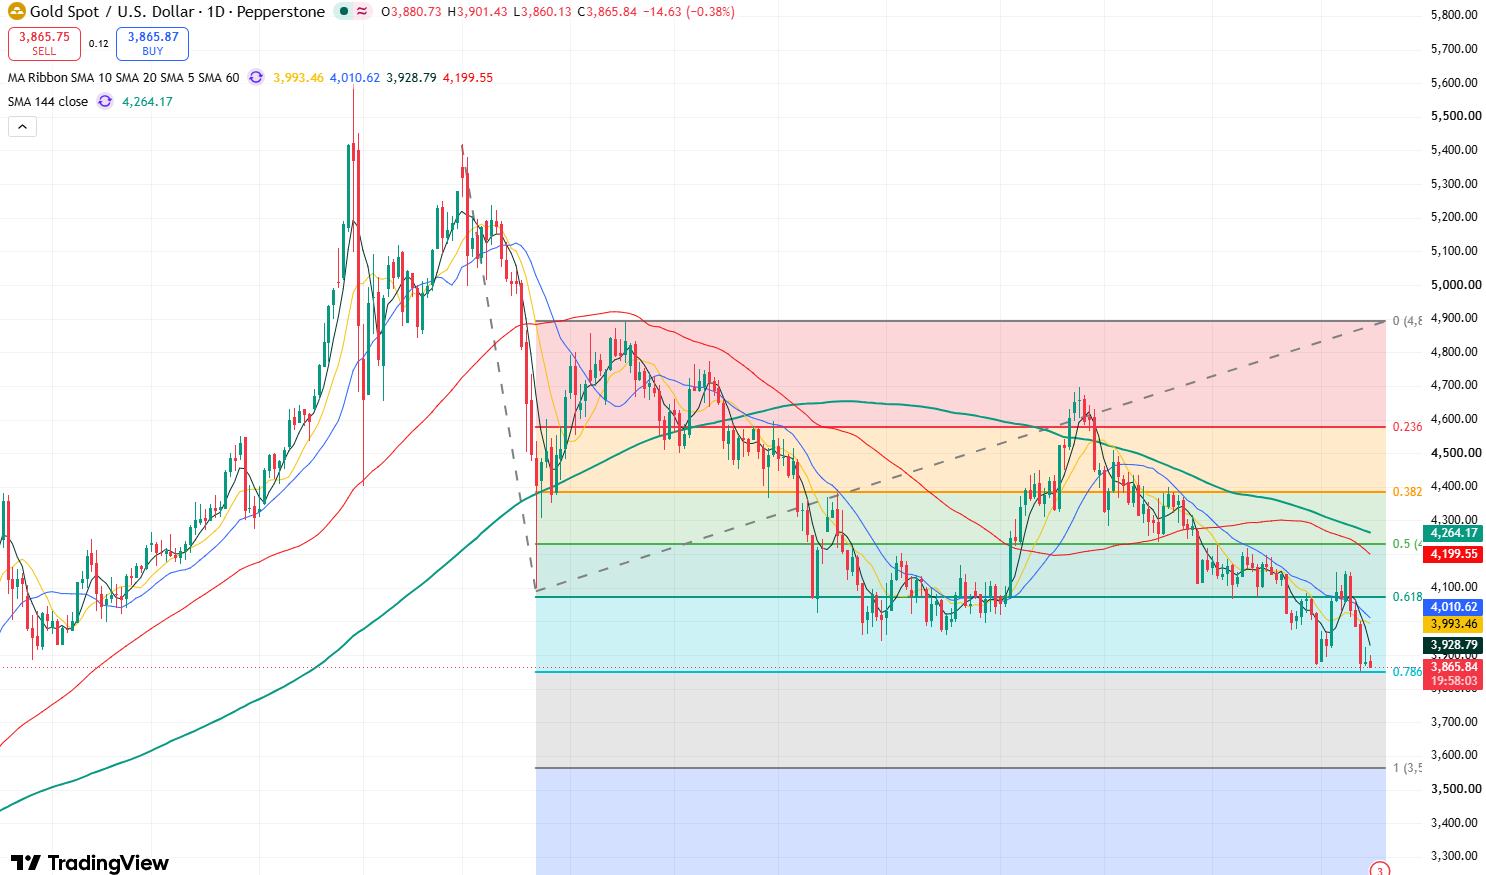
Gold price daily chart, Source: TradingView
Looking at gold's daily chart, prices plunged nearly $300 over three consecutive trading sessions last week and broke below the October 30 low of $3,870.10, hitting a new low in nearly a year at $3,877.41. This further weakened gold's overall candlestick structure and opened up additional downside room.
At present, gold has fallen to above the 0.786 Fibonacci retracement level of $3,850, where it closed higher on Friday to halt its decline, indicating a certain degree of support. In the short term, a technical corrective rebound may emerge, with the primary target to watch near $3,920. If it breaks through this level, gold will rebound further to test $3,950, followed by the $4,000 mark. Only when gold reclaims this level can bullish market sentiment be expected to recover, allowing prices to challenge the key resistance level of $4,150 once again.
Conversely, if gold falls below $3,850, it could see a deeper pullback toward the 1.0 Fibonacci retracement level near $3,565.
Recommended Articles


