


Gold holds firm but lacks momentum as US-Iran tensions and Fed outlook weigh
- Gold recovers from intraday lows but remains capped as escalating US-Iran tensions keep gains in check.
- US-Iran talks end without a deal, US orders a blockade targeting Iranian ports.
- Technically, XAU/USD shows a neutral bias with a slight downside tilt below the 50-day SMA.
Gold (XAU/USD) regains ground on Monday after a gap-down open, though it lacks strong upside momentum amid escalating tensions between the United States and Iran. At the time of writing, XAU/USD is trading around $4,732, rebounding from an intraday low near $4,632.
Risk-off sentiment dominates the market mood as last week’s optimism following the announcement of a two-week ceasefire fades after US-Iran talks over the weekend in Islamabad ended without a breakthrough.
In response, US President Donald Trump ordered a naval blockade of the Strait of Hormuz. The US Central Command (CENTCOM) said the blockade will apply to all vessels entering or leaving Iranian ports across the Arabian Gulf and Gulf of Oman, with operations beginning Monday at 10:00 ET (14:00 GMT).
Meanwhile, Iran’s Islamic Revolutionary Guard Corps (IRGC) warned that any military vessels approaching the Strait of Hormuz would be seen as a ceasefire breach and could face a strong response.
Markets remain wary of further escalation and prolonged disruptions to global energy supplies, with Crude prices climbing back after last week’s correction. West Texas Intermediate (WTI) is trading around $97, up roughly 7.5% at the time of writing.
Elevated Oil prices are fueling inflation concerns and strengthening expectations that the Federal Reserve (Fed) will keep interest rates higher for longer, or even raise them further if the conflict persists, keeping the US Dollar (USD) and Treasury yields broadly supported. Recent US inflation data for March reflected rising energy costs, with headline CPI increasing by 0.9% MoM from 0.3% in February, while the annual rate rose to 3.3% YoY from 2.4%.
Despite being seen as an inflation hedge and a safe-haven asset, Gold has struggled to attract meaningful buying interest since the war began, as the higher interest rate outlook increases the opportunity cost of holding the non-yielding metal.
However, the broader outlook remains supported by steady central bank buying, fading confidence in fiat currencies, rising sovereign debt levels in major economies, and resilient investment demand.
Looking ahead, the US economic calendar is relatively light, with the main focus on the Producer Price Index (PPI) for March due on Tuesday. In addition, several Fed officials are scheduled to speak throughout the week, which could provide further guidance on the interest rate outlook.
Technical analysis: XAU/USD consolidates between key SMAs
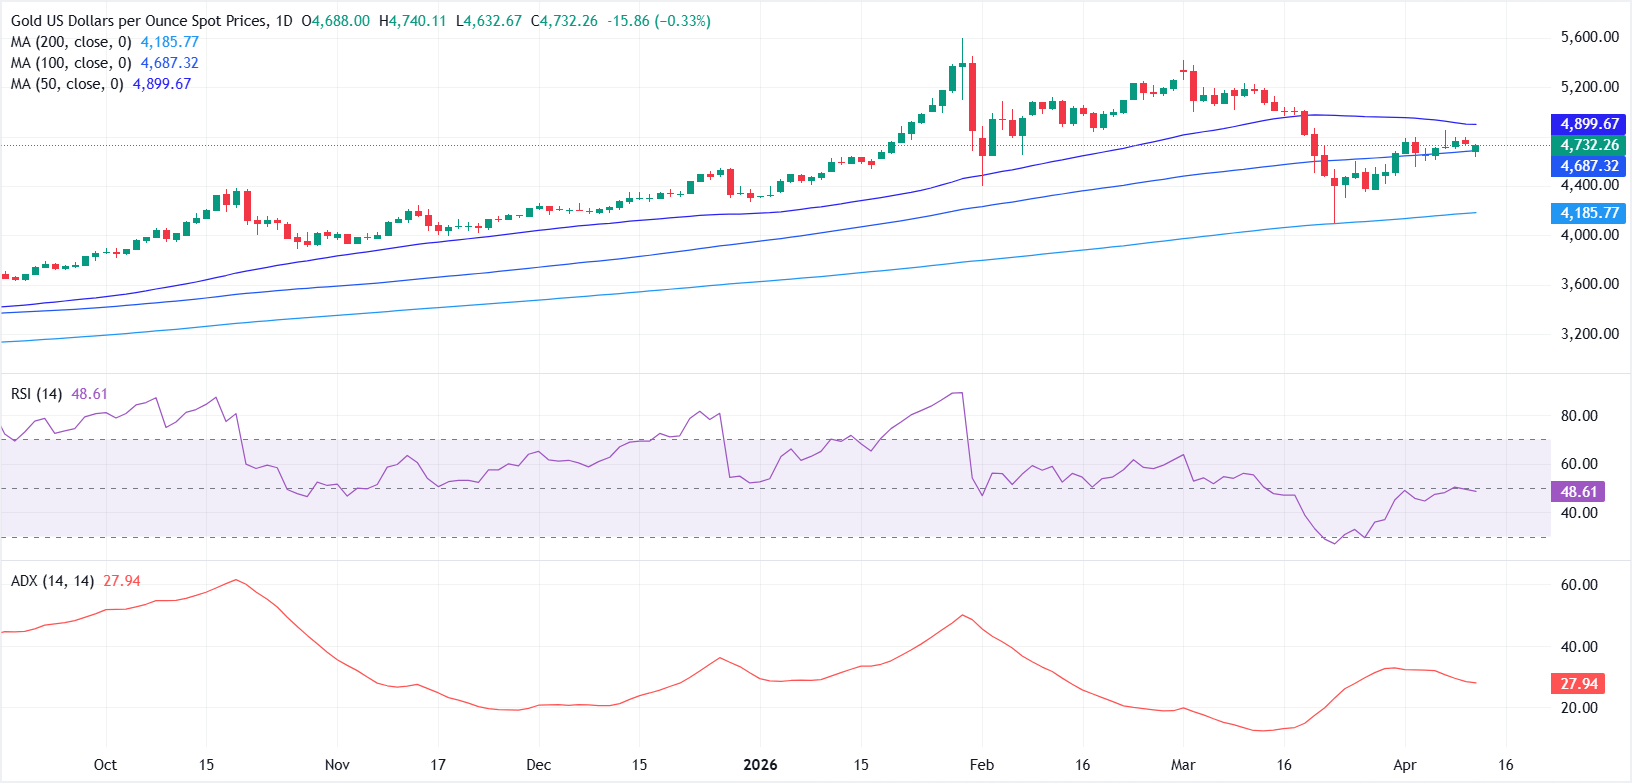
From a technical perspective, the daily chart shows XAU/USD holding above the 100-day Simple Moving Average (SMA) at $4,687.11 and well above the 200-day SMA near $4,185.66, while remaining capped below the 50-day SMA at $4,899.26. This keeps the broader bias neutral with a slight downside tilt as price consolidates between these key levels.
Momentum indicators point to a lack of strong direction, with the Relative Strength Index (14) near 47.55 suggesting buyers lack conviction, while the Average Directional Index around 27.94 reflects only moderate trend strength.
On the upside, a sustained move above the 50-day SMA would signal improving bullish momentum, with the $5,000–$5,200 zone emerging as the next resistance area.
On the downside, a failure to hold above the 100-day SMA could expose the $4,600–$4,500 support zone, followed by the 200-day SMA.
Gold FAQs
Gold has played a key role in human’s history as it has been widely used as a store of value and medium of exchange. Currently, apart from its shine and usage for jewelry, the precious metal is widely seen as a safe-haven asset, meaning that it is considered a good investment during turbulent times. Gold is also widely seen as a hedge against inflation and against depreciating currencies as it doesn’t rely on any specific issuer or government.
Central banks are the biggest Gold holders. In their aim to support their currencies in turbulent times, central banks tend to diversify their reserves and buy Gold to improve the perceived strength of the economy and the currency. High Gold reserves can be a source of trust for a country’s solvency. Central banks added 1,136 tonnes of Gold worth around $70 billion to their reserves in 2022, according to data from the World Gold Council. This is the highest yearly purchase since records began. Central banks from emerging economies such as China, India and Turkey are quickly increasing their Gold reserves.
Gold has an inverse correlation with the US Dollar and US Treasuries, which are both major reserve and safe-haven assets. When the Dollar depreciates, Gold tends to rise, enabling investors and central banks to diversify their assets in turbulent times. Gold is also inversely correlated with risk assets. A rally in the stock market tends to weaken Gold price, while sell-offs in riskier markets tend to favor the precious metal.
The price can move due to a wide range of factors. Geopolitical instability or fears of a deep recession can quickly make Gold price escalate due to its safe-haven status. As a yield-less asset, Gold tends to rise with lower interest rates, while higher cost of money usually weighs down on the yellow metal. Still, most moves depend on how the US Dollar (USD) behaves as the asset is priced in dollars (XAU/USD). A strong Dollar tends to keep the price of Gold controlled, whereas a weaker Dollar is likely to push Gold prices up.
Recommended Articles


