


Gold edges lower as stronger US Dollar offsets safe-haven demand
- Gold eases on Tuesday as the US Dollar climbs and Treasury yields rise.
- Middle East tensions linked to the US-Iran conflict keep safe-haven demand in focus.
- Technically, XAU/USD turns bearish after failing to sustain gains above $5,400.
Gold (XAU/USD) trades with a negative bias on Tuesday as a stronger US Dollar (USD) and rising US Treasury yields weigh on the non-yielding metal, even as geopolitical tensions surrounding the US-Iran conflict keep investors cautious.
At the time of writing, XAU/USD is trading around $5,139, easing from the daily high of $5,379 reached during the Asian session.
US Dollar climbs above 99.00 mark, Treasury yields extend gains
A stronger Greenback makes Dollar-denominated Gold more expensive for overseas buyers. The US Dollar Index (DXY), which tracks the Greenback's value against a basket of six major currencies, climbs above the 99.00 mark to its highest level in over a month. Meanwhile, US Treasury yields continue to rise, with the benchmark 10-year yield gaining nearly 17 basis points (bps) over the past two days.
Despite the recent pullback in Gold prices, the downside remains limited amid a risk-averse environment. Markets are pricing in the possibility of a prolonged conflict in the Middle East after the United States and Israel carried out joint strikes on Iran over the weekend, with Tehran responding by targeting US military bases across several Gulf nations.
The conflict is showing no signs of easing. Late Monday, two drones struck the US Embassy in Riyadh. US President Donald Trump warned that retaliation could follow, telling NewsNation, “you’ll find out soon,” when asked about Washington’s response.
Oil-driven inflation risks temper expectations for Fed interest rate cuts
Meanwhile, the lack of strong upside momentum in Gold suggests investors remain cautious about the broader economic impact of the conflict. The geopolitical risk premium embedded in Oil prices has raised concerns about higher inflation, which could potentially affect expectations for Federal Reserve (Fed) interest rate cuts.
According to the CME FedWatch Tool, markets are fully pricing in the Fed to keep interest rates unchanged at the March and April meetings. The odds of a 25-basis-point rate cut in June have fallen to 28.1%, down from 42.8% a week ago.
Looking ahead, the US economic calendar is relatively light on Tuesday, though several Fed officials are due to speak later in the American session.
Technical analysis: XAU/USD weakens after failing to sustain gains above $5,400
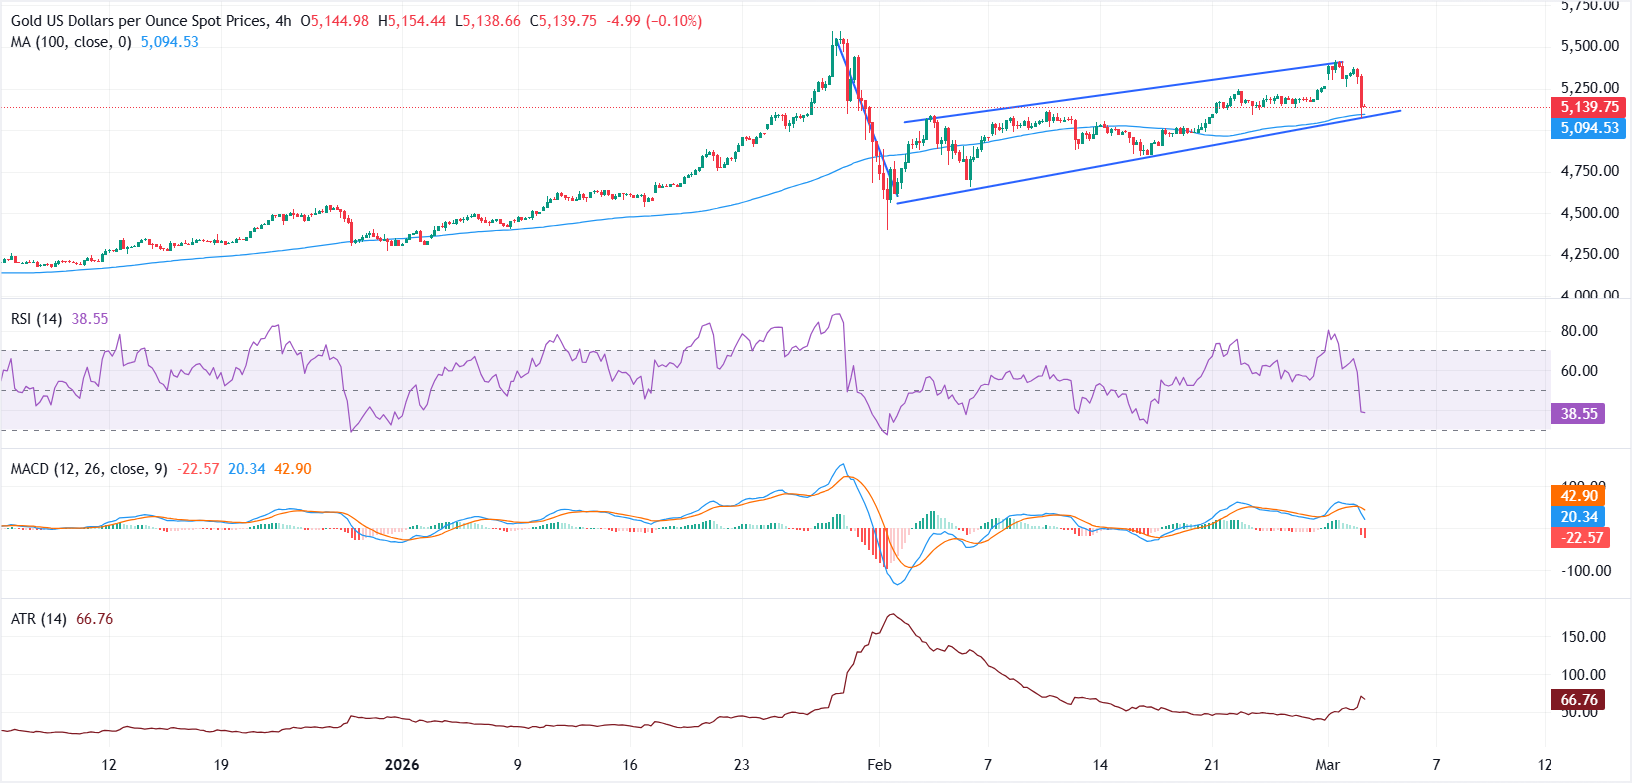
The near-term outlook for Gold turns bearish after buyers failed to sustain gains above $5,400. Price action on the 4-hour chart is forming a bearish flag pattern, signaling the possibility of further downside if support levels fail to hold.
The 100-period Simple Moving Average (SMA) near $5,093 aligns closely with the lower boundary of the flag, making it an important immediate support zone. A decisive break below this level could accelerate selling pressure and expose the next downside targets at $4,850, followed by $4,650.
On the upside, bulls would need to decisively reclaim and break above the $5,400–$5,500 resistance zone to invalidate the bearish structure and revive the broader uptrend.
Momentum indicators also point to growing downside pressure. The Relative Strength Index (RSI) has dropped sharply from overbought levels above 80 to around 39, indicating fading bullish momentum.
Meanwhile, the Moving Average Convergence Divergence (MACD) indicator has turned negative, with the MACD line falling below the signal line and the histogram expanding into negative territory. At the same time, the Average True Range (ATR) is rising, highlighting increasing volatility as selling pressure builds.
Gold FAQs
Gold has played a key role in human’s history as it has been widely used as a store of value and medium of exchange. Currently, apart from its shine and usage for jewelry, the precious metal is widely seen as a safe-haven asset, meaning that it is considered a good investment during turbulent times. Gold is also widely seen as a hedge against inflation and against depreciating currencies as it doesn’t rely on any specific issuer or government.
Central banks are the biggest Gold holders. In their aim to support their currencies in turbulent times, central banks tend to diversify their reserves and buy Gold to improve the perceived strength of the economy and the currency. High Gold reserves can be a source of trust for a country’s solvency. Central banks added 1,136 tonnes of Gold worth around $70 billion to their reserves in 2022, according to data from the World Gold Council. This is the highest yearly purchase since records began. Central banks from emerging economies such as China, India and Turkey are quickly increasing their Gold reserves.
Gold has an inverse correlation with the US Dollar and US Treasuries, which are both major reserve and safe-haven assets. When the Dollar depreciates, Gold tends to rise, enabling investors and central banks to diversify their assets in turbulent times. Gold is also inversely correlated with risk assets. A rally in the stock market tends to weaken Gold price, while sell-offs in riskier markets tend to favor the precious metal.
The price can move due to a wide range of factors. Geopolitical instability or fears of a deep recession can quickly make Gold price escalate due to its safe-haven status. As a yield-less asset, Gold tends to rise with lower interest rates, while higher cost of money usually weighs down on the yellow metal. Still, most moves depend on how the US Dollar (USD) behaves as the asset is priced in dollars (XAU/USD). A strong Dollar tends to keep the price of Gold controlled, whereas a weaker Dollar is likely to push Gold prices up.
Recommended Articles


