




Ge Vernova Inc Stock (GEV) Moved Down by 5.65% on Aug 18: What Investors Need To Know
Ge Vernova Inc (GEV) moved down by 5.65%. The Utilities sector is down by 0.43%. The company underperformed the industry. Top 3 stocks by turnover in the sector: Ge Vernova Inc (GEV) down 5.65%; Nextera Energy Inc (NEE) up 0.94%; Consolidated Edison Inc (ED) down 0.14%.
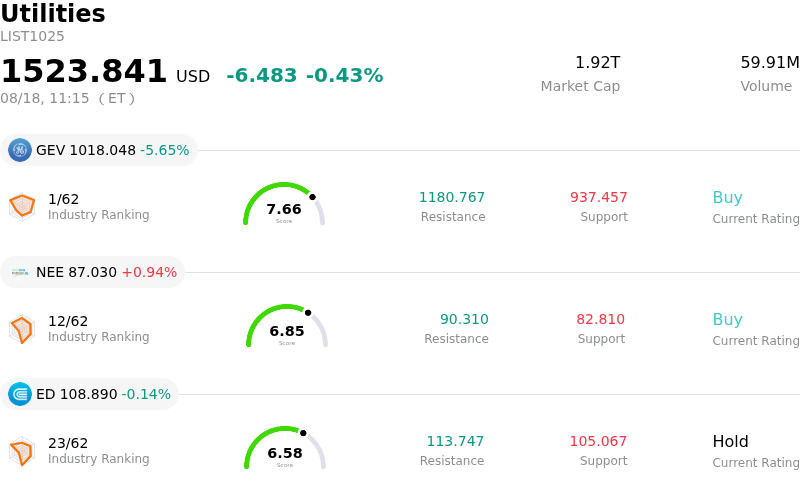
What is driving Ge Vernova Inc (GEV)’s stock price down today?
GE Vernova experienced notable downward pressure and intraday volatility as investors engaged in profit-taking following a multi-month rally driven by power grid modernization and artificial intelligence data center demand. Despite strong secular growth drivers and a massive multi-year order backlog, the stock's elevated valuation—trading at a significant premium relative to broader industrial peers—leaves minimal margin for operational missteps. This valuation sensitivity has made the equity increasingly vulnerable to profit-taking and elevated intraday price swings.
Fundamental concerns surrounding bottom-line margin expansion have also weighed on investor sentiment. The company's recent earnings release revealed a bottom-line miss relative to consensus expectations, pointing to ongoing conversion challenges between top-line revenue expansion and bottom-line profitability. While the power and electrification divisions continue to benefit from robust demand, persistent operational losses within the wind segment remain a headwind. Additionally, management projections regarding net tariff cost inflation alongside persistent supply chain bottlenecks continue to create execution risks.
Market dynamics were further influenced by institutional position adjustments and analyst commentary. Recent regulatory filings showed select asset management firms reducing their holdings, accompanied by insider sales that prompted cautionary positioning among market participants. While Wall Street remains broadly constructive on GE Vernova's long-term positioning as an energy infrastructure backbone, near-term capital reallocation away from high-multiple industrial names has driven the pull-back.
Technical Analysis of Ge Vernova Inc (GEV)
Technically, Ge Vernova Inc (GEV) shows a MACD (12,26,9) value of 21.109, indicating a neutral signal. The RSI at 58.719 suggests neutral condition and the Williams %R at 10.229 suggests overbought condition. Please monitor closely.
Media Coverage of Ge Vernova Inc (GEV)
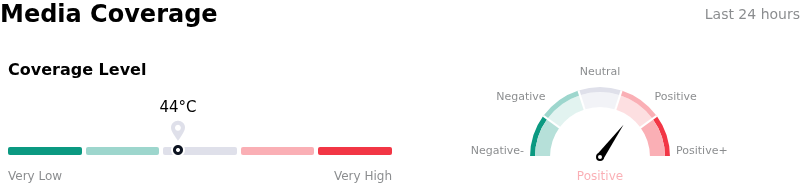
In terms of media coverage, Ge Vernova Inc (GEV) shows a coverage score of 44, indicating a moderate level of media attention. The overall market sentiment index is currently in bullish zone.
Fundamental Analysis of Ge Vernova Inc (GEV)
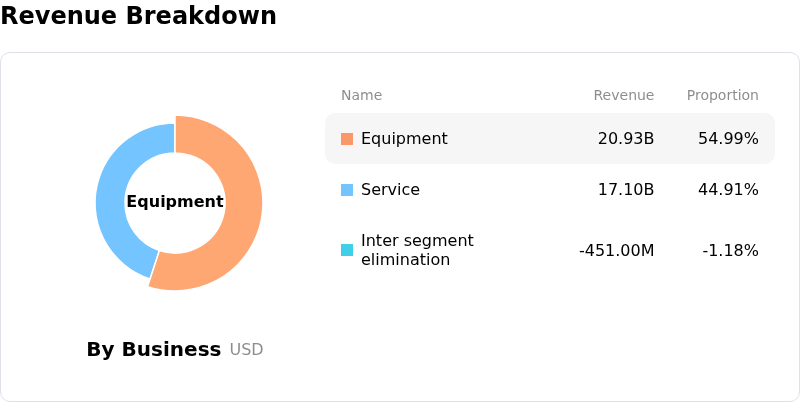
Ge Vernova Inc (GEV) is in the Utilities industry. Its latest annual revenue is $38.07B, ranking 2 in the industry. The net profit is $4.88B, ranking 4 in the industry. Company Profile
Over the past month, multiple analysts have rated the company as Buy, with an average price target of $1218.98, a high of $1450.00, and a low of $836.00.
More details about Ge Vernova Inc (GEV)
Company Specific Risks:
- Bottom-Line Profit Conversion Miss: Recent quarterly earnings of $2.47 per share fell significantly short of the $3.17 analyst consensus estimate, triggering institutional concerns over bottom-line profit conversion despite strong top-line revenue growth.
- Persistent Operational Losses in Wind Segment: The Wind business division remains an operational drag on overall profitability, generating a segment EBITDA loss of $275 million with a negative 13.6% margin due to sluggish onshore turbine demand and regulatory permitting friction.
- Tariff Cost Inflation and Logistics Constraints: Management projects net tariff cost headwinds of $250 million to $350 million across full-year 2026, alongside persistent global supply chain bottlenecks and logistical delays that threaten production timelines.
- Elevated Valuation and Manufacturing Capacity Limits: Trading at a premium forward price-to-earnings multiple near 40x, the stock leaves minimal margin for execution errors while annual gas turbine production capacity limits constrain the speed of converting its $176 billion backlog into realized earnings.
Recommended Articles


