


Ethereum Price Prediction: What To Expect From ETH In March 2026


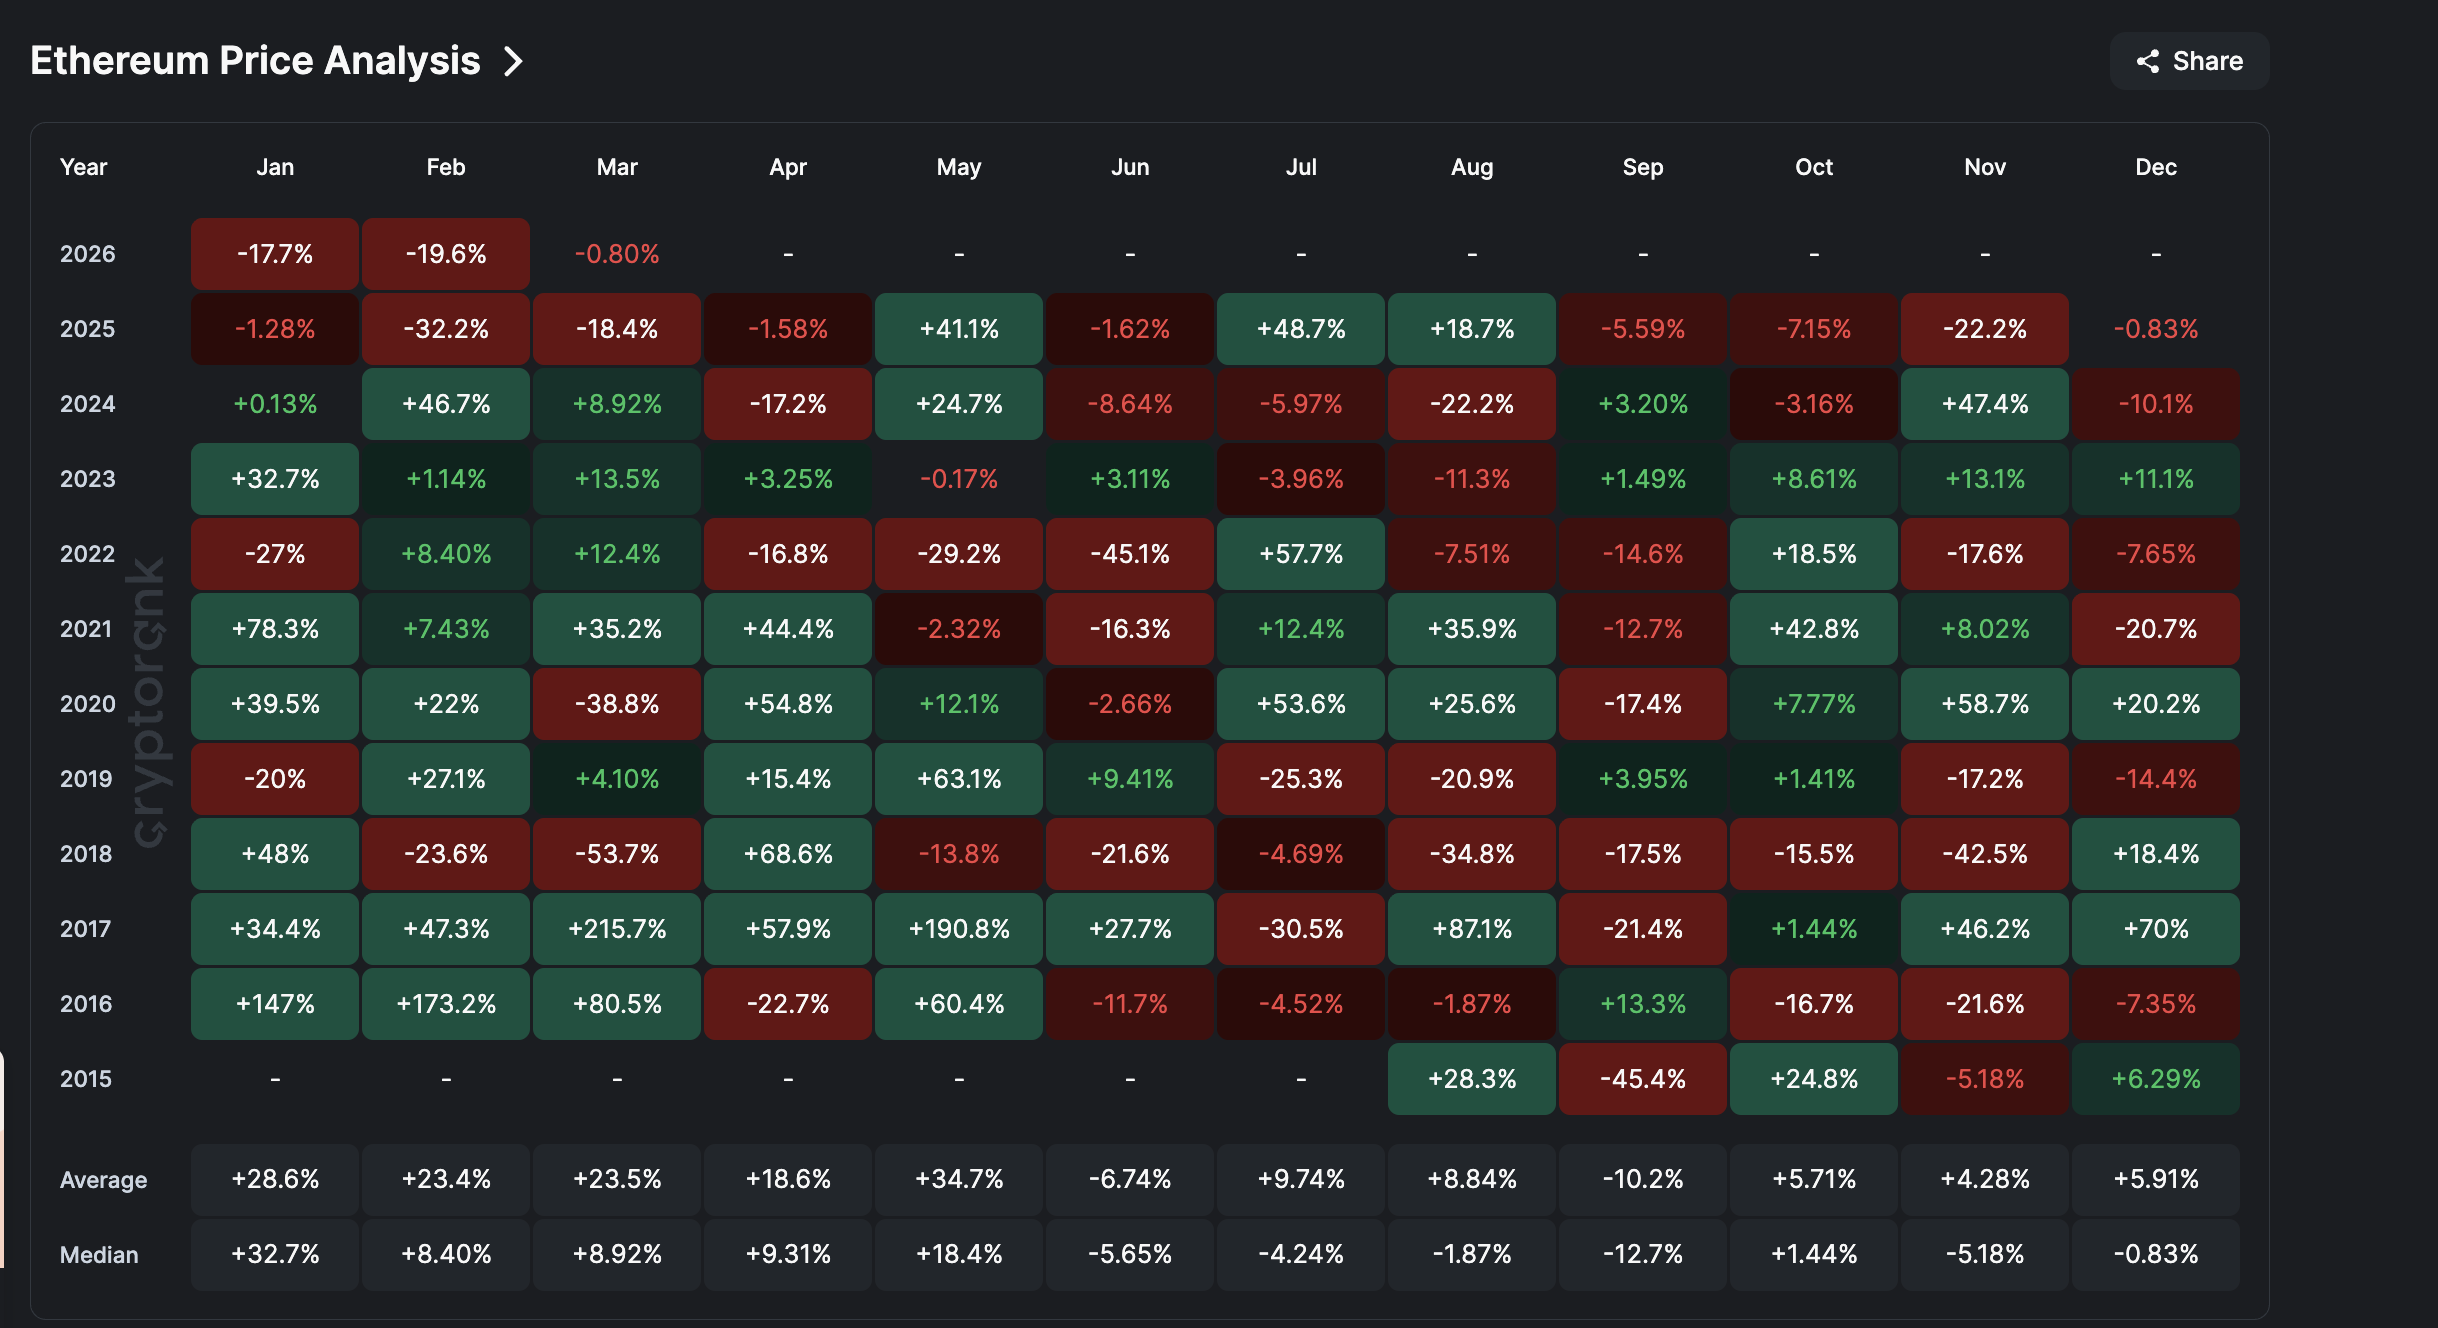
The Ethereum price enters March after a brutal February that delivered close to 20% losses. ETH has now posted six consecutive red months starting from September 2025, a streak unprecedented in the token’s history. If March finishes in the red, it would extend to seven months, further cementing this as the longest sustained decline Ethereum has ever seen.
While March historically carries a median return of nearly 9% for ETH, the current setup suggests history may offer little guidance. Here is what the data shows.
The Weekly Chart Has Already Broken Down
Even February 2025, which saw a 32% decline, immediately saw a recovery attempt over the next few months. This time, the selling has been relentless, and the weekly chart explains why. Six straight months of red, excluding March (just formed), is no mean bearish feat.
Want more token insights like this? Sign up for Editor Harsh Notariya’s Daily Crypto Newsletter here.
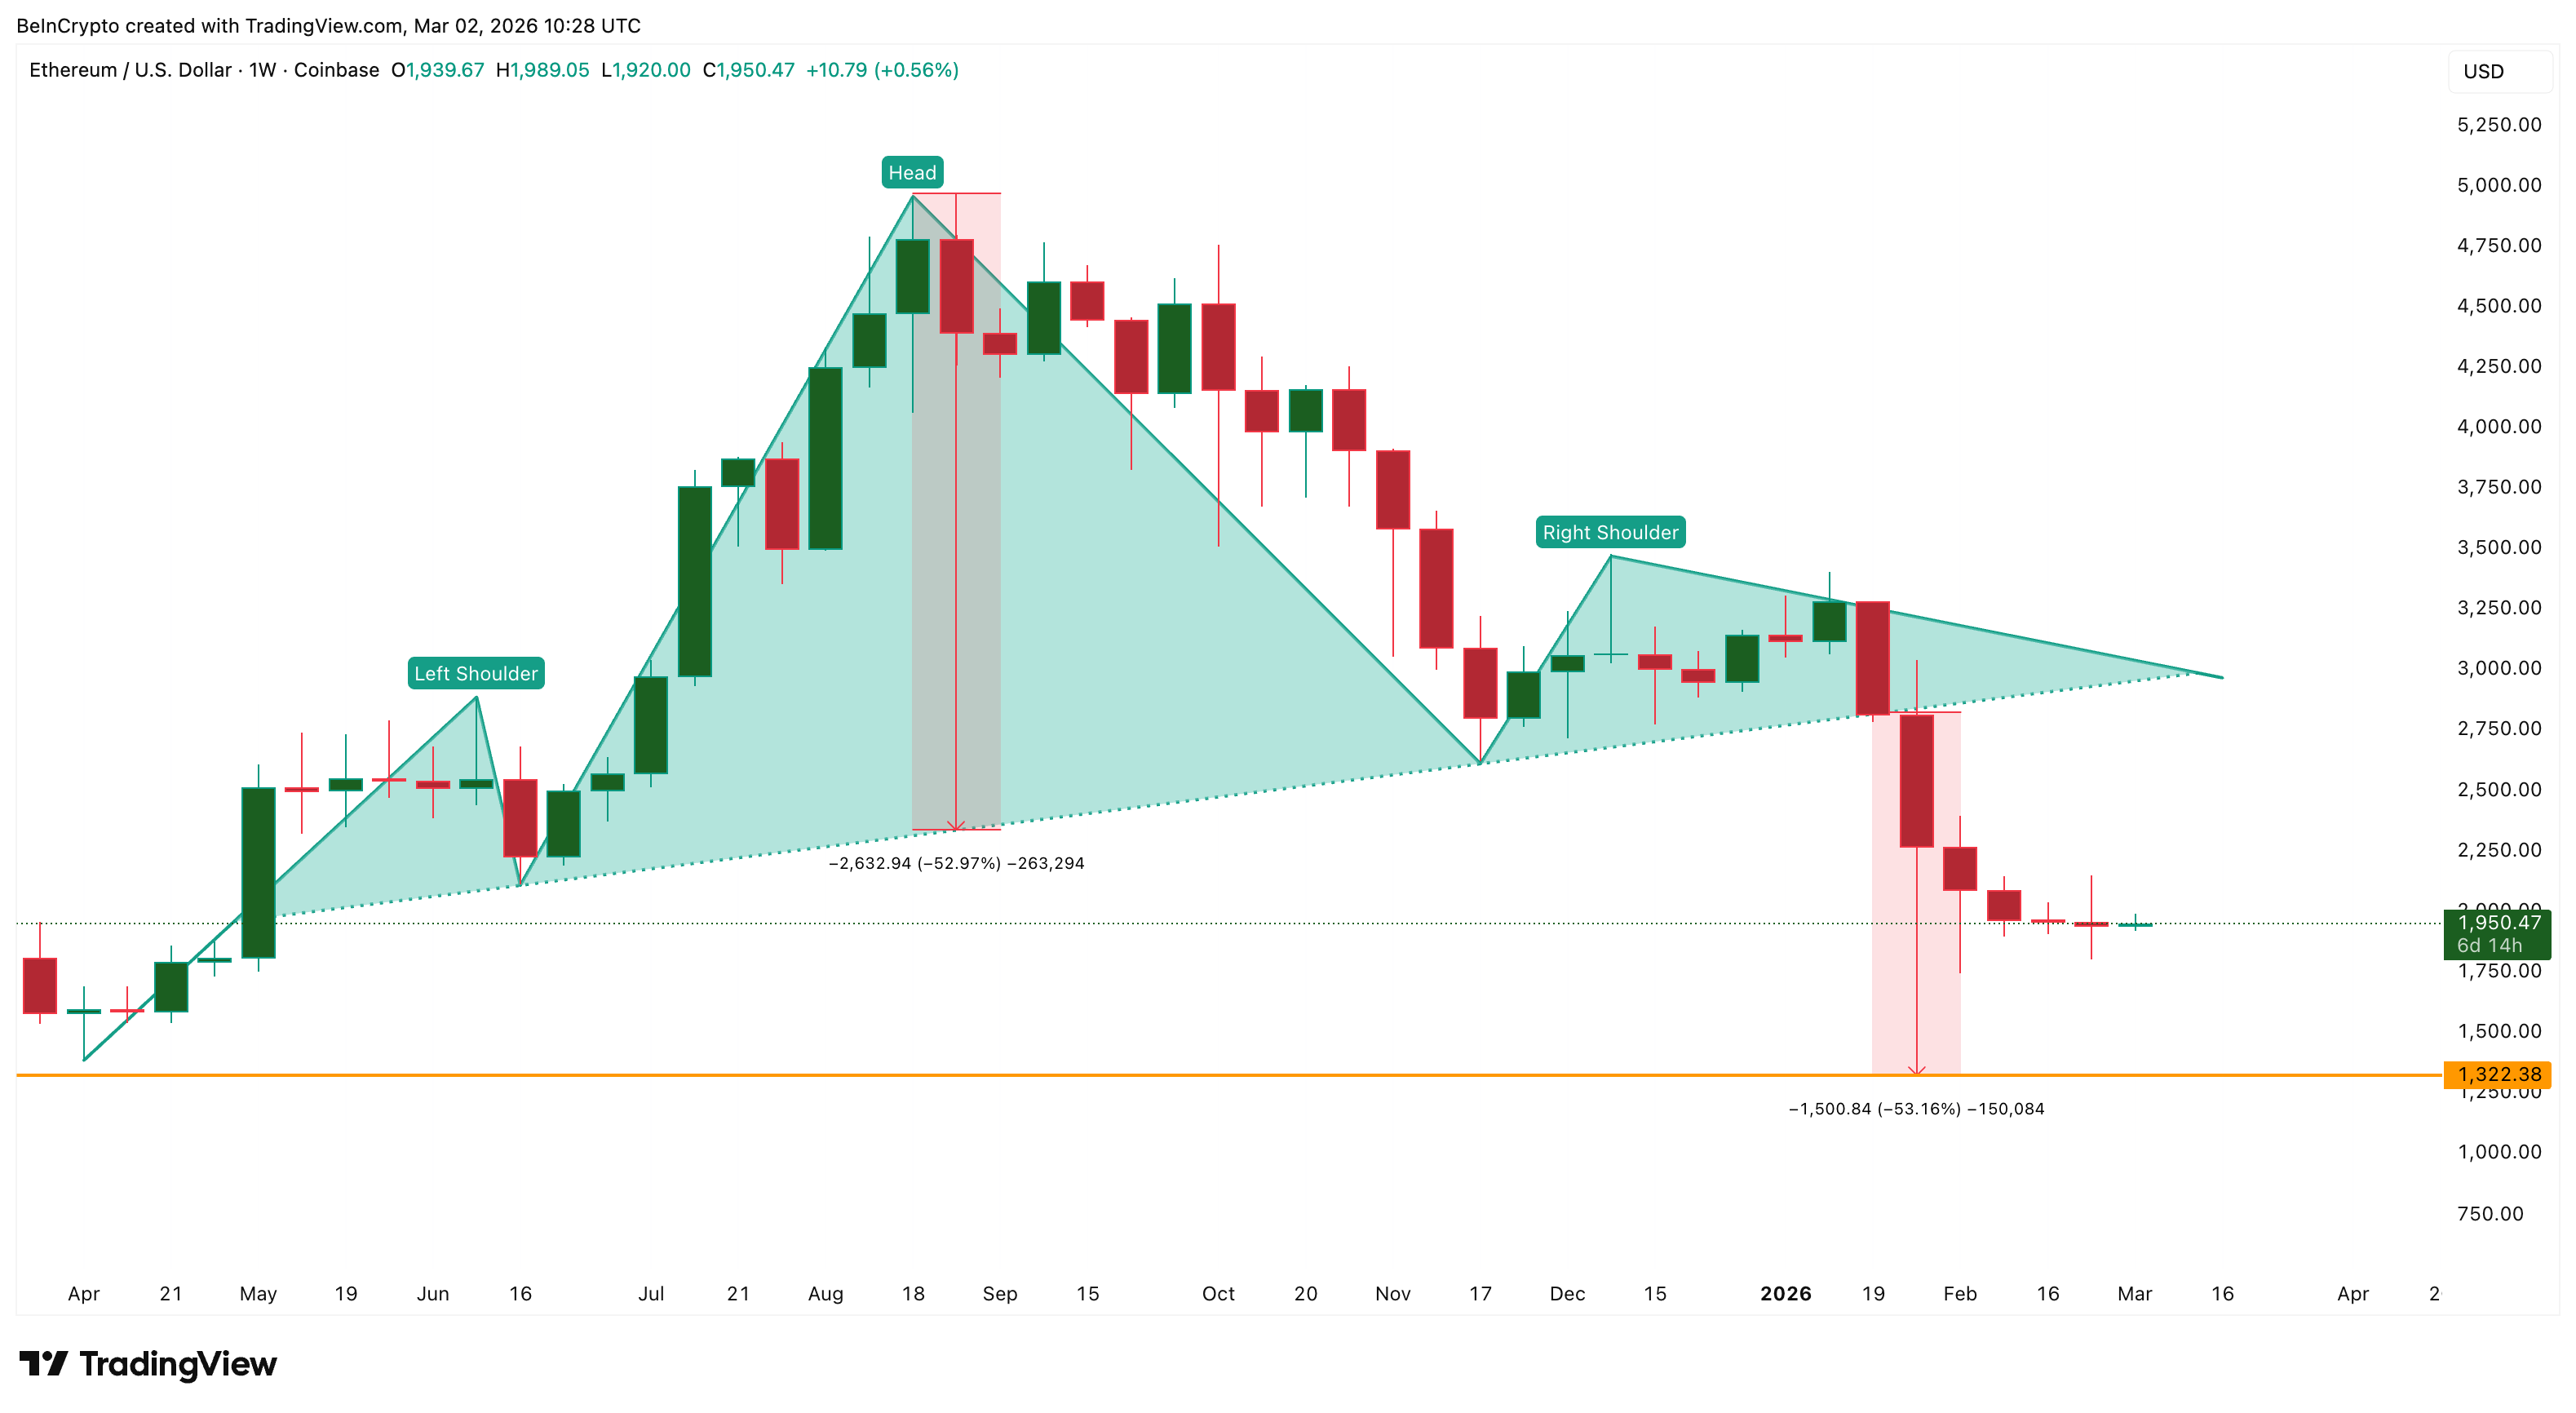
Since April 7, 2025, the Ethereum price has been trading within a head-and-shoulders pattern. It is a bearish reversal structure in which a central peak (the head) is flanked by two lower peaks (the shoulders). The breakdown confirmed in early January 2026, and it was not a minor dip. It was a structural break.
The measured move from this pattern projects a roughly 53% decline from the breakdown line, targeting approximately $1,320. While that level has not yet been reached, the pattern remains active and unresolved.
Making matters worse, two additional bearish crossovers are forming on the weekly Exponential Moving Averages (EMAs), which smooth price data to highlight trend direction.
The 50-period EMA is closing in on the 100-period EMA, and the 20-period EMA is approaching the 200-period EMA. The last confirmed crossover — when the 20 EMA crossed below the 50 EMA in early January — preceded a 46% correction.
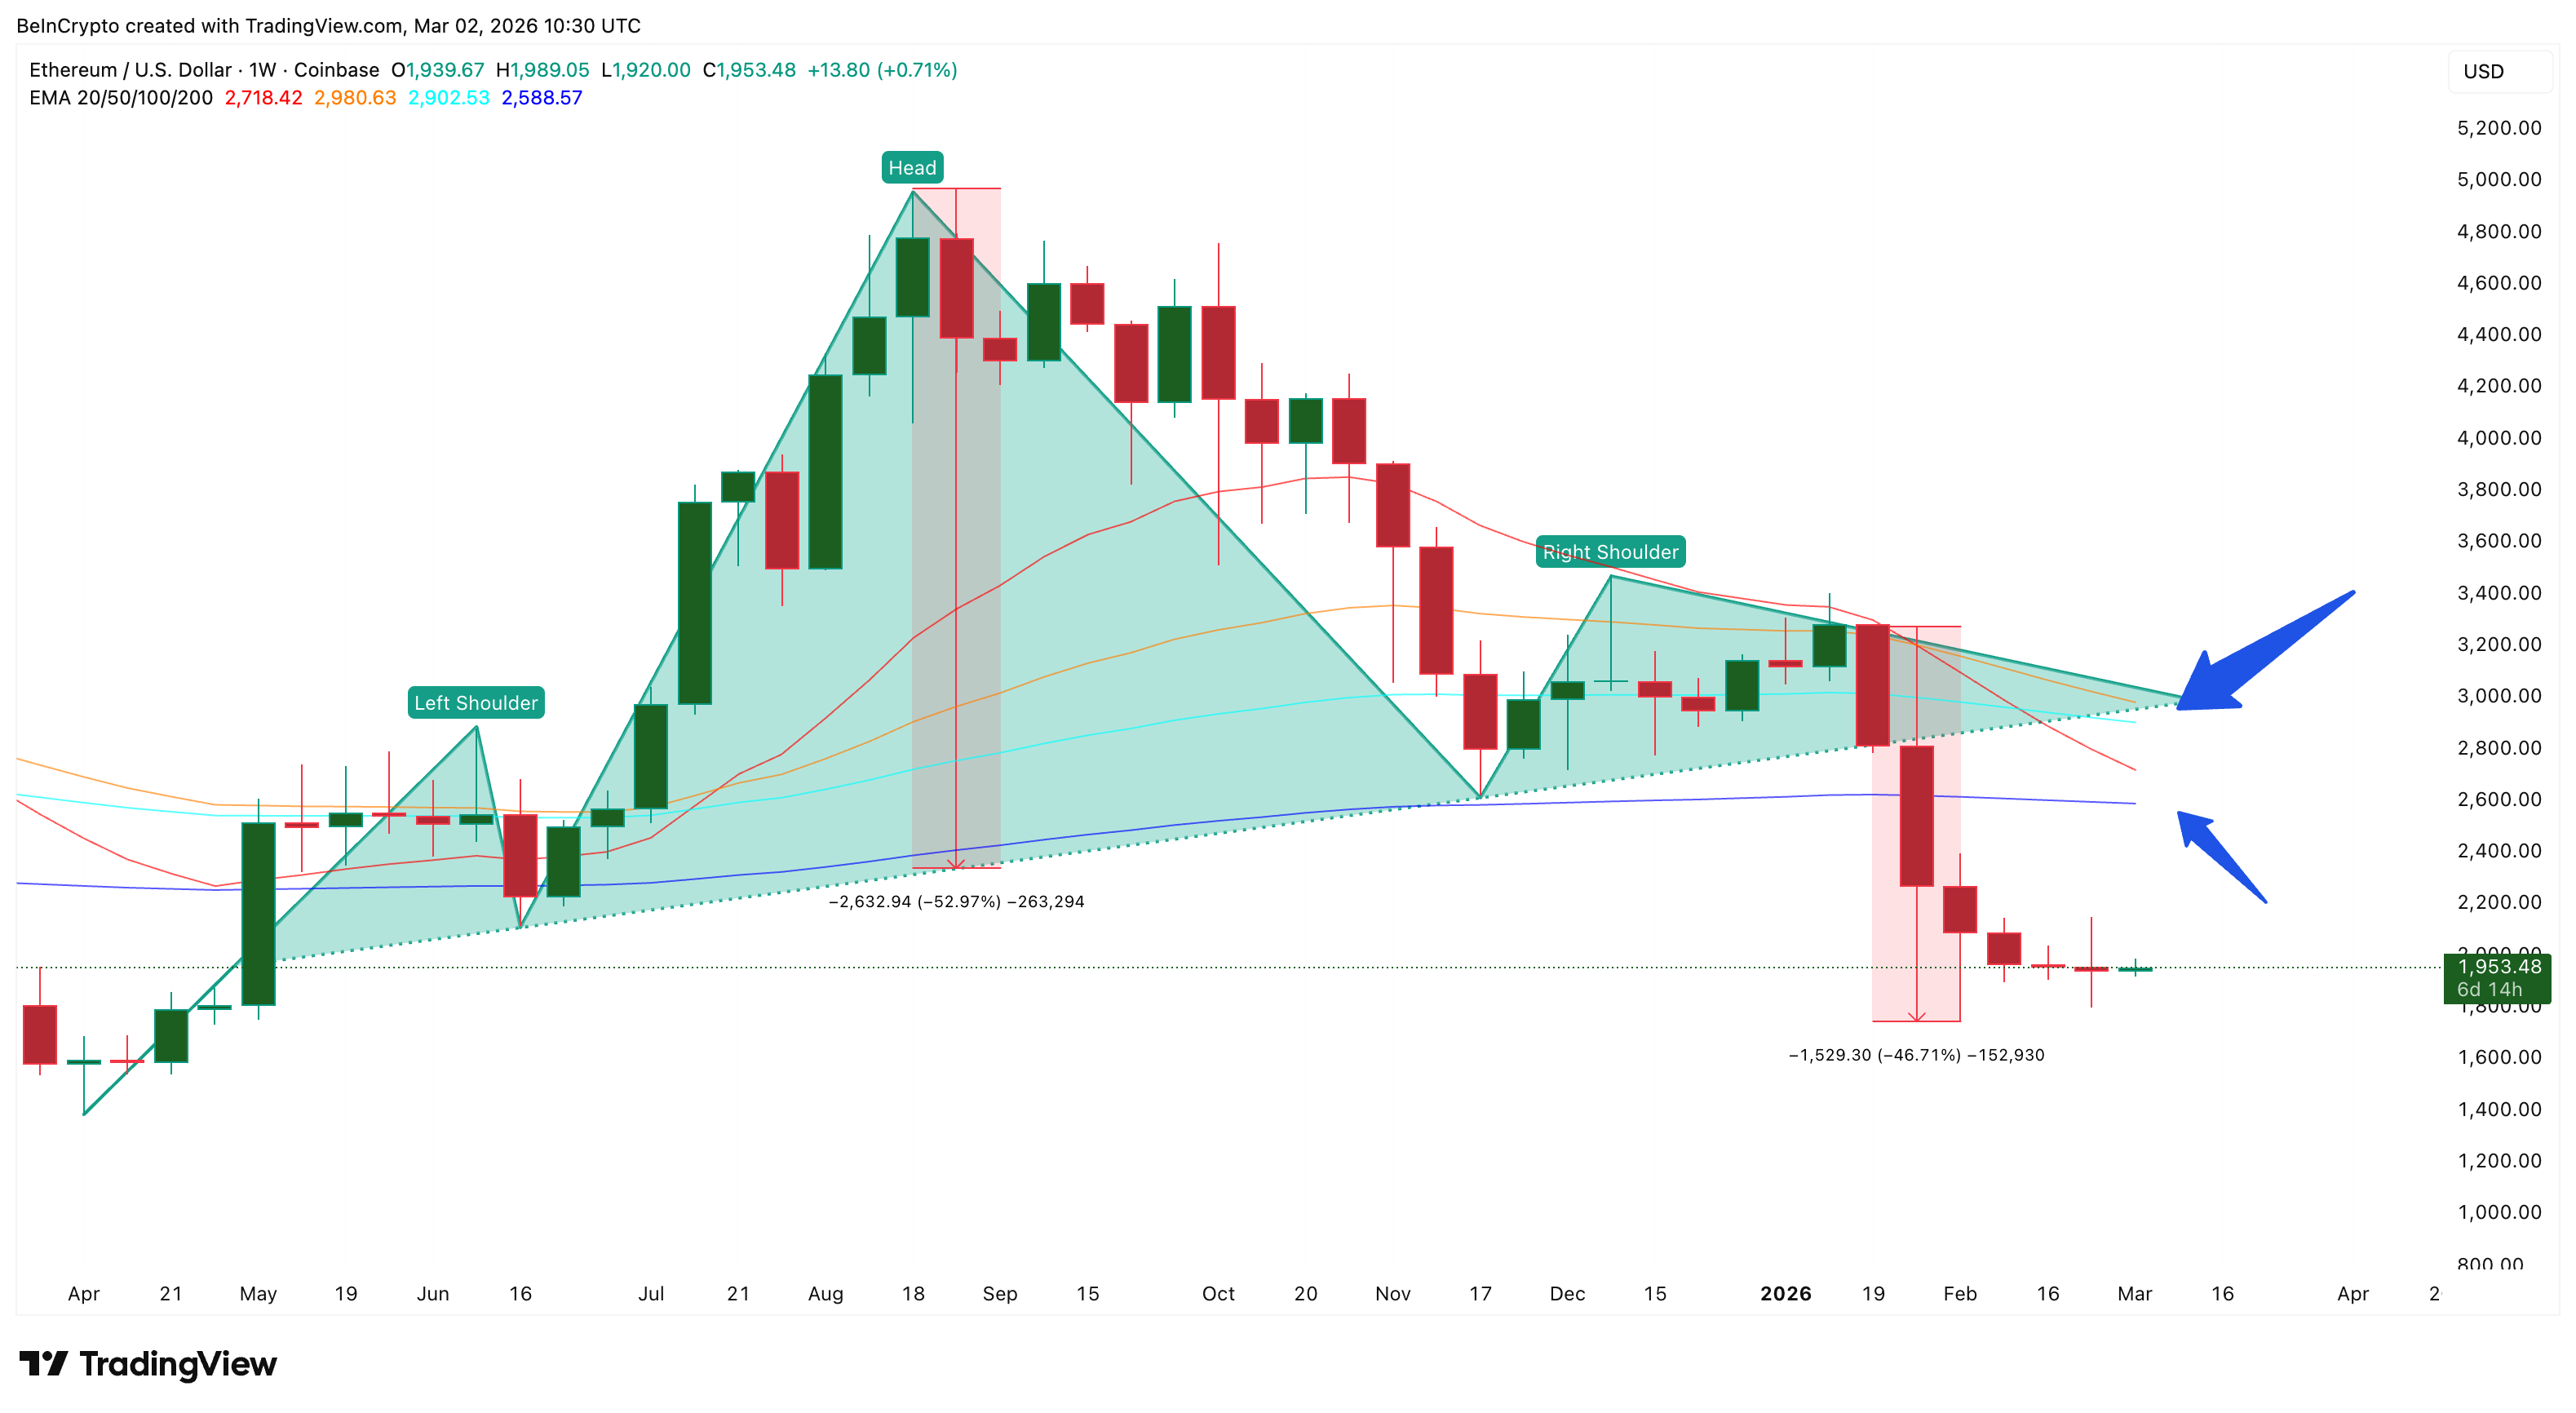
If these new crossovers confirm, they would reinforce the bearish trend on the higher timeframe.
Ethereum ETF Outflows Offer No Institutional Floor
Unlike Bitcoin, where spot ETF outflows have been steadily declining, Ethereum’s ETF picture is deteriorating. February recorded $369.87 million in net outflows — higher than January’s $353.20 million. This reversed the improving trend that had briefly offered hope when January’s outflows shrank compared to December’s $616.82 million.
This marks four consecutive months of outflows since November 2025, when $1.42 billion exited. The last positive inflow month was October 2025 at $569.92 million.
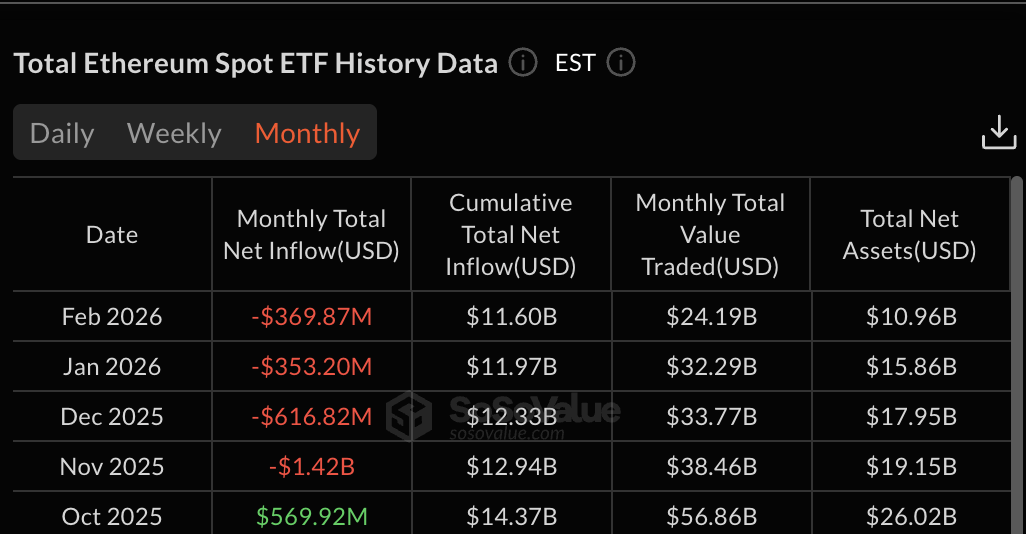
For the Ethereum price, this means there is no institutional demand floor forming heading into March. The capital that once supported ETH through ETF channels is withdrawing, and unlike Bitcoin, the bleeding is not slowing down.
HODLers Are Buying, But The Plot Thickens
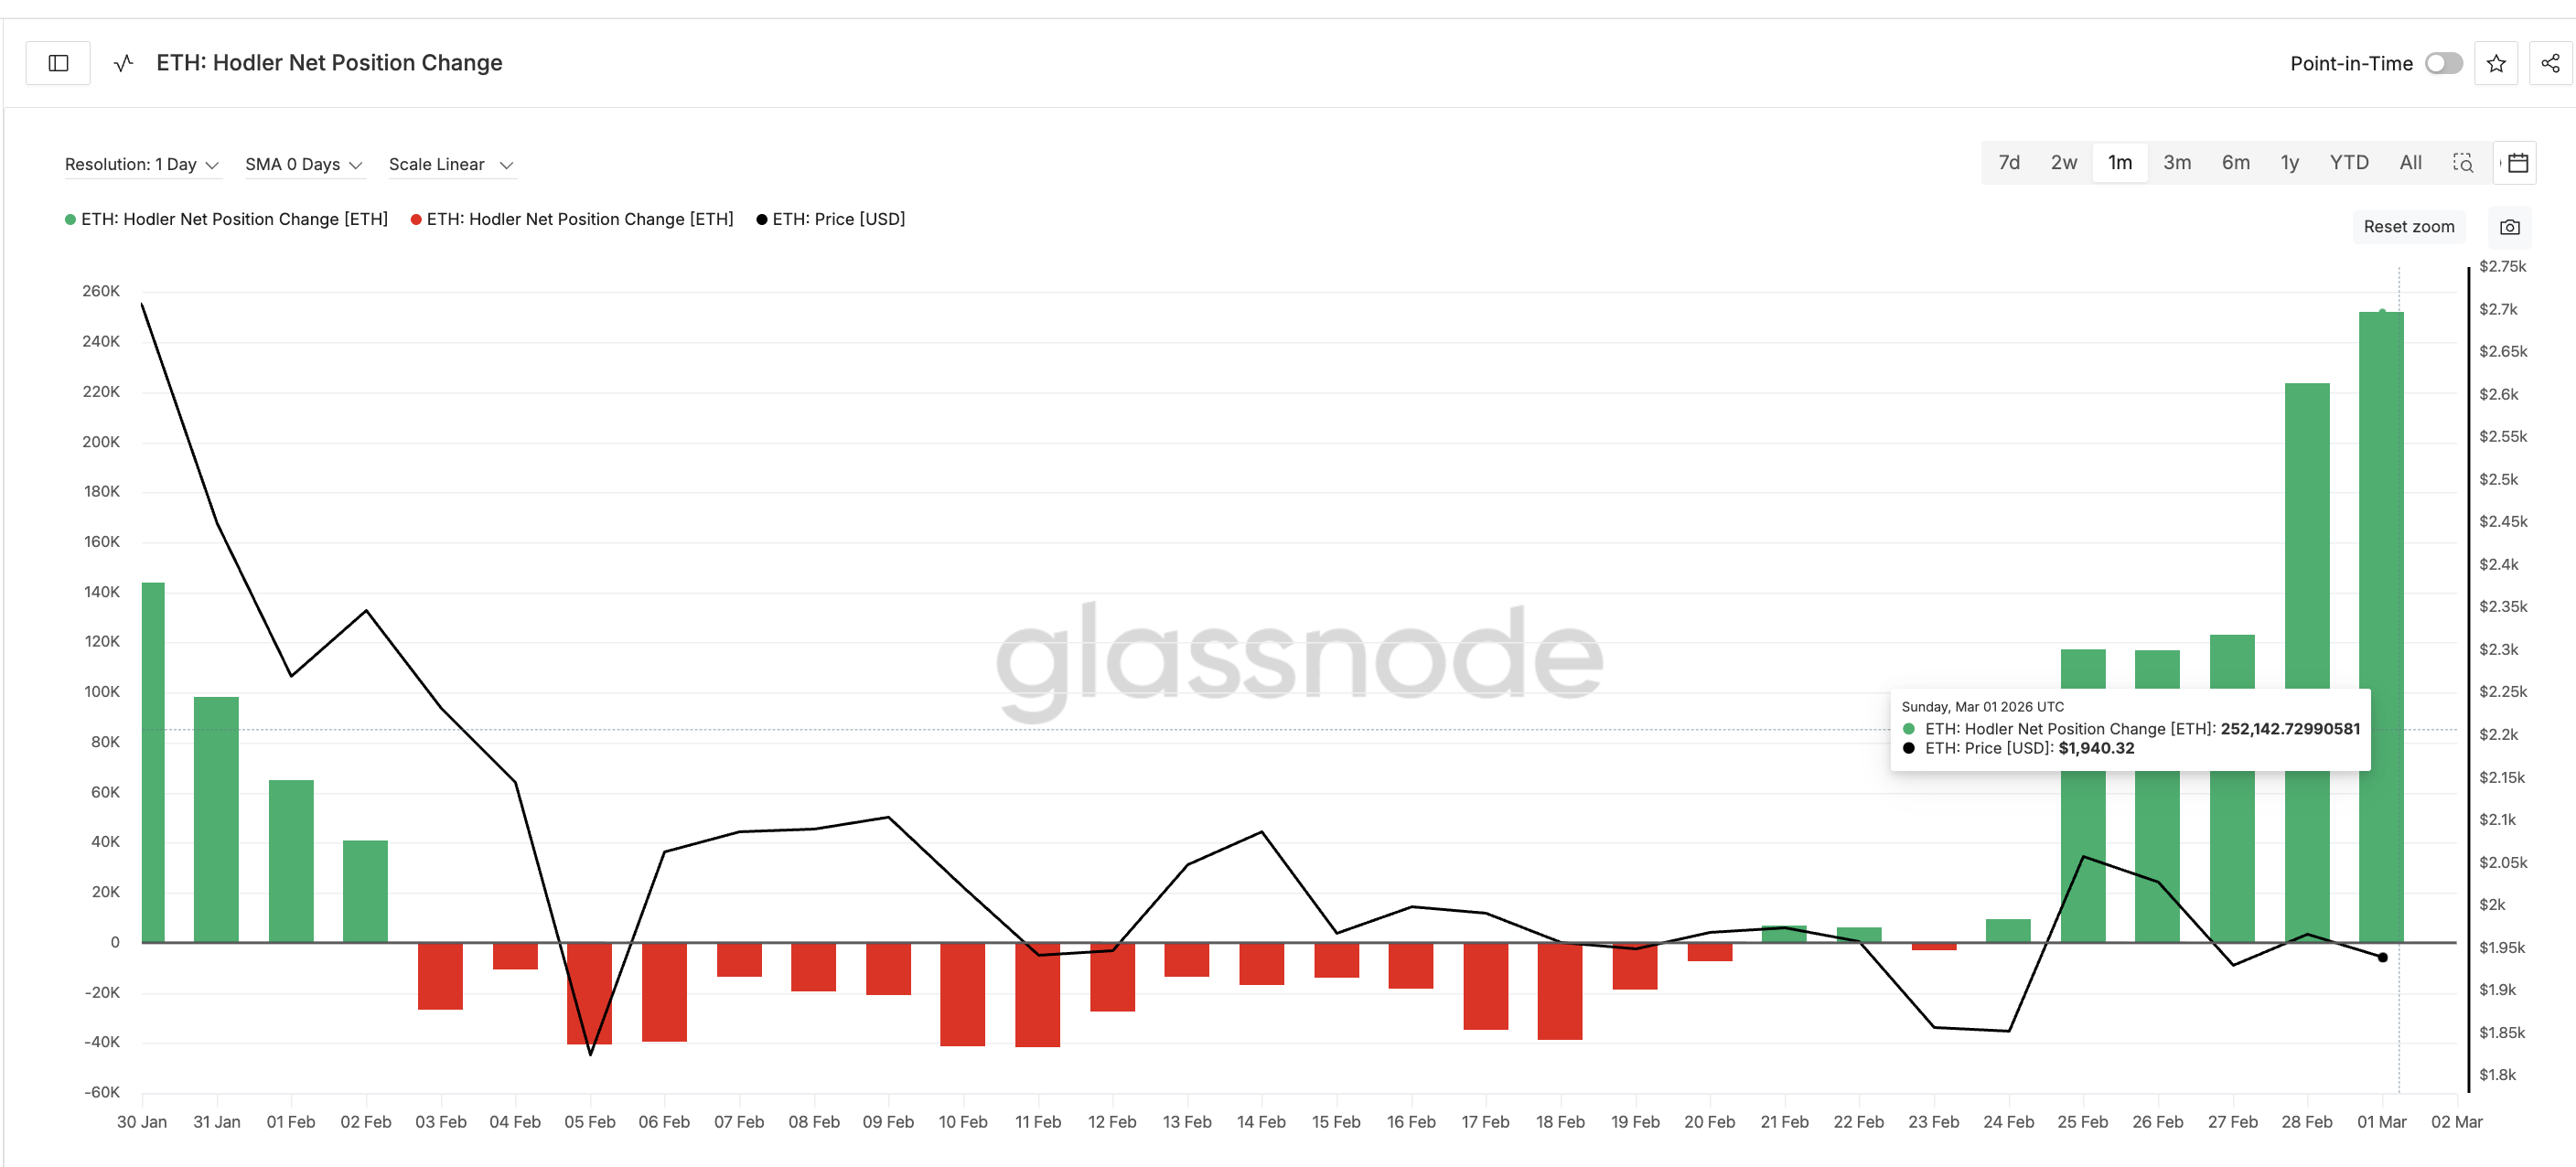
Against this bearish backdrop, one on-chain metric stands out. Ethereum hodlers — wallets that have held ETH for 155 days or more — have sharply increased their buying. On February 21, the hodler net position change metric was a modest +6,829 ETH. By March 1, it surged to +252,142 ETH, a massive 3,500% spike that on the surface looks like strong conviction.
But context complicates this signal. The last major hodler buying spell began on December 26, 2025, when the Ethereum price was around $2,920. They kept accumulating as the price climbed to $3,350 by January 14. Then the weekly EMA crossover triggered, and the price began falling sharply. Hodlers continued buying through the decline. Their net position only turned negative on February 2, when the price had already dropped to $2,340.
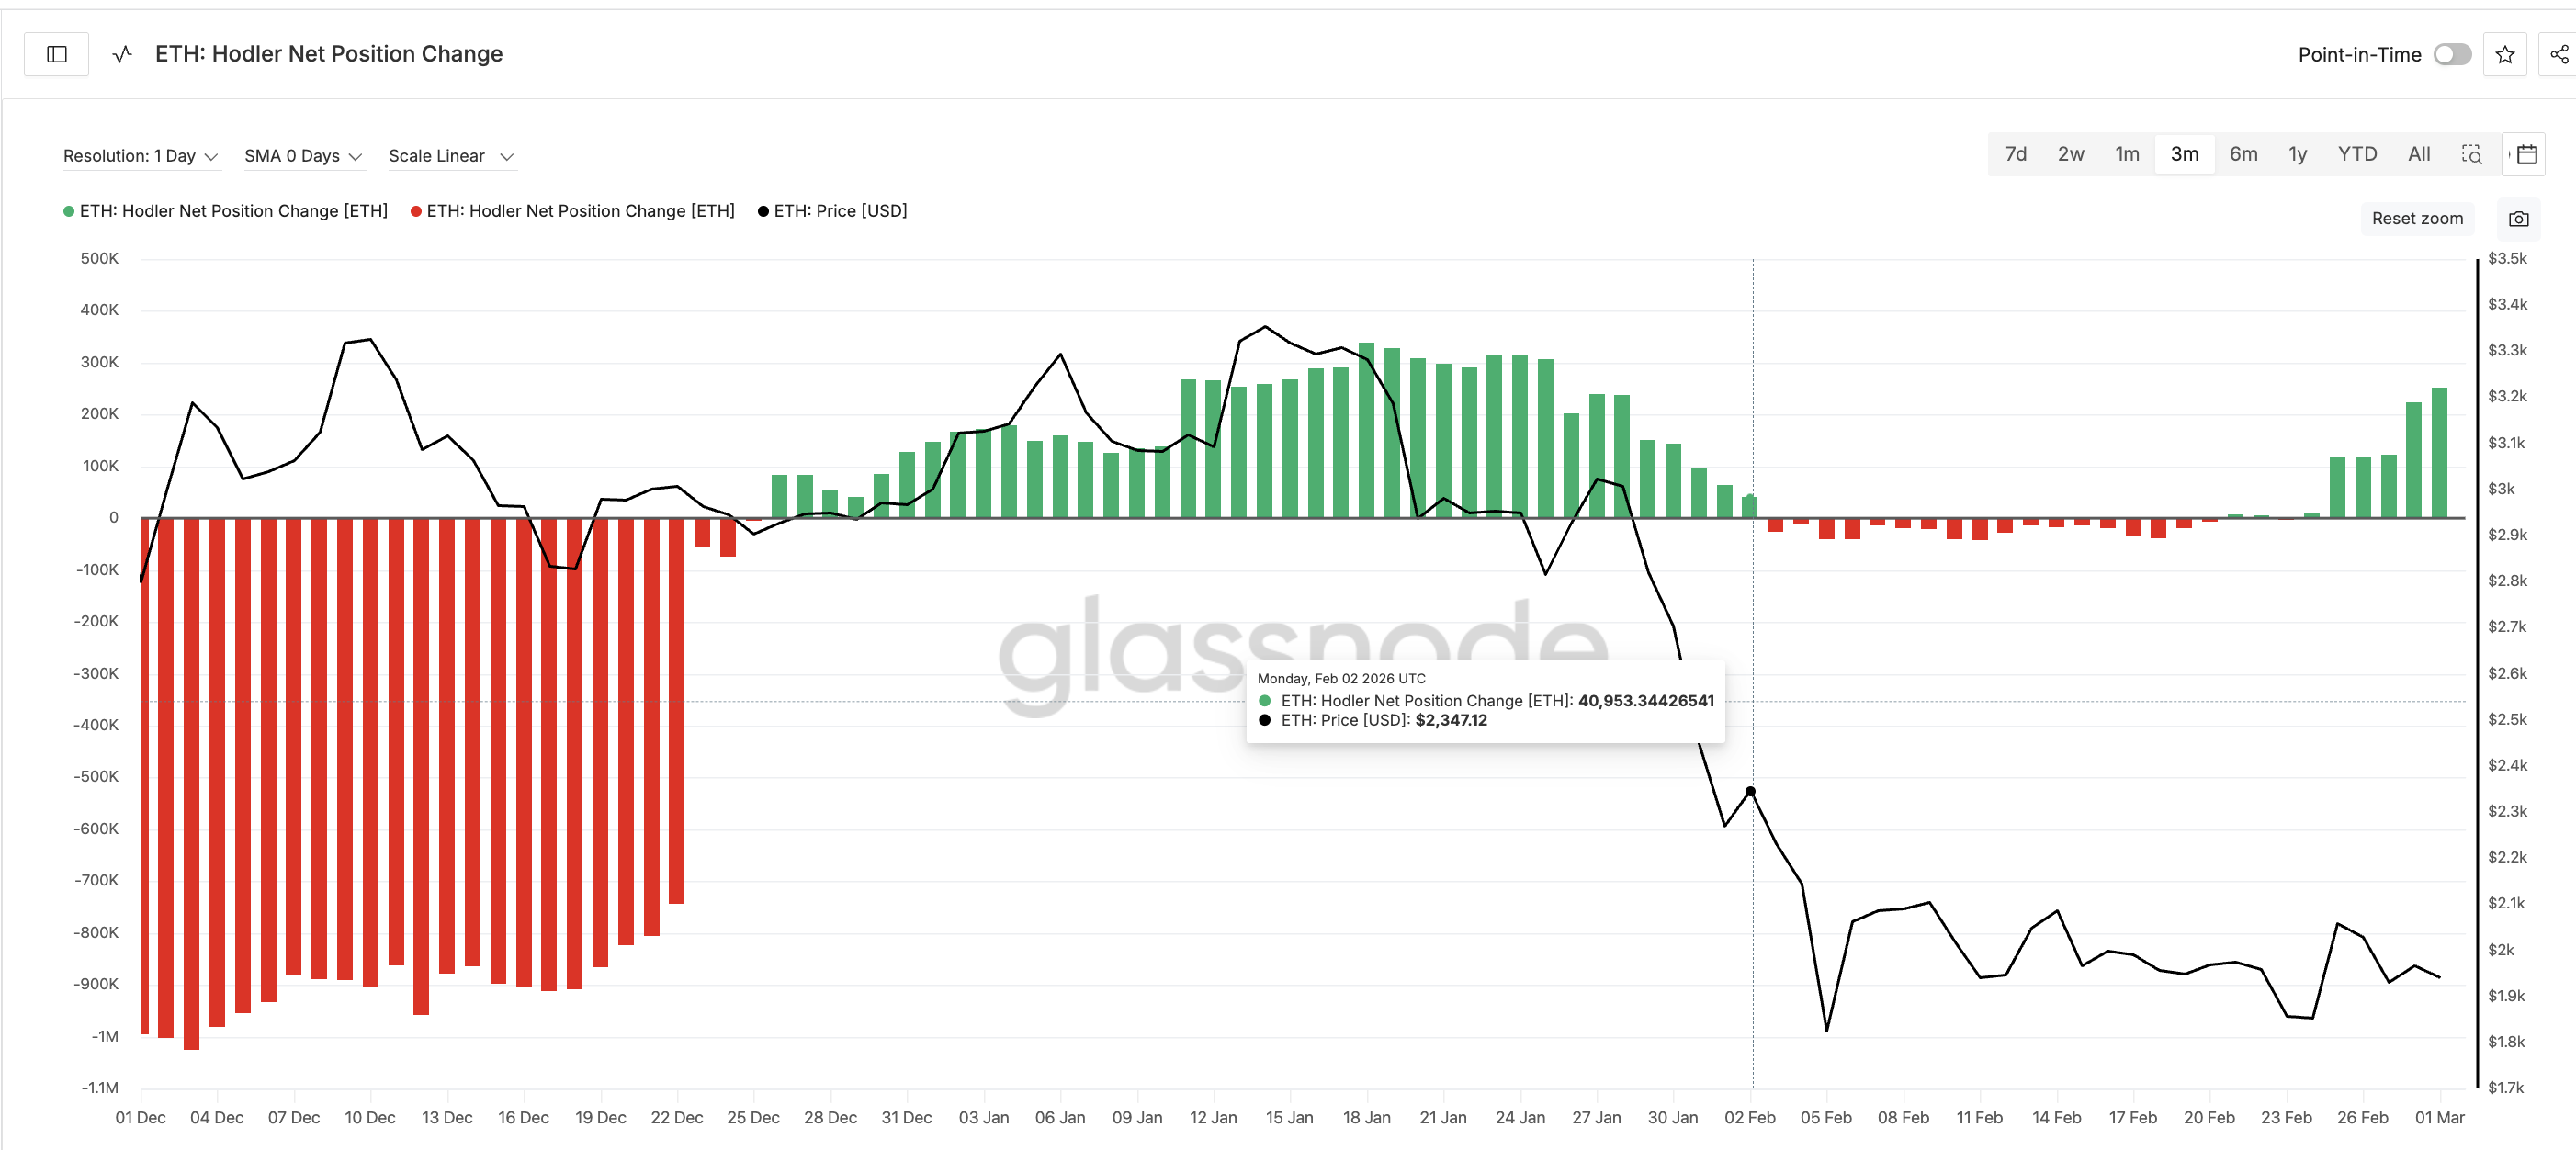
Many of these hodlers are therefore likely trapped between $2,340 and $3,350. The current buying surge may not represent fresh bullish conviction but rather an attempt to average down and break even. Retail investors should be cautious about following this signal blindly — the motivation behind the buying may be survival, not strategy.
But There Is a Reason They Are Buying; And the Key Ethereum Price Levels to Watch
If hodlers are trapped, why are they increasing exposure now, in a weak market? The 12-hour chart may hold the answer.
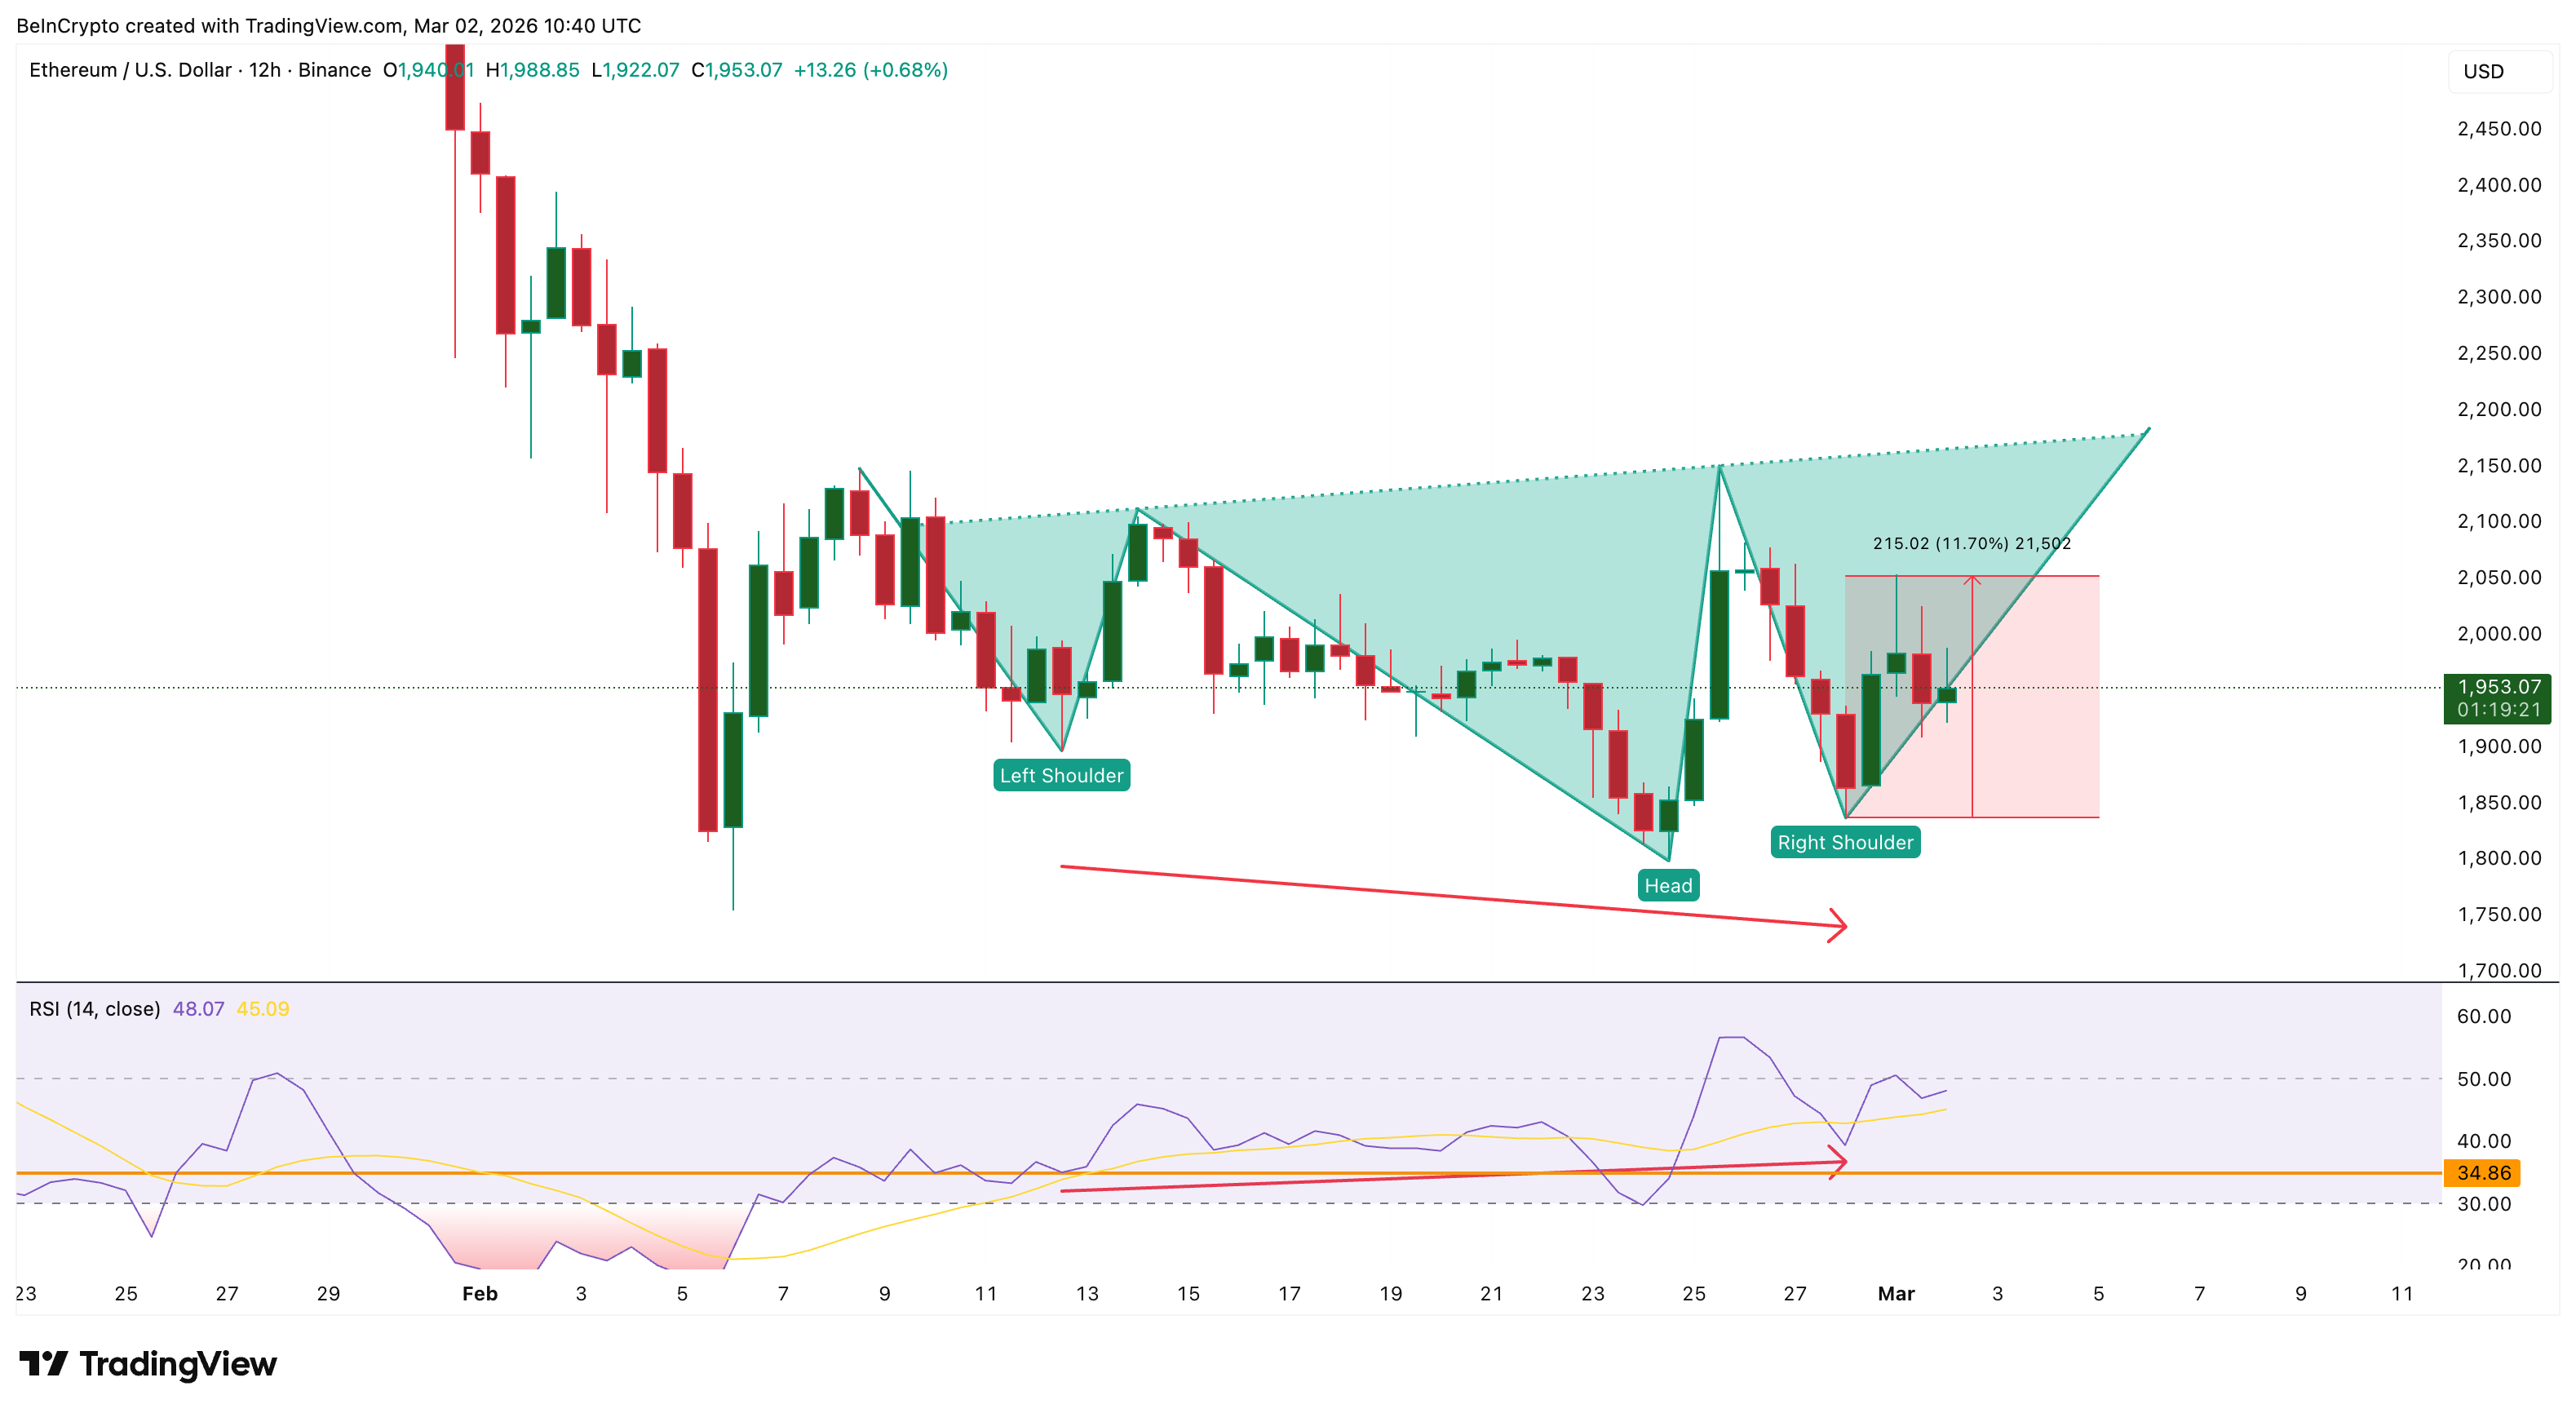
Between February 12 and February 28, the Ethereum price printed a lower low while the Relative Strength Index (RSI) — a momentum oscillator — printed a higher low. This forms a bullish divergence, a signal that selling momentum is weakening even as the price drops. That divergence has already triggered a bounce, with the Ethereum price rallying approximately 11.7% from the lows.
More importantly, this bounce is shaping an inverse head and shoulders pattern on the 12-hour chart; a bullish reversal structure. This is likely what hodlers are positioning for — a short-term breakout that could help them recover losses from the January trap. The technical setup is real, and the RSI divergence has already been validated by the initial bounce.
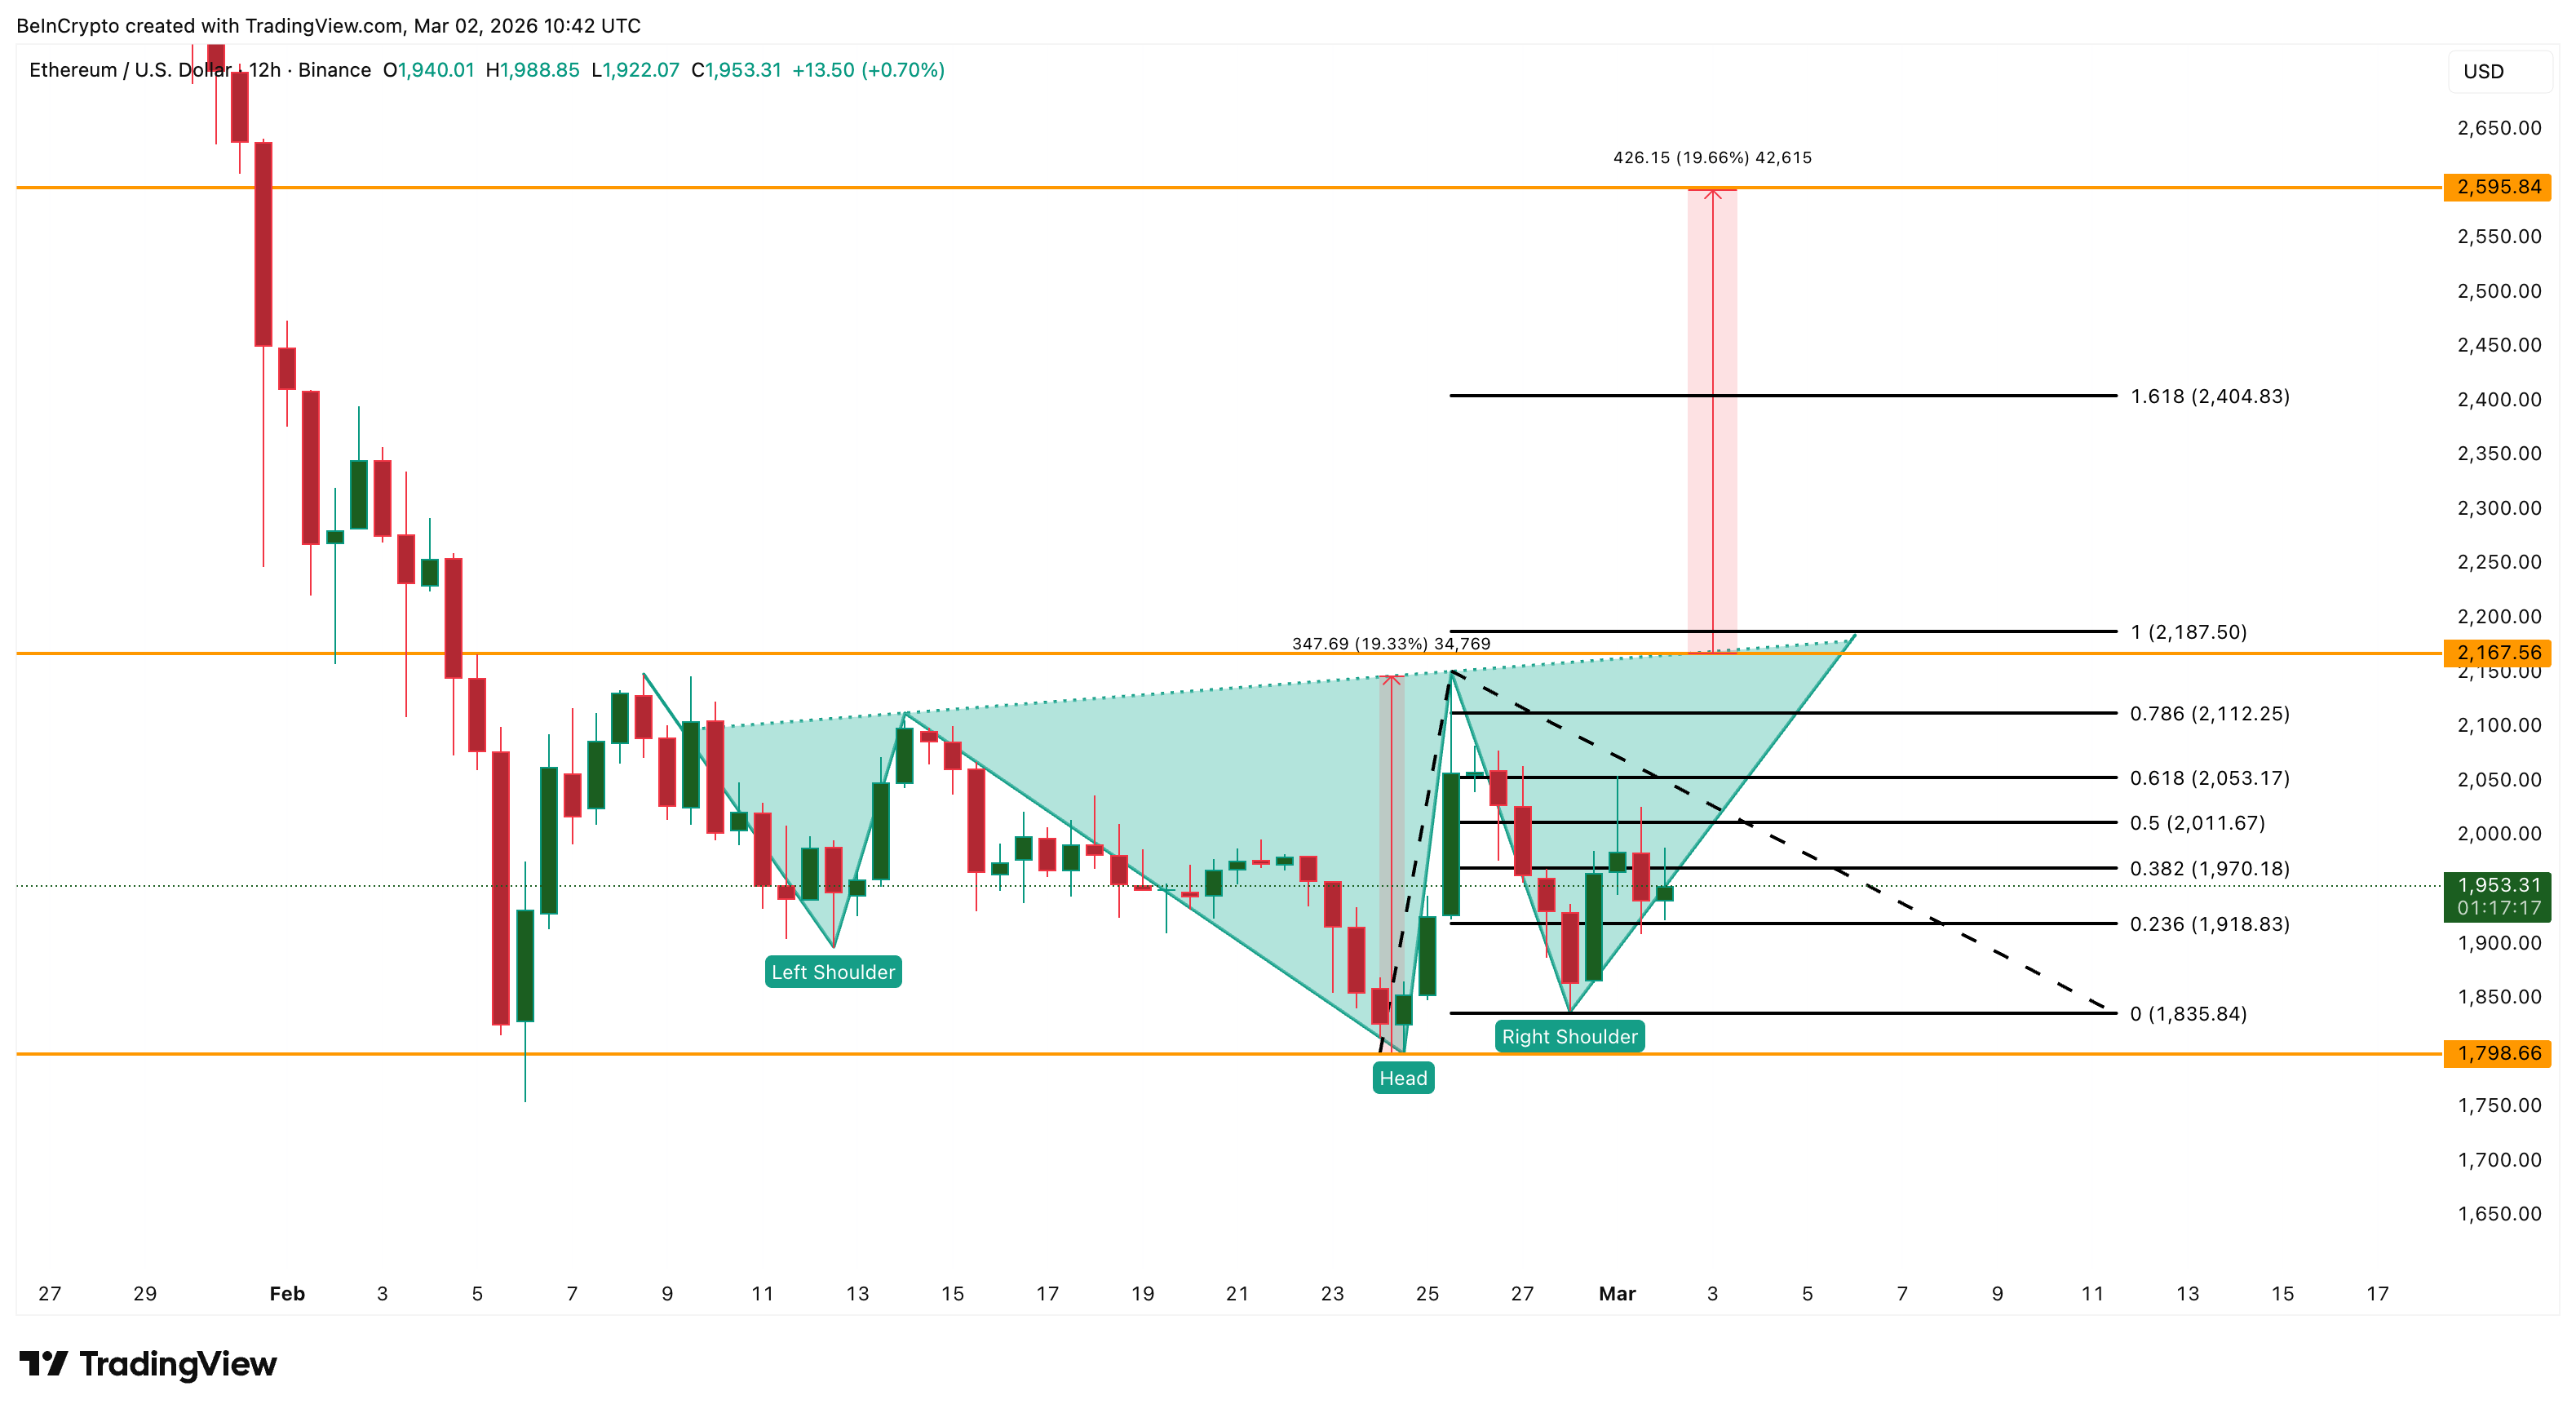
The neckline sits around $2,160–$2,180. If the Ethereum price closes above this level, the measured move projects a roughly 19% rally, targeting approximately $2,590. Before that, the Fibonacci extension levels at $2,050 and $2,400 would serve as intermediate resistance zones.
On the downside, a drop below $1,830 weakens the inverse head and shoulders. A close below $1,790 invalidates the bounce thesis entirely, and the weekly head and shoulders reasserts dominance — placing the $1,320 target back in focus.
The most probable path for March mirrors Bitcoin’s setup: a bounce attempt driven by the 12-hour structure and hodler accumulation, followed by renewed pressure as the weekly trend remains firmly bearish.
The bounce is real, but it is fighting against a much larger breakdown.
* The content presented above, whether from a third party or not, is considered as general advice only. This article should not be construed as containing investment advice, investment recommendations, an offer of or solicitation for any transactions in financial instruments.


