


Bitcoin price started a fresh decline below the $72,500 zone. BTC is consolidating and might continue to move down if it dips below $70,500.
Bitcoin failed to stay above $73,500 and extended losses.
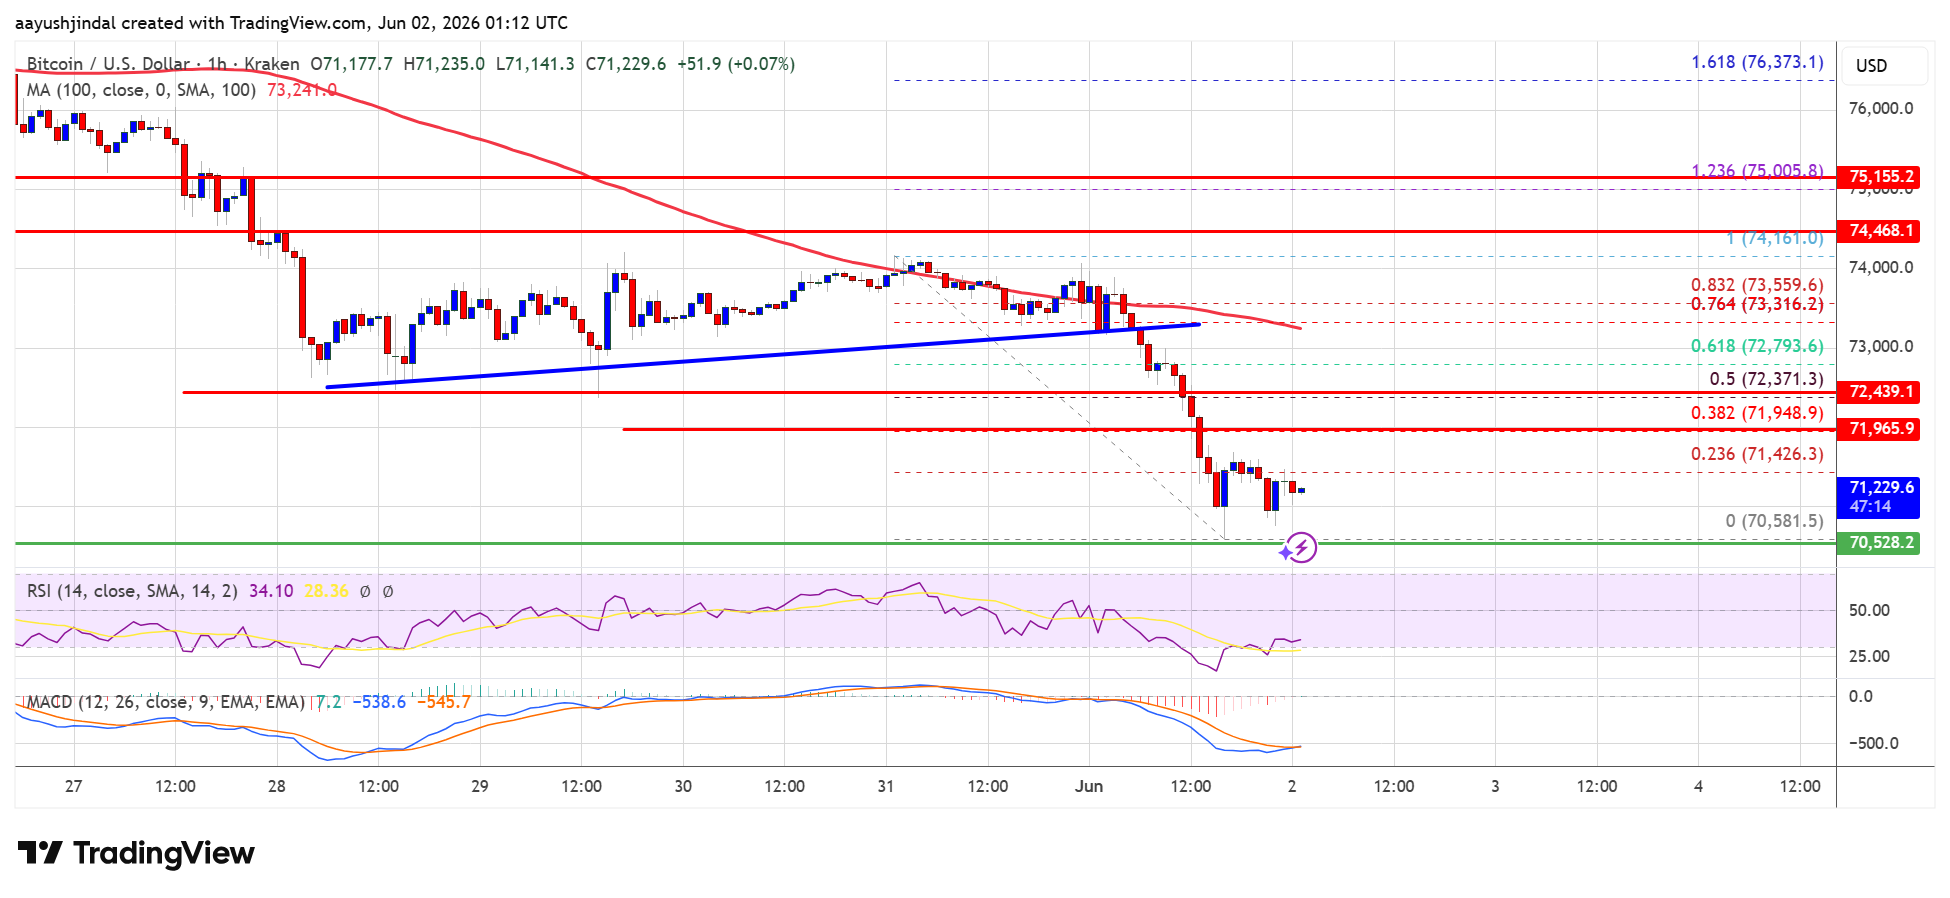
The price is trading below $72,500 and the 100 hourly simple moving average.
There was a break below a bullish trend line with support at $73,250 on the hourly chart of the BTC/USD pair (data feed from Kraken).
The pair might extend losses if it stays below the $72,500 and $73,500 levels.
Bitcoin Price Takes A Hit
Bitcoin price failed to stay above the $74,000 support zone. BTC remained in a bearish zone and extended losses below the $73,500 level. There was a move below the $73,000 level.
There was a break below a bullish trend line with support at $73,250 on the hourly chart of the BTC/USD pair. The price even dipped below $72,000. A low was formed at $70,581 and the price is now consolidating losses with a bearish angle below the 23.6% Fib retracement level of the downward move from the $74,161 swing high to the $70,581 low.
Bitcoin is now trading below $72,500 and the 100 hourly simple moving average. If the price remains stable above $70,000, it could attempt a fresh increase. Immediate resistance is near the $71,950 level. The first key resistance is near the $72,350 level and the 50% Fib retracement level of the downward move from the $74,161 swing high to the $70,581 low.
A close above the $72,350 resistance might send the price further higher. In the stated case, the price could rise and test the $73,500 resistance. Any more gains might send the price toward the $74,000 level. The next barrier for the bulls could be $75,000.
Downside Acceleration In BTC?
If Bitcoin fails to rise above the $72,500 resistance zone, it could start another decline. Immediate support is near the $71,200 level.
The first major support is near the $70,500 level. The next support is now near the $70,000 zone. Any more losses might send the price toward the $68,800 support in the near term. The main support now sits at $68,500, below which BTC might struggle to recover in the near term.
Technical indicators:
Hourly MACD – The MACD is now gaining pace in the bearish zone.
Hourly RSI (Relative Strength Index) – The RSI for BTC/USD is now below the 50 level.
Major Support Levels – $70,500, followed by $70,000.
Major Resistance Levels – $71,950 and $72,350.
 Don't Miss Today's Market Moves Start trading Forex, Gold & Crypto today Regulated platform | Fast withdrawals
* The content presented above, whether from a third party or not, is considered as general advice only. This article should not be construed as containing investment advice, investment recommendations, an offer of or solicitation for any transactions in financial instruments.


