


Bitcoin Price Eyes Fresh Upside, Traders Watch For Breakout Move


Bitcoin price started a recovery wave from the $73,650 zone. BTC is consolidating and might struggle to clear the $76,500 resistance zone.
Bitcoin managed to form a base above $74,000 and started a recovery wave.
The price is trading above $75,000 and the 100 hourly simple moving average.
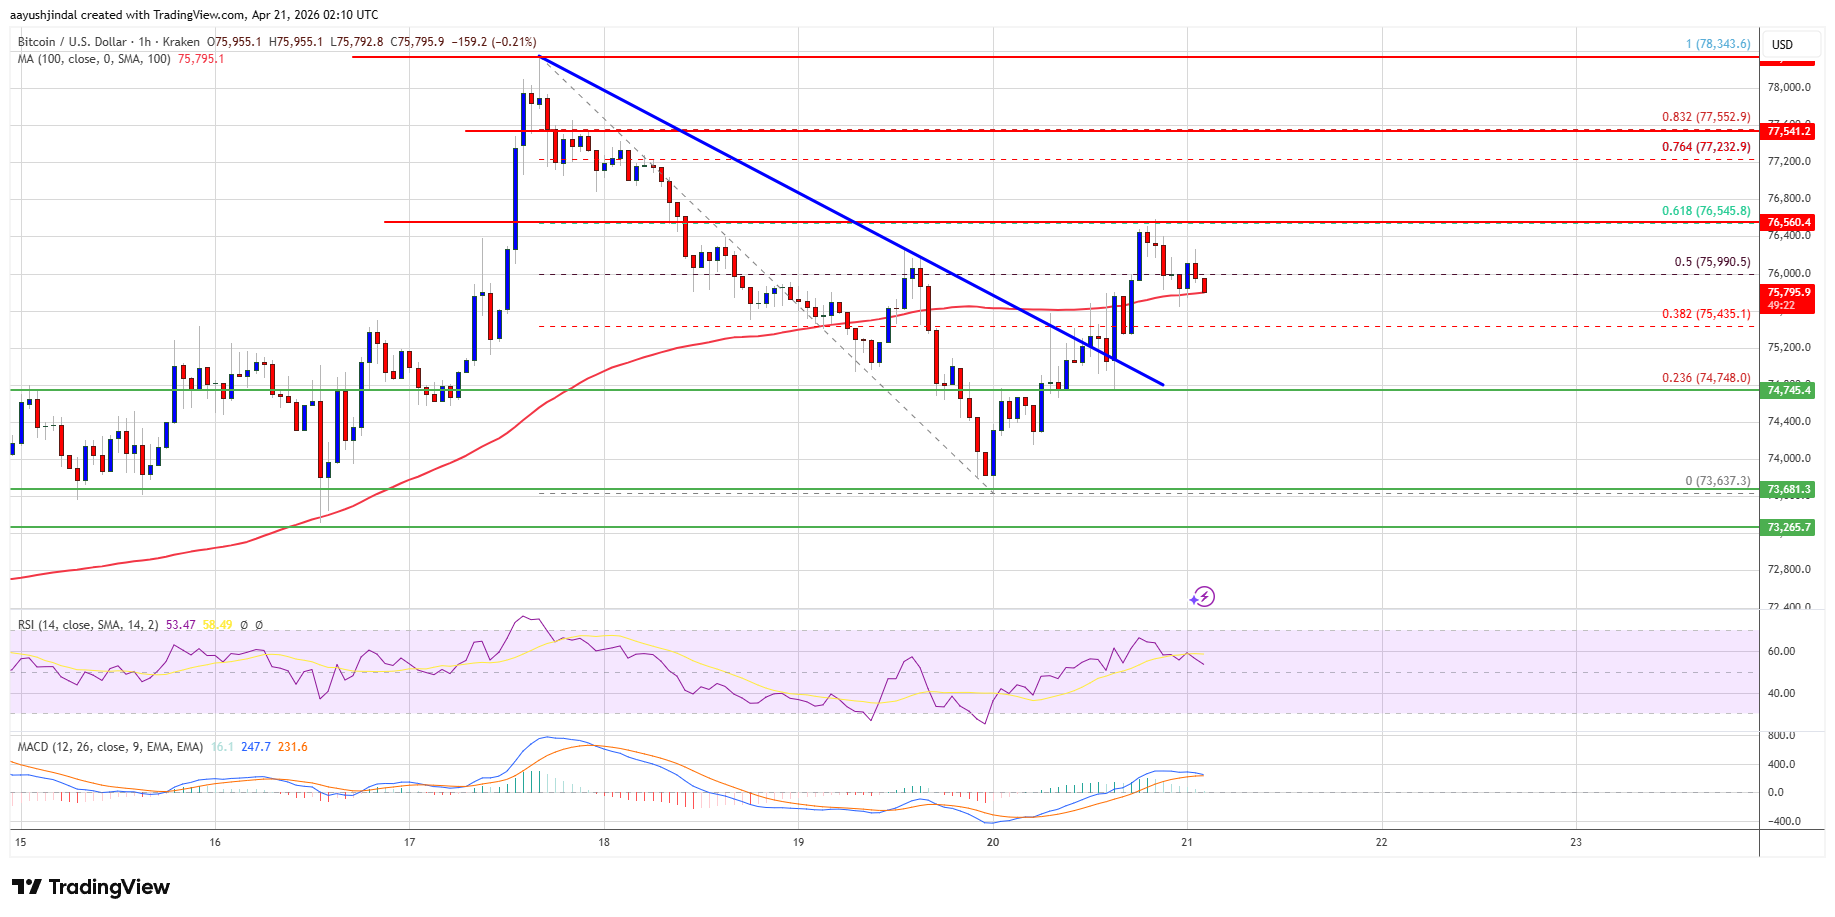
There was a break above a bearish trend line with resistance at $75,200 on the hourly chart of the BTC/USD pair (data feed from Kraken).
The pair might gain bullish momentum if it settles above the $76,500 zone.
Bitcoin Price Aims Higher
Bitcoin price extended losses below the $75,500 support zone. BTC even spiked below $74,000 before the bulls appeared. A low was formed at $73,637, and the price is now attempting to recover.
There was a move above the $74,500 and $75,000 levels. There was a break above a bearish trend line with resistance at $75,200 on the hourly chart of the BTC/USD pair. The pair even surpassed the 50% Fib retracement level of the downward move from the $78,344 swing high to the $73,637 low.
Bitcoin is now trading above $75,000 and the 100 hourly simple moving average. If the price remains stable above $75,000, it could attempt a fresh increase. Immediate resistance is near the $76,500 level and the 61.8% Fib retracement level of the downward move from the $78,344 swing high to the $73,637 low.
The first key resistance is near the $77,250 level. A close above the $77,250 resistance might send the price further higher. In the stated case, the price could rise and test the $78,000 resistance. Any more gains might send the price toward the $78,500 level. The next barrier for the bulls could be $80,000.
Another Decline In BTC?
If Bitcoin fails to rise above the $76,500 resistance zone, it could start another decline. Immediate support is near the $75,400 level.
The first major support is near the $75,000 level. The next support is now near the $74,250 zone. Any more losses might send the price toward the $73,650 support in the near term. The main support now sits at $72,000, below which BTC might struggle to recover in the near term.
Technical indicators:
Hourly MACD – The MACD is now losing pace in the bullish zone.
Hourly RSI (Relative Strength Index) – The RSI for BTC/USD is now moving lower toward the 50 level.
Major Support Levels – $75,000, followed by $74,250.
Major Resistance Levels – $76,500 and $77,250.
 Don't Miss Today's Market Moves Start trading Forex, Gold & Crypto today Regulated platform | Fast withdrawals
* The content presented above, whether from a third party or not, is considered as general advice only. This article should not be construed as containing investment advice, investment recommendations, an offer of or solicitation for any transactions in financial instruments.


