


Nasdaq 100 Pulls Back Nearly 20% From All-Time High: Historical Data Shows 80% Probability of Gains After 60 Trading Days
TradingKey - On November 20, Eastern Time, the Nasdaq 100 Index closed down 5.61% at 25,028.98 points. Based on the all-time closing high of 31,224.69 points set on October 6, the index fell to an intraday low of 24,910.48 points, with the drawdown once reaching 20.22%; on a closing basis, the drawdown widened from 15.08% the previous day to 19.84%.
Based on the closing-price metrics of this article's historical backtest, the 15% drawdown threshold was triggered on November 19. Historically, after the Nasdaq 100 Index first experienced a closing drawdown of more than 15%, performance was mixed in the first week; about one month later, most historical samples had recovered above their closing level on the trigger date; about three months later, the average gain expanded further. This time, the index continued to fall sharply on the trading day following the trigger, indicating that downside risks remain in the short term. More pronounced rebounds in historical samples typically occurred over the subsequent one to three months.
October Earnings Expose Profit Pressure as November Data Center Approval Worries Drag on Chip Stocks
Looking back at the factors behind the pullback in the Nasdaq 100 Index, Big Tech earnings first prompted investors to re-examine two questions: how fast core businesses can still grow, and how much AI expansion will actually cost. Taking Google parent Alphabet as an example, third-quarter Search and other revenue came in at $63.35 billion, falling short of market expectations of $64.895 billion. Meanwhile, the company maintained its full-year capital expenditure guidance and projected that spending would increase substantially further in 2027.
The Search business has long been a vital funding source for Google's AI investments. With Search revenue missing expectations while data center and chip spending continue to climb, the cash available for share repurchases or other purposes before new investments generate sufficient revenue may fall below investors' prior estimates. For a Nasdaq 100 heavyweight like Google, even if revenue continues to grow, valuation contraction will weigh on the index as long as earnings and cash flow prospects lag expectations.
Heading into November, the midterm elections added another layer of pressure to the AI supply chain. Certain governors-elect in states such as Texas had advocated pausing or tightening approvals for data center construction. The market feared not that cloud providers would immediately slash budgets, but rather that even with funding in place, permitting delays could stall data center buildouts, thereby pushing orders originally scheduled for delivery in the current quarter by suppliers of chips, optical transceivers, and power equipment to later dates.
This concern was particularly evident during trading on November 5: chip and data center-related stocks led the decline, and the Nasdaq 100 closed at 26,629.81, down 14.72% from its closing high on October 6. From the October earnings season to the post-election period, investors first worried that cloud providers were spending heavily with slow returns, and then began questioning whether upstream suppliers could realize their projected revenue on schedule.
By mid-November, Jensen Huang's departure heightened succession uncertainty at Nvidia, while the expansion of U.S. export licensing requirements for advanced chips added uncertainty to the delivery of certain overseas orders, both of which further limited the strength of the rebound in tech stocks.
Is Now a Good Time to Buy the Nasdaq 100?
Based on daily closing data since January 1986, the Nasdaq 100 has experienced 15 qualifying drawdown episodes. Each episode counts only the first trading day when the close fell more than 15% below its prior all-time closing high; a new count begins only after the previous peak is reclaimed.
Measured from the closing date of the initial >15% drawdown | Advances / Sample Size | Percentage of Advances | Average Cumulative Return | Median Cumulative Return |
Held for 5 trading days | 8/15 | 53.30% | -0.73% | 2.96% |
Held for 20 trading days | 12/15 | 80.00% | 3.46% | 3.41% |
Held for 60 trading days | 12/15 | 80.00% | 9.53% | 7.64% |
In the short term, a decline of more than 15% did not confer an obvious rebound advantage. Over the subsequent 5 trading days, the index advanced only 8 times, a success rate slightly below the 57.7% calculated from ordinary trading days. While the median return in the first week was positive, a few sharp plunges were enough to drag the average return down to -0.73%.
When the holding period is extended to 60 trading days, the index advanced in 12 of the 15 instances, posting a median return of 7.64%, higher than the 4.47% calculated from ordinary trading days. However, ending the period with a gain does not mean the index did not continue to decline along the way: after triggering in March 2020, the index dropped as much as an additional 12% from the trigger date's close at one point, yet was up 22.10% by the 60th trading day; after triggering in April 2000, the index plunged as much as an additional 24.38% at one point and was still down 5.12% by the 60th trading day.
For the current market cycle, 15% is better suited as a historical reference for assessing medium-term returns rather than as a price level for identifying a short-term bottom. Across the past 15 episodes, 4 saw the index drop by more than an additional 10% within 60 trading days after being triggered; even if investors ultimately caught the rebound, they may first have had to endure a period of significant losses.
Nasdaq 100 Index Technical Analysis
From a technical perspective, the Nasdaq 100 Index has hit a new recent low, currently falling below the 0.618 Fibonacci retracement level (26,096.04 points) and approaching the 25,000-point mark, with the trend shifting from repeatedly testing previous lows to expanding downward.
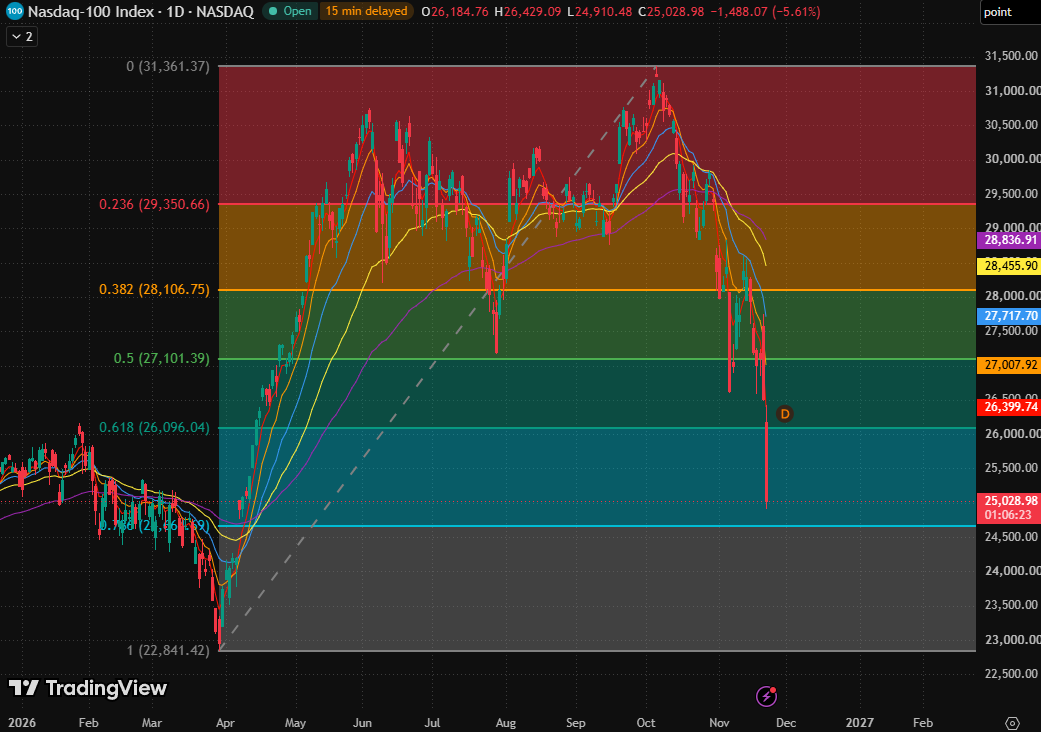
Nasdaq 100 Index, Source: TradingView
In terms of moving averages, the 5-day, 10-day, 20-day, 80-day, and 160-day exponential moving averages are all sloping downward. The index sits below all five moving averages, which maintain a complete bearish alignment, pointing to consistent weakness across both the short and medium term.
In terms of rebound space, overhead resistance first lies at the 0.618 Fibonacci retracement level (26,096.04 points), followed by the 26,399.74–26,429.09 area adjacent to the 5-day exponential moving average and the day's high. A more major resistance zone is 27,007.92–27,101.39, formed by the 10-day exponential moving average and the 0.5 Fibonacci retracement level.
The downside risk is that if the index breaks below this intraday low, it may fail to find support even near the 0.786 Fibonacci retracement level. In that case, the pullback would enter the final leg of the original upward wave, with the spring low (22,841.42 points) serving as a structural reference further below.
Recommended Articles


