

NEAR Protocol Price Forecast: NEAR rally stalls below $6 amid firm ETF inflows

Source Fxstreet
  • NEAR Protocol ticks lower on Monday after rallying around 30% over the past three days.
  • Bitwise’s NEAR-focused ETFs recorded over $13 million in total inflows last week, signaling persistent institutional demand.
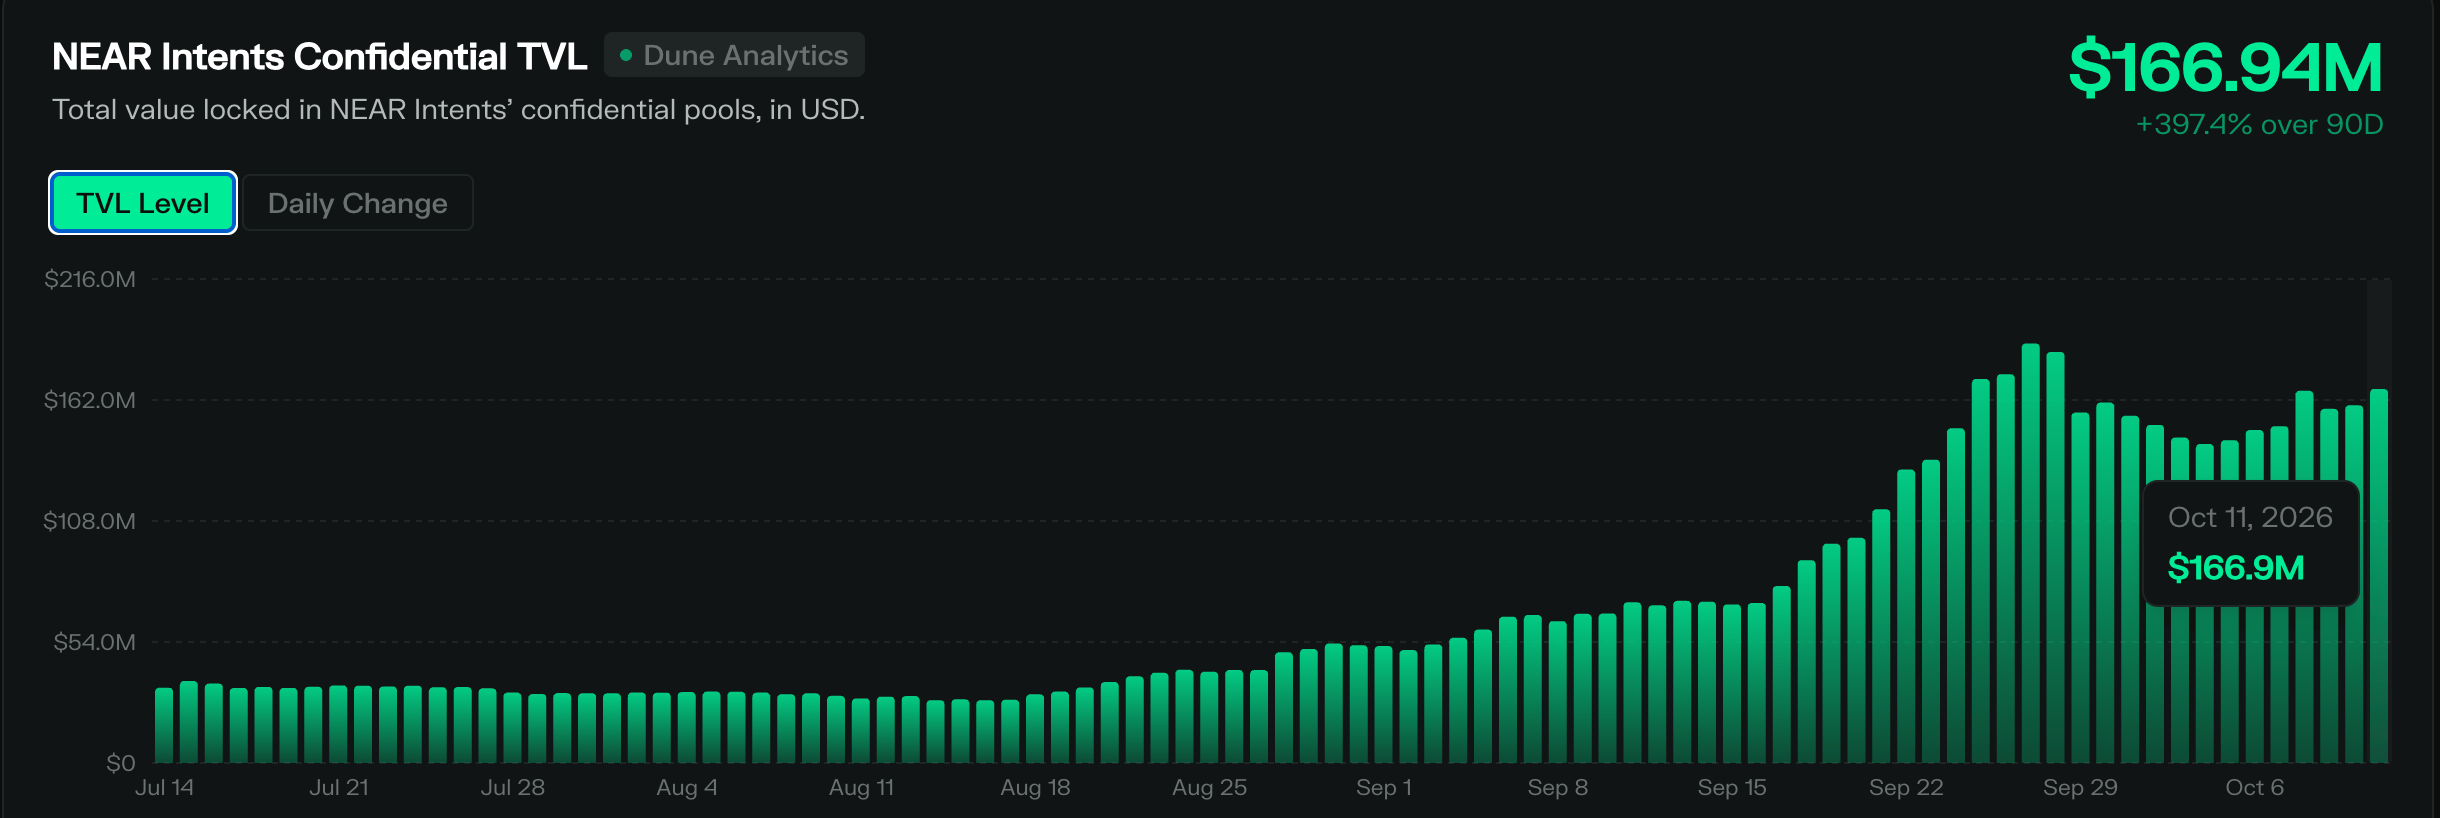
  • NEAR intents confidential TVL rose to $166.9 million on Sunday, the highest level so far this month, suggesting renewed user demand.

NEAR Protocol (NEAR) is down 3% at press time on Monday, ticking lower after rallying 30% over the last three days as buying pressure eases. The recovery aligns with Bitwise’s NEAR-focused Exchange Traded Fund (ETF) recording its second weekly inflow of over $13 million last week, while NEAR intents confidential TVL rose to $166.9 million on Sunday. The technical outlook for NEAR remains bullish, as upside momentum persists.

NEAR gains institutional and retail demand

Bitwise’s NEAR-focused ETF (NRR) recorded its second consecutive weekly inflow of $13.05 million, down from $58.35 million in the previous week, suggesting persistent institutional demand for the Layer-1 token. 

On the other hand, NEAR’s star product, Intents, a cross-chain transaction and liquidity protocol, is attracting user demand. NEAR Protocol’s official revenue dashboard shows the Total Value Locked (TVL) in confidential intents rose to $166.9 million on Sunday, reaching its highest level so far this month, marginally below its all-time low of $187.3 million on September 27. This recovery in TVL indicates renewed demand for privacy-focused features of NEAR intents. 

Taken together, the steady ETF inflows and growing TVL of NEAR intents position the Layer-1 token for further upside.
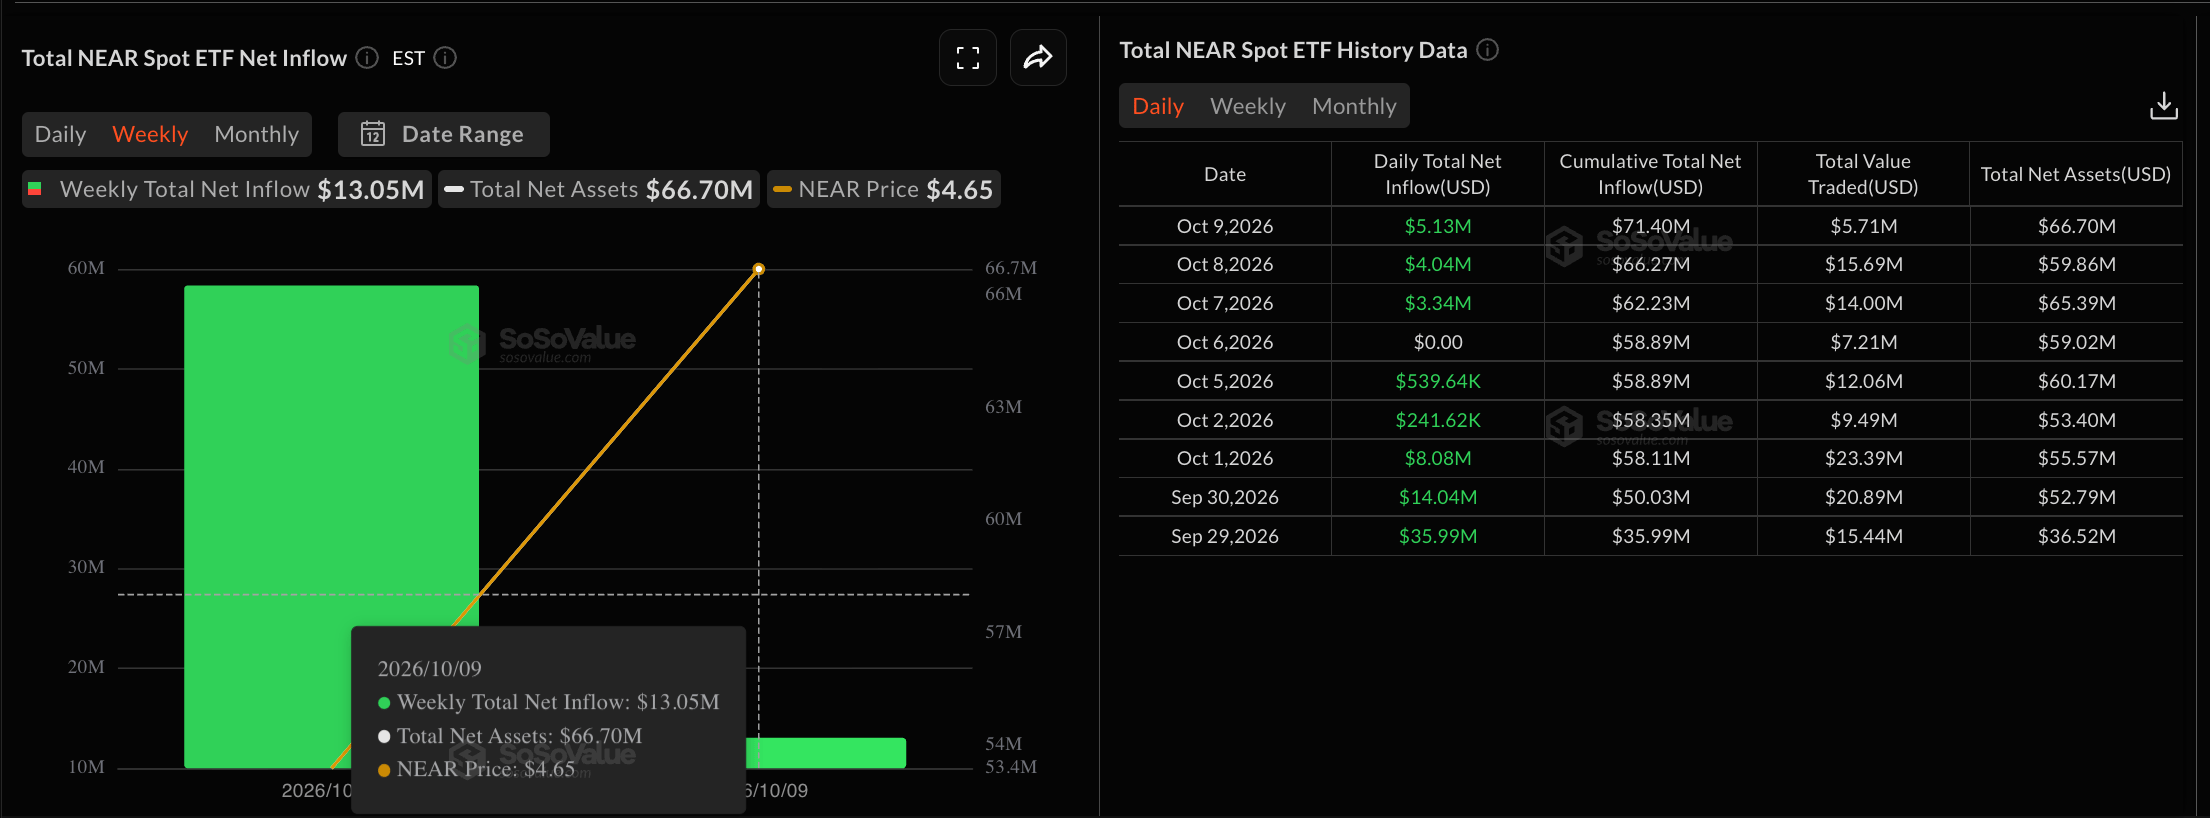
NEAR ETFs data. Source: Sosovalue
NEAR Intents confidential TVL. Source: NEAR revenue dashboard

Technical outlook: Will NEAR rally regain strength to surpass $6?

NEAR Protocol edges lower to $5.7030 at press time on Monday, down from the high of $6.0000 earlier on the day. NEAR token maintains a constructive bullish bias as price holds well above both the 50-period Exponential Moving Average (EMA) on the four-hour chart at $5.1901 and the 200-period EMA at $4.2899.

Momentum is holding bullish on the four-hour chart, with the Relative Strength Index (RSI) around 61 and the Moving Average Convergence Divergence (MACD) rising above its signal line, suggesting that buyers retain control, even if upside momentum is no longer accelerating.

From a technical perspective, the 127.2% Fibonacci extension level, measured from $5.5780 to $4.3010, at $5.9253, capped gains earlier on the day. A confirmed breakout above this level could target the 161.8% extension level at $6.3671.

Chart Analysis NEAR/USDT (Binance)
NEAR/USDT four-hour price chart.

On the downside, initial support is seen at the reclaimed $5.5780 Fibonacci anchor, followed by a minor cushion around the 50-period EMA at $5.1901. Any deeper pullback could expose the 50% retracement at $4.9395.

(The technical analysis of this story was written with the help of an AI tool. Know more.)

Disclaimer: For information purposes only. Past performance is not indicative of future results.
placeholder
Will the Tech Rally Continue? The Technical Verdict on the NASDAQ 100 Riding a massive 32% post-earnings wave, the Nasdaq-100 is showing its first signs of exhaustion. We break down crucial exit and entry rules for long positions this week.
Author  Mitrade Team
Jun 05, Fri
Riding a massive 32% post-earnings wave, the Nasdaq-100 is showing its first signs of exhaustion. We break down crucial exit and entry rules for long positions this week.
placeholder
XRP Price Prediction for July 2026: Can Buyers Finally Break the Downtrend?XRP (XRP) price trades near $1.05, caught between a year-long downtrend and a sudden burst of buying.July has historically rewarded XRP holders. This year the month arrives with on-chain accumulation
Author  Beincrypto
Jun 30, Tue
XRP (XRP) price trades near $1.05, caught between a year-long downtrend and a sudden burst of buying.July has historically rewarded XRP holders. This year the month arrives with on-chain accumulation
placeholder
XAUUSD Gold Analysis: Gold Holds Above $4,350 Ahead of US Inflation Data Is $4,500 Next? Gold holds above $4,350 following weak US jobs data. As inflation reports approach and UBS eyes $5,000, can XAUUSD break resistance at $4,435 to rally toward $4,500?
Author  Naoufal Seddik
Aug 12, Wed
Gold holds above $4,350 following weak US jobs data. As inflation reports approach and UBS eyes $5,000, can XAUUSD break resistance at $4,435 to rally toward $4,500?
placeholder
Gold Price Analysis Today: Gold Drops 1.32% Despite Lower Fed Rate-Hike Bets, Can $4,313 Support Hold? Gold fell 1.32% on August 13 after rising to $4,449.73, then reversing lower and closing near $4,349.918 below the $4,356.46 support. Softer US inflation data reduced Fed rate hike expectations, but selling pressure still dominated the session. Will $4,313 support hold?
Author  Naoufal Seddik
Aug 14, Fri
Gold fell 1.32% on August 13 after rising to $4,449.73, then reversing lower and closing near $4,349.918 below the $4,356.46 support. Softer US inflation data reduced Fed rate hike expectations, but selling pressure still dominated the session. Will $4,313 support hold?
placeholder
Gold Price Analysis Today: Gold Gains 0.94% as Markets Expect Fed to Hold Rates, Can $4,449 Resistance Break? Gold gained 0.94% on August 17, closing near $4,417.30 as softer US data strengthened expectations for unchanged Fed rates in September. Gold remains bullish, with $4,449.730 resistance and $4,310.650 support in focus.
Author  Naoufal Seddik
Aug 18, Tue
Gold gained 0.94% on August 17, closing near $4,417.30 as softer US data strengthened expectations for unchanged Fed rates in September. Gold remains bullish, with $4,449.730 resistance and $4,310.650 support in focus.
goTop
quote