


Ripple and Stellar outlook: XRP and XLM test key support amid rising downside risks
- XRP nears the key support zone on Thursday after three consecutive days of losses, nearly 7% this week.
- XLM trades near the key 50-day EMA at $0.199, failure to hold this zone could lead to a deeper correction.
- Weakening derivatives metrics, a hawkish Fed, elevated US Treasury yields, and rising geopolitical risks continue to weigh on both altcoins.
Ripple (XRP) and Stellar (XLM) remain under pressure and extend their corrections on Thursday as weakening derivatives metrics and broader macroeconomic headwinds weigh on sentiment. XRP and XLM approach a key support zone after three consecutive days of losses so far this week. Both altcoins now face critical technical levels that could determine whether the correction deepens or a recovery takes shape.
Weakening derivatives positioning among traders
Derivatives data shows weakening conditions. CoinGlass’ long-to-short ratio for Ripple read 0.96 on Thursday. A ratio below one indicates bearish sentiment, as traders bet that asset prices will fall.
Meanwhile, XLM’s ratio read 1.09 that day. A ratio above one indicates bullish sentiment, as traders bet that asset prices will rise.
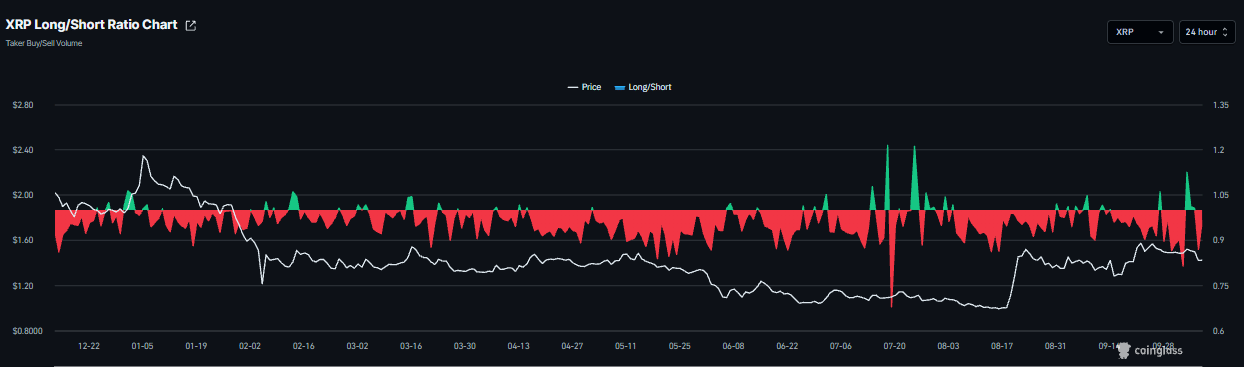
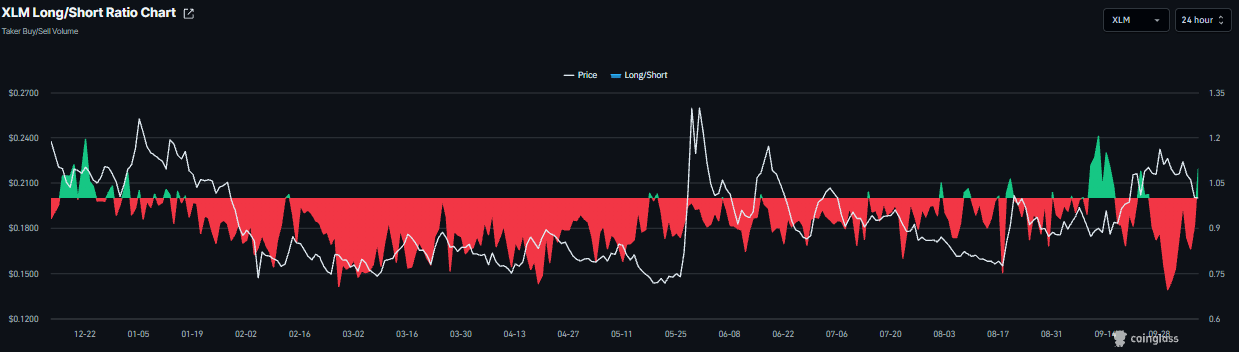
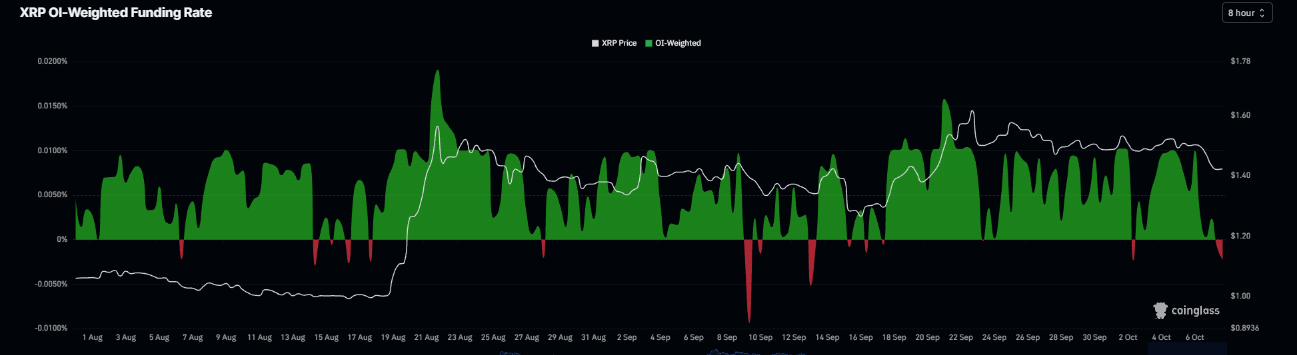
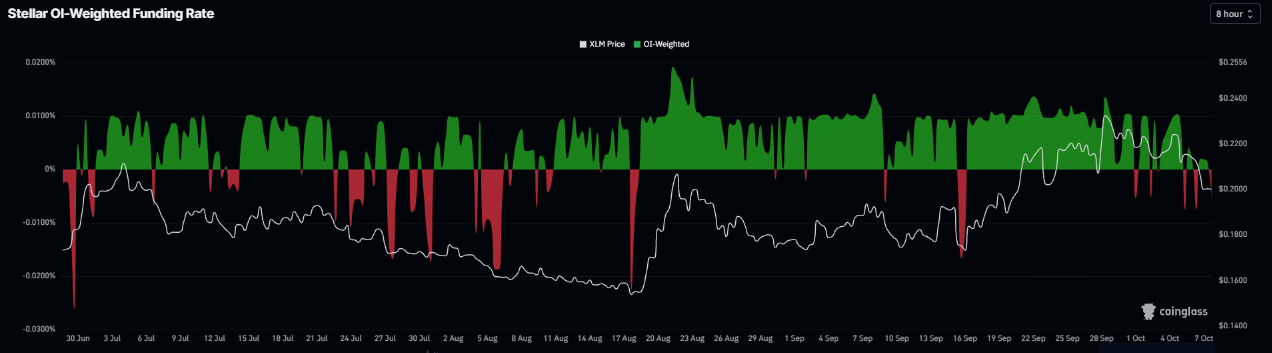
In addition, the XRP and XLM funding rates flipped negative on Wednesday, reading -0.0022% and -0.0060% respectively on Thursday. These negative rates indicate shorts are paying longs, indicating a bearish outlook.
Hawkish Fed and soaring yields cap upside
On the macroeconomics front, a stronger US Dollar (USD) and soaring 10-year US Treasury yield further cap the upside momentum for Ripple and Stellar.
The US Dollar Index (DXY) reached an intraday high of $102.53 on Monday, reaching levels not seen since early April 2025 and stabilized around $102.24 on Thursday. Similarly, the 10-year US Treasury yield rose and posted a fresh two-decade high near 5.35% on Monday, now holding strong around 5.30%. These higher yields make traditional fixed-income assets more attractive than risky assets such as XRP and XLM.
Moreover, Minutes of the September 15-16 Federal Open Market Committee (FOMC) meeting revealed that the committee voted unanimously to raise the Federal Funds Rate target range. Most officials expect that another rate increase would likely be appropriate by year-end to combat persistent inflation, further supporting US bond yields and the USD, which caps cryptos.
Elevated geopolitical risks
On the geopolitical front, the Pentagon reportedly told US Central Command (CENTCOM) several days ago to conclude preparations for resuming major combat operations in Iran as US President Donald Trump weighs a specific date for launching strikes.
The US and Israeli sources said that US attacks could happen before the US midterm elections and possibly the Israeli elections a week earlier. This, in turn, could continue to benefit the safe-haven USD, dampen risk appetite and weigh on Ripple and Stellar.
XRP technical outlook: Slides to key support
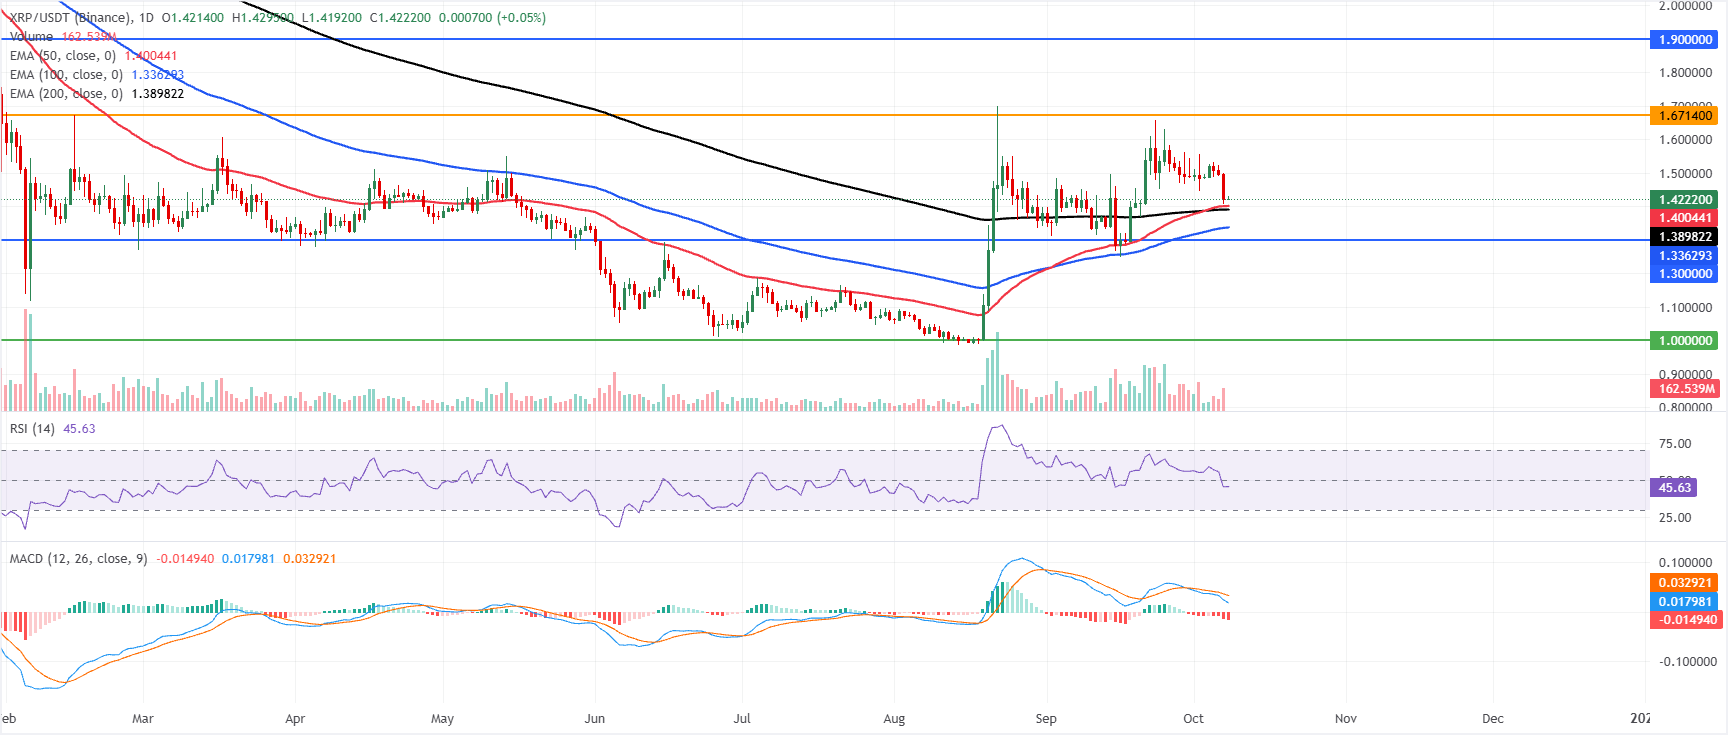
XRP price trades at $1.422 on Thursday after correcting over 6% so far this week. Despite the correction, XRP is holding above the 50-day Exponential Moving Average (EMA) at $1.400 as well as the 100-day EMA at $1.336 and the 200-day EMA at $1.389, which collectively underpin a constructive near-term bias.
Despite this supportive positioning, momentum is soft, with the Relative Strength Index (RSI) hovering near 45 and the Moving Average Convergence Divergence (MACD) below zero, hinting that bullish follow-through may be tentative until fresh buying interest emerges.
On the downside, initial support is seen at the 50-day EMA around $1.400, followed by the 200-day EMA at $1.389 and the 100-day EMA at $1.336, while a deeper slide would bring the horizontal floor at $1.300 into focus ahead of the more distant $1.000 level.
On the topside, XRP faces its first notable resistance at the horizontal barrier near $1.671, with a sustained break exposing the next upside objective at $1.900.
XLM technical outlook: Momentum softens
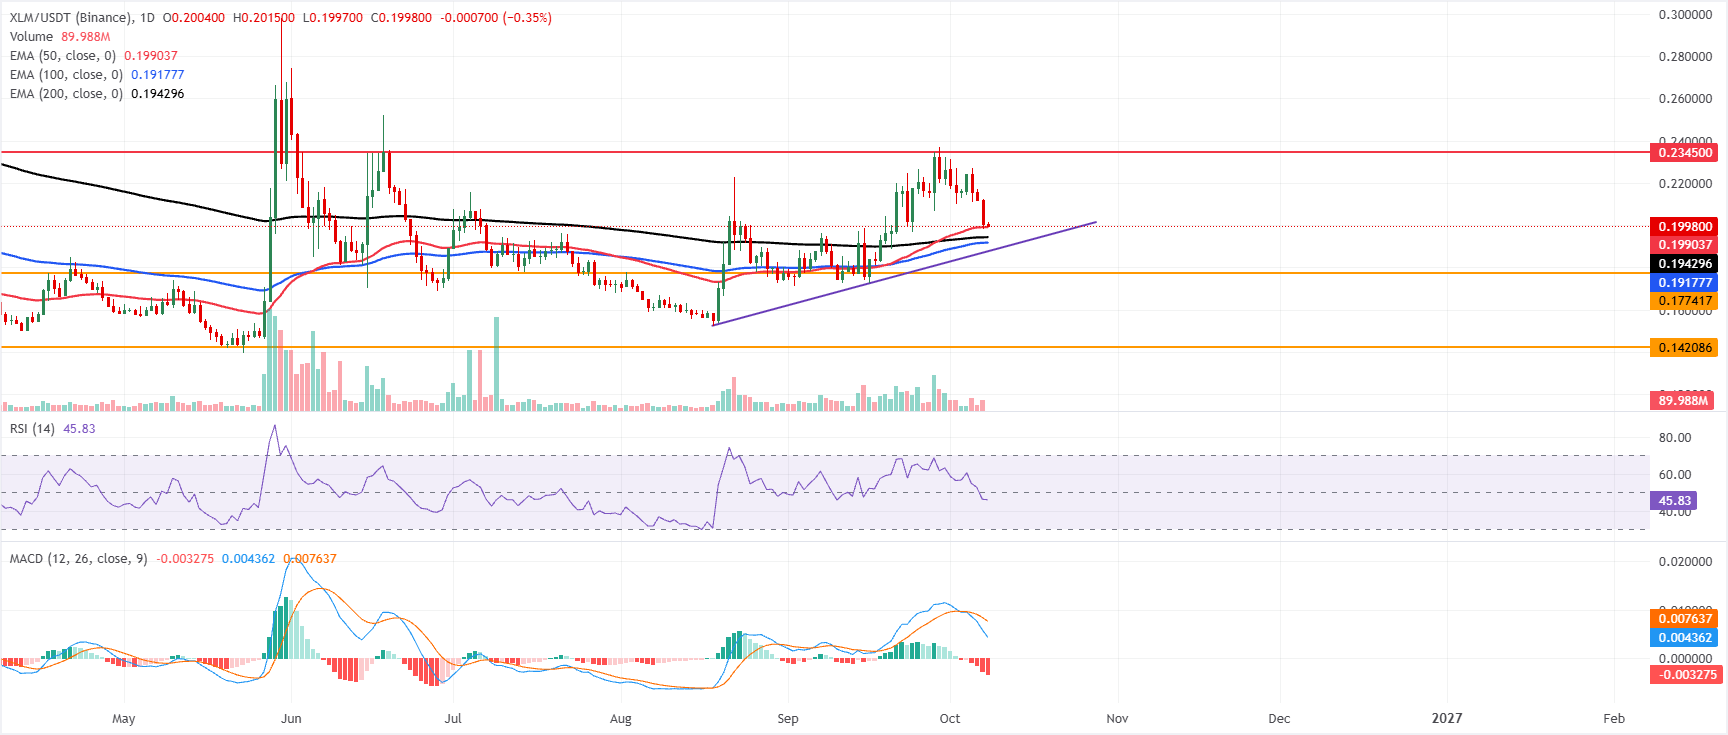
XLM price trades at $0.199 on Thursday after losing over 9% so far this week. XLM nears the key 50-day, 100-day, and 200-day EMAs clustered between $0.191 and $0.199, suggesting a constructive near-term bias despite the latest pullback from recent highs.
However, momentum has softened, with the RSI drifting toward the mid-40s and the MACD slipping further into negative territory, hinting that bulls may need to consolidate before attempting another leg higher.
On the downside, immediate support is at the 50-day EMA at $0.199, followed by the 200-day EMA at $0.194 and the 100-day EMA at $0.191, while a deeper setback would expose the prior trendline break area near $0.187 and the horizontal floors at $0.177 and $0.142.
On the topside, the next significant hurdle aligns at the horizontal resistance zone around $0.234, and only a sustained break above this level would reopen the path toward the recent advance and reinforce the broader bullish structure.
(The technical analysis of this story was written with the help of an AI tool. Know more.)
Recommended Articles


