


Polygon Price Forecast: POL extends decline as shutdown rumors fuel panic selling
- Polygon is down nearly 5% on Wednesday, extending a steady decline so far this week.
- Polygon's post joking about its own death to competitors lands as a shutdown rumor, fueling selling pressure.
- Derivatives data shows a 13% decline in Open Interest as funding rates drop to -0.0071%, suggesting a sell-side bias.
Polygon (POL) is down nearly 5% on Wednesday, amid selling pressure linked to rumors of a network shutdown sparked by a social media post. Derivatives data shows a sell-side dominance as Open Interest declines 13% over the last 24 hours while funding rates flip negative. The technical outlook for POL indicates downside risk, with building pressure at the 200-day Exponential Moving Average (EMA) and a rising trendline support cluster near the $0.1000 psychological threshold.
Shutdown rumor spreads fear in POL futures
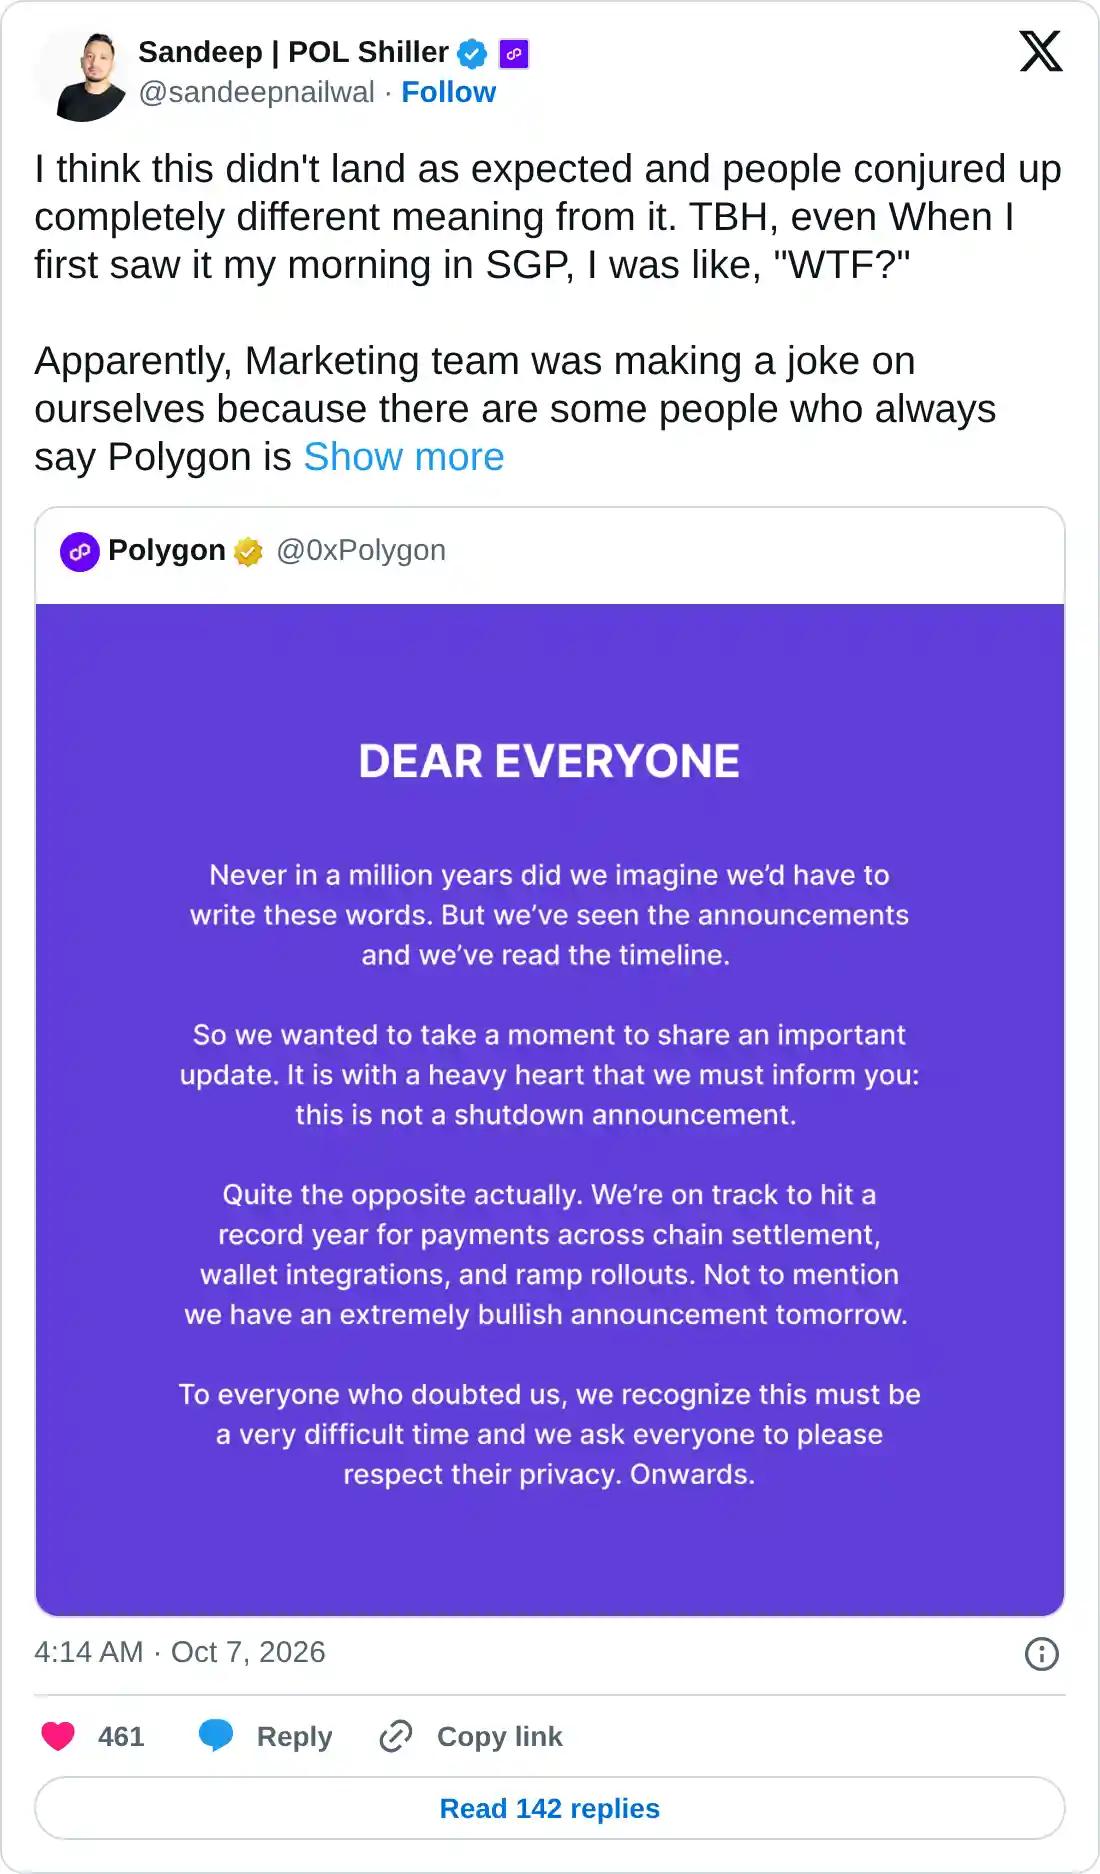
Polygon's official handle on X shared an announcement of its own death as a joke, which also mentioned a record year for payments across chain settlement, wallet integration, and ramp rollouts. However, the self-deprecating humor failed to land and spread rumors of a shutdown among investors, prompting Polygon’s CEO, Sandeep Nailwal, to address them in an X post on Wednesday.
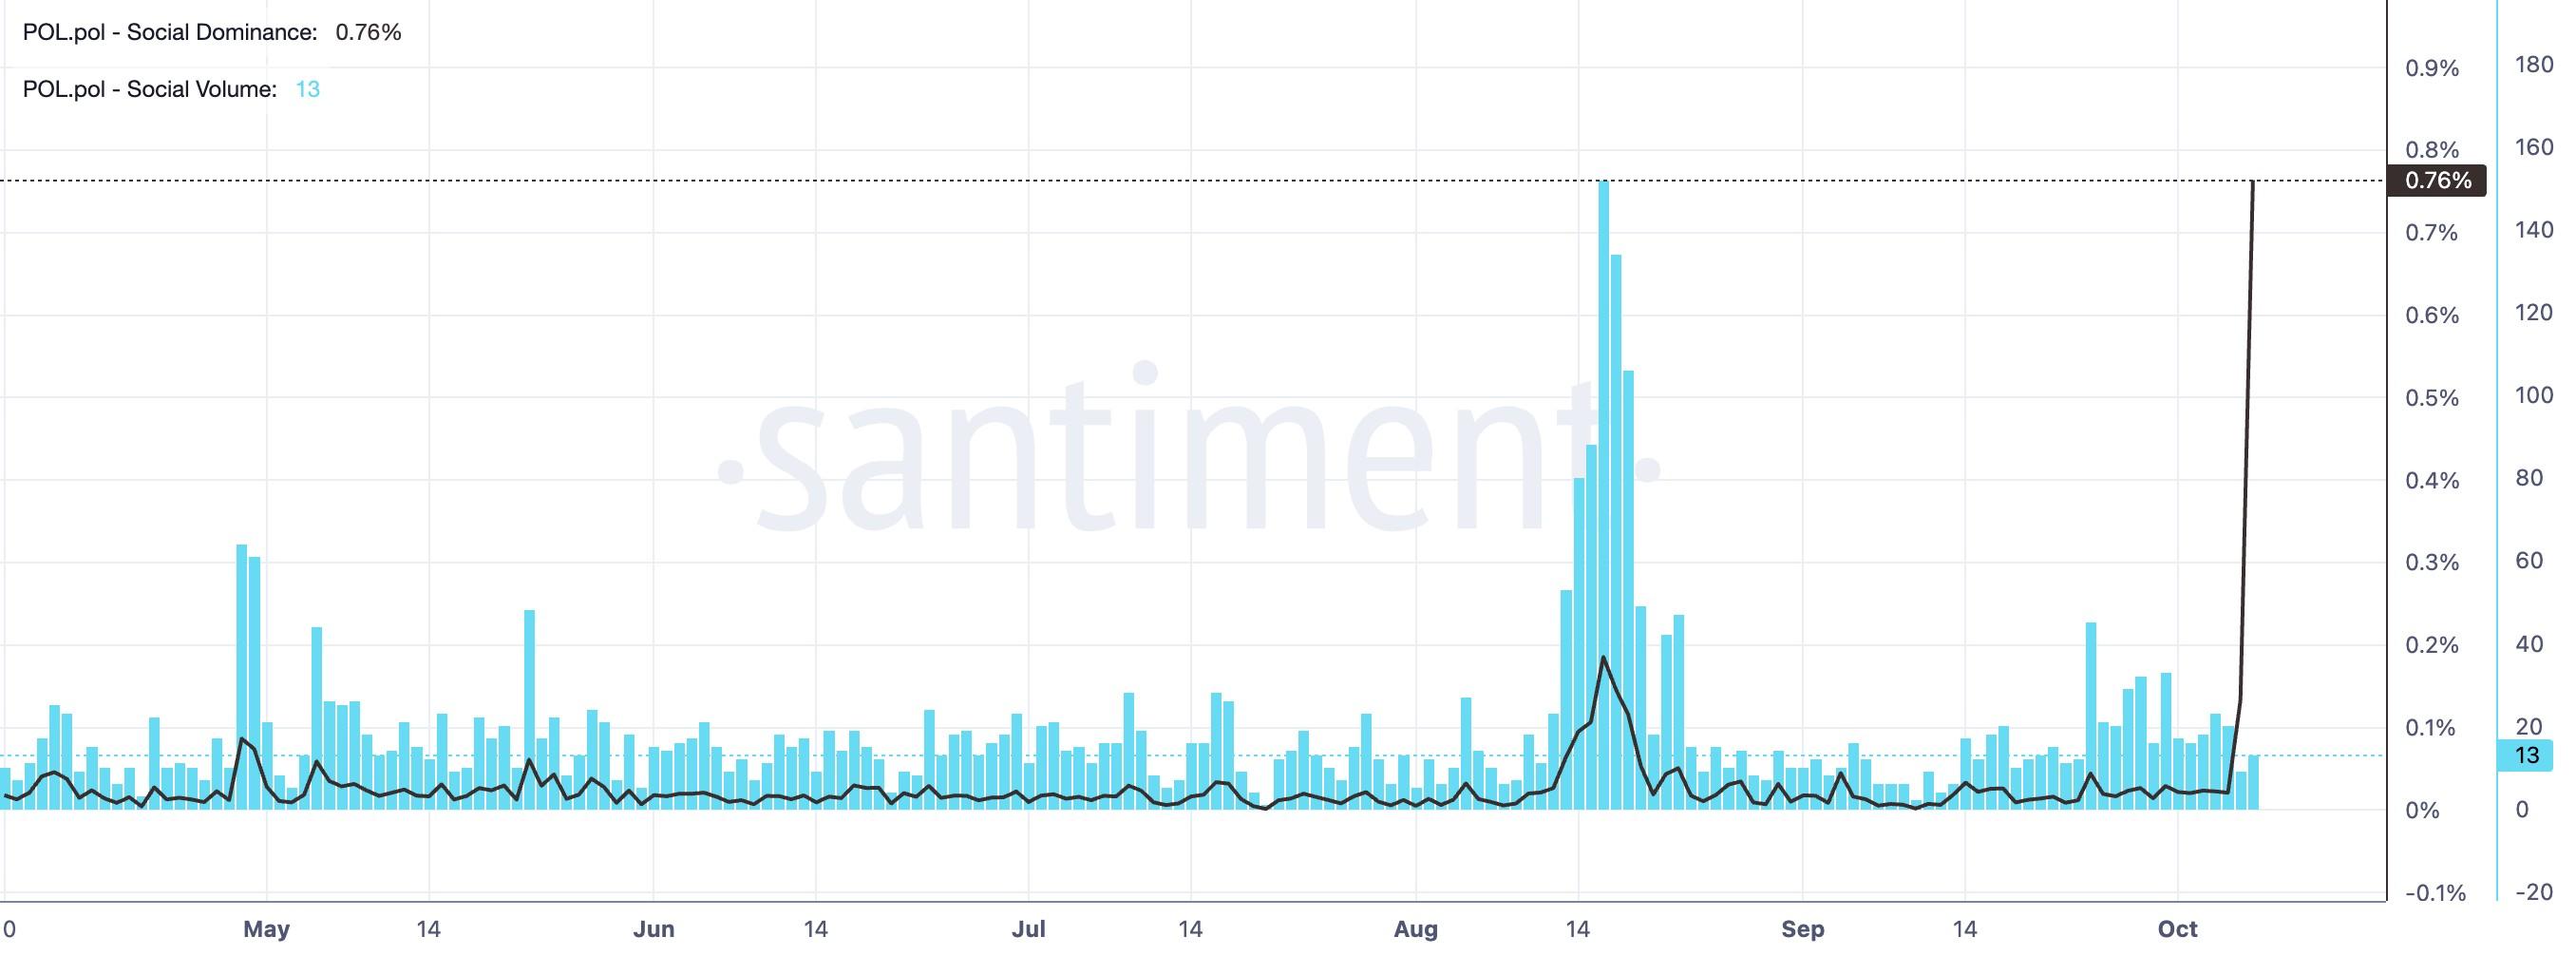
Santiment data shows that Polygon's social dominance score reached a high of 0.76%, suggesting a boost in social buzz around the token, driven by the recent rumors.
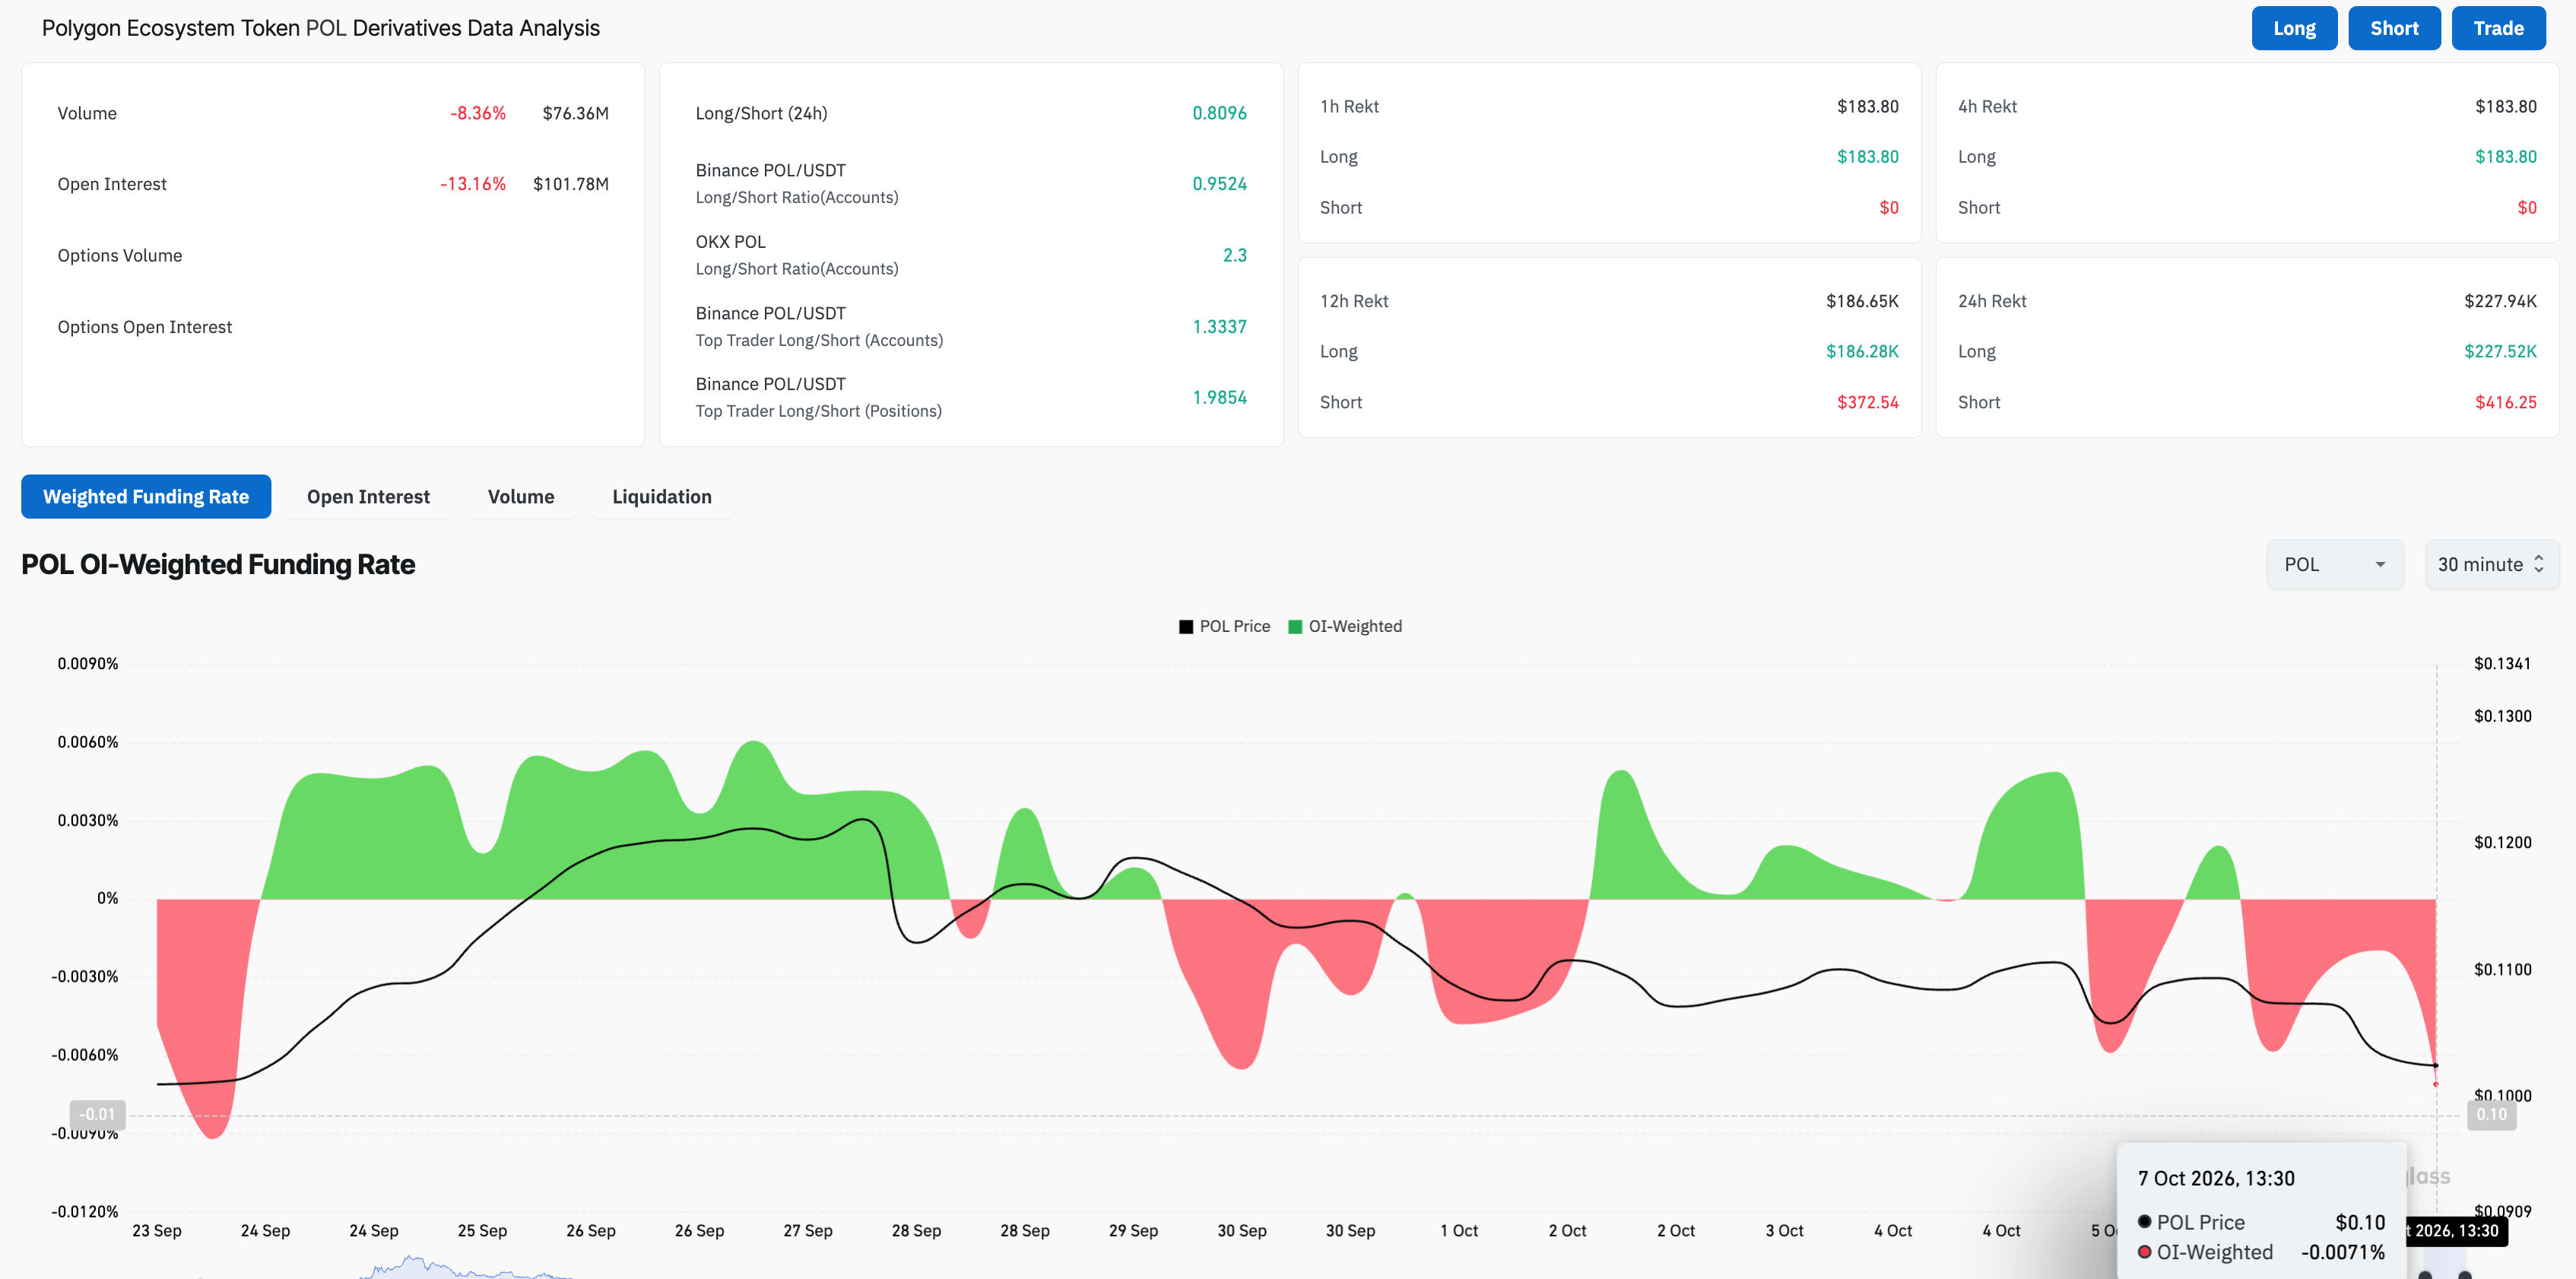
On the retail side, Polygon is facing a bearish buildup in the derivatives market. CoinGlass data shows the POL futures Open Interest (OI) at $101.78 million on Wednesday, down about 13% over the last 24 hours. At the same time, the funding rates have dropped to -0.0071%, from -0.0020% the previous day, suggesting that traders are more willing to buy short positions at a premium, as they anticipate further downside.
Technical outlook: Will POL price extend its decline below $0.10?
Polygon trades around $0.1024 at press time on Wednesday, maintaining a near-term bearish tone. The POL token extends a steady decline from the $0.1237 resistance level set by the January 26 high, which capped gains last week.
At the time of writing, Polygon is down 5%, testing the 50-day EMA at $0.1020, while the 100- and 200-day EMAs at $0.09602 and $0.09927, respectively, at lower levels, reinforce a medium-term recovery tone. In addition, a rising support trendline, connecting the August 20 and September 16 lows, near the $0.1000 psychological level, reinforces the support barrier.
A confirmed breakout below the 200-day EMA and the support trendline near the $0.1000 level could signal a steeper correction toward the 100-day EMA at $0.09602. Any deeper pullback could target the August 31 low at $0.08634, where buyers could show dip-buying interest.
Momentum remains bearish on the daily chart, with the Moving Average Convergence Divergence (MACD) line falling below its signal line as negative histograms expand. At the same time, the Relative Strength Index (RSI) at 44 drops below the midline, with further room before reaching oversold conditions.
On the upside, a potential rebound off the 50-day EMA at $0.1020 could attempt another bullish breakout above the $0.1237 resistance level.
(The technical analysis of this story was written with the help of an AI tool. Know more.)
Recommended Articles


