

Uniswap purchases rival PONS token for long-term alignment as both coins rally

Source Fxstreet
  • Uniswap has purchased the native token of a memecoin launchpad, citing long-term alignment. 
  • Details of the acquisition or allocation, such as size, price, or wallet address, remain undisclosed.
  • Uniswap Labs' pool.trade and Pons remain rivals on Robinhood Chain, while UNI hits an annual high and PONS hits a record high.

Uniswap (UNI) has purchased Pons (PONS) tokens in an undisclosed deal on Friday, citing long-term alignment with the memecoin launchpad token and its rival on the Robinhood chain. The nature of the deal, whether it's an acquisition or allocation, remains unknown, but Uniswap now holds a stake in Pons.

https://x.com/coinbureau/status/2095708176318607438

Pons has emerged as a leading memecoin launchpad on the Robinhood chain, routing tokens off its bonding curve to Uniswap V4 and rivaling Uniswap Labs’ pools.trade launchpad launched last month on the Robinhood chain.

PONS trades at its record high above $0.6800 at press time on Friday, advancing its price discovery mode. The price data shows parabolic growth in PONS, driven by its growing launchpad fees paid on Robinhood.
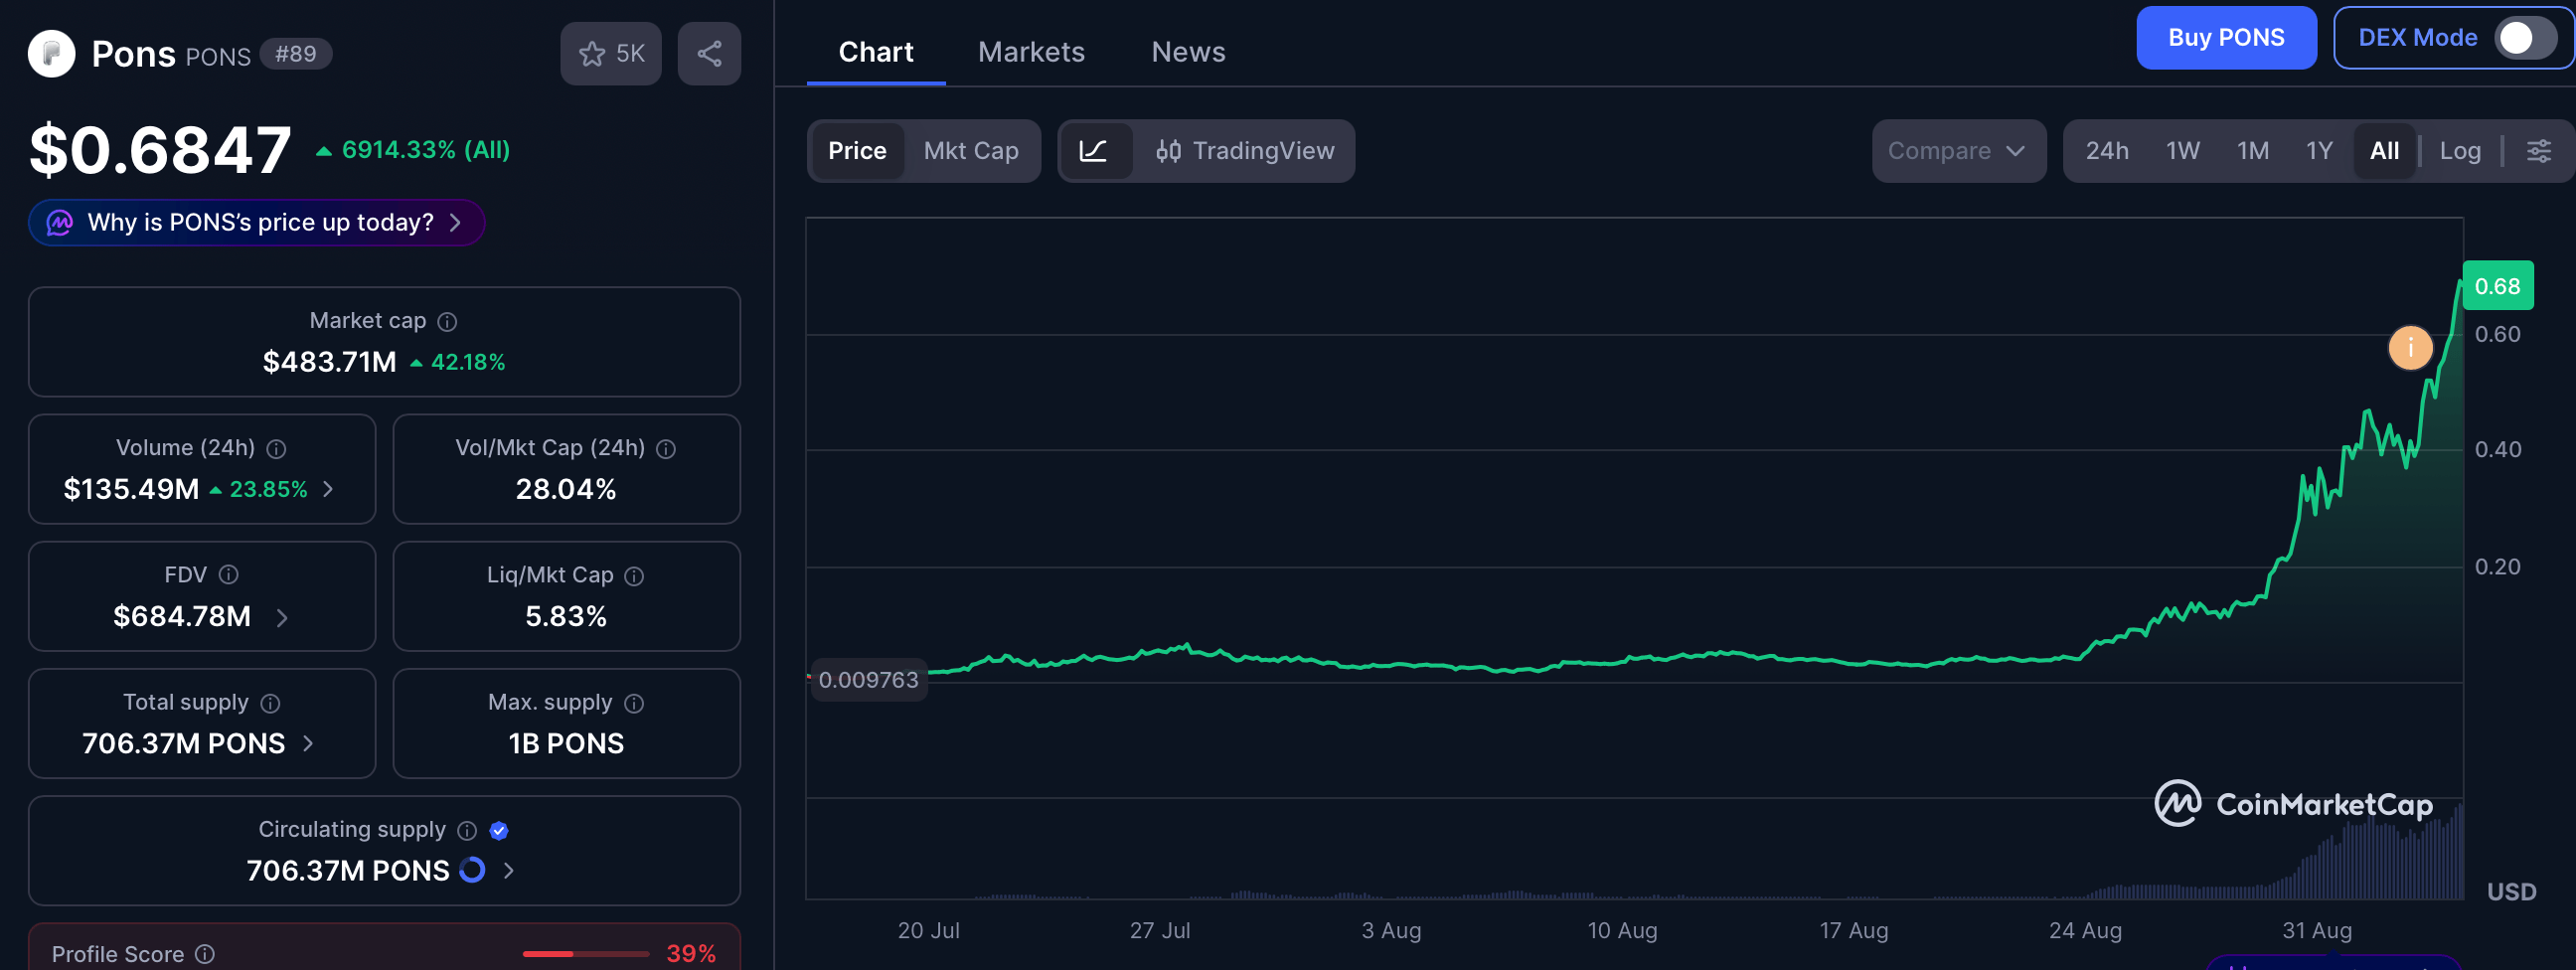
PONS market data. Source: CoinMarketCap

Uniswap rally gains traction

Uniswap hovers around $6.30 at press time on Friday, extending a strong bullish phase. The pair has pushed well beyond the 50-, 100-, and 200-day Exponential Moving Averages (EMAs) near $4.2640, $3.9145, and $4.0034, respectively, suggesting a broadly supportive trend backdrop.

Momentum remains overheated on the daily chart, with the Relative Strength Index (RSI) hovering in overbought territory near 81, while the Moving Average Convergence Divergence (MACD) rises steadily above zero, hinting that upside pressure persists even as the risk of a corrective pause grows.

A confirmed breakout above the December 28 swing high at $6.5690 could mark a fresh annual high and potentially target the 127.2% Fibonacci extension level at $8.7227, measured from $6.5690 to $2.3160.

Chart Analysis UNI/USDT (Binance)
UNI/USDT daily price chart.

On the downside, initial protection emerges around the 78.6% Fibonacci retracement at roughly $5.2554, ahead of the dynamic support reinforced by the 50-day EMA around $4.2640 and the 200-day EMA near $4.0034.

(The technical analysis of this story was written with the help of an AI tool. Know more.)

Disclaimer: For information purposes only. Past performance is not indicative of future results.
placeholder
XRP Price Prediction for July 2026: Can Buyers Finally Break the Downtrend?XRP (XRP) price trades near $1.05, caught between a year-long downtrend and a sudden burst of buying.July has historically rewarded XRP holders. This year the month arrives with on-chain accumulation
Author  Beincrypto
Jun 30, Tue
XRP (XRP) price trades near $1.05, caught between a year-long downtrend and a sudden burst of buying.July has historically rewarded XRP holders. This year the month arrives with on-chain accumulation
placeholder
What to Expect From Ethereum (ETH) in July 2026Ethereum (ETH) enters July 2026 trading near $1,570, close to multi-month lows, after recording its first run of three consecutive red quarterly candles in its history.On-chain data and price charts n
Author  Beincrypto
Jul 01, Wed
Ethereum (ETH) enters July 2026 trading near $1,570, close to multi-month lows, after recording its first run of three consecutive red quarterly candles in its history.On-chain data and price charts n
placeholder
XAUUSD Gold Analysis: Gold Holds Above $4,350 Ahead of US Inflation Data Is $4,500 Next? Gold holds above $4,350 following weak US jobs data. As inflation reports approach and UBS eyes $5,000, can XAUUSD break resistance at $4,435 to rally toward $4,500?
Author  Naoufal Seddik
Aug 12, Wed
Gold holds above $4,350 following weak US jobs data. As inflation reports approach and UBS eyes $5,000, can XAUUSD break resistance at $4,435 to rally toward $4,500?
placeholder
Gold Price Analysis Today: Gold Drops 1.32% Despite Lower Fed Rate-Hike Bets, Can $4,313 Support Hold? Gold fell 1.32% on August 13 after rising to $4,449.73, then reversing lower and closing near $4,349.918 below the $4,356.46 support. Softer US inflation data reduced Fed rate hike expectations, but selling pressure still dominated the session. Will $4,313 support hold?
Author  Naoufal Seddik
Aug 14, Fri
Gold fell 1.32% on August 13 after rising to $4,449.73, then reversing lower and closing near $4,349.918 below the $4,356.46 support. Softer US inflation data reduced Fed rate hike expectations, but selling pressure still dominated the session. Will $4,313 support hold?
placeholder
Gold Price Analysis Today: Gold Gains 0.94% as Markets Expect Fed to Hold Rates, Can $4,449 Resistance Break? Gold gained 0.94% on August 17, closing near $4,417.30 as softer US data strengthened expectations for unchanged Fed rates in September. Gold remains bullish, with $4,449.730 resistance and $4,310.650 support in focus.
Author  Naoufal Seddik
Aug 18, Tue
Gold gained 0.94% on August 17, closing near $4,417.30 as softer US data strengthened expectations for unchanged Fed rates in September. Gold remains bullish, with $4,449.730 resistance and $4,310.650 support in focus.
Related Instrument
goTop
quote