

Bitcoin Price Forecast: BTC corrects as increased profit-taking offsets positive market sentiment
- Bitcoin price faces a slight correction on Thursday after rallying 8.55% so far this week.
- US Bitcoin spot ETFs recorded an inflow of $916.91 million on Wednesday, its third straight day of inflows.
- Risk-on sentiment prevails as the Trump administration softens its tone on the Federal Reserve and trade tensions with China.
- The technical outlook suggests the pullback could be mild, with a rally toward $97,000 still on the cards.
Bitcoin (BTC) is facing a slight correction, trading around $92,000 at the time of writing on Thursday, after rallying 8.55% so far this week. Despite the mild correction, institutional demand remained strong, as US spot Exchange Traded Funds (ETFs) recorded an inflow of $916.91 million on Wednesday, marking three consecutive days of gains. Moreover, the risk-on sentiment prevails as US President Donald Trump’s administration appears to be softening its tone on the US Federal Reserve (Fed) and trade tensions with China.
The technical outlook suggests that the pullback could be mild as holders realize profits, and that a rally toward $97,000 is still on the cards.
Bitcoin corrects as holders realize profits
CryptoQuant data show that BTC holders are transferring their BTC holdings to exchanges, realizing profits, and thereby increasing selling pressure. The Bitcoin Exchange Netflow metric shows the difference between BTC flowing into and out of the exchange. As of Thursday, the metric reads a net inflow of 3,135 BTC, which indicates a bearish sign for BTC. If the net inflow continues to increase and intensify, the Bitcoin price could decline further.
 - All Exchanges (3)-1745488599795.png)
Bitcoin Exchange Netflow (Total) chart. Source: CryptoQuant
Bitcoin institutional demand continues to show strength
According to the SoSoValue data, the US spot Bitcoin ETF recorded a net inflow of $916.91 million on Wednesday, continuing its three-day net inflow streak this week. These inflows are a positive sign for Bitcoin, indicating a rise in institutional demand. If these inflows continue and intensify, Bitcoin prices could rally further.
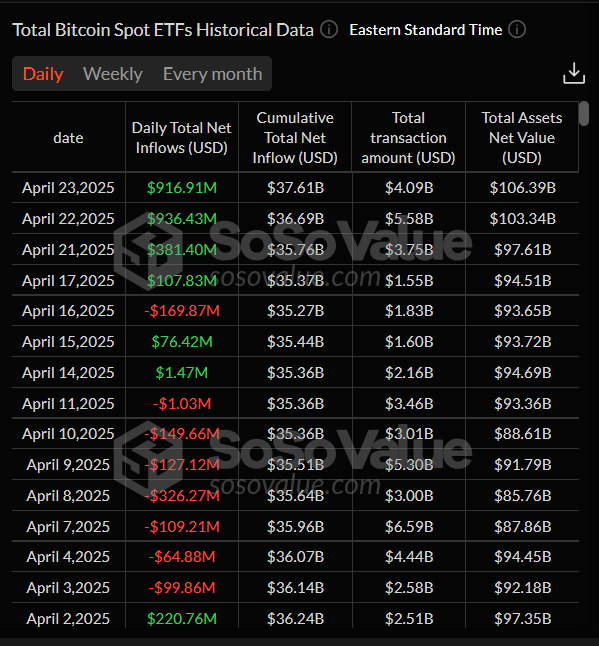
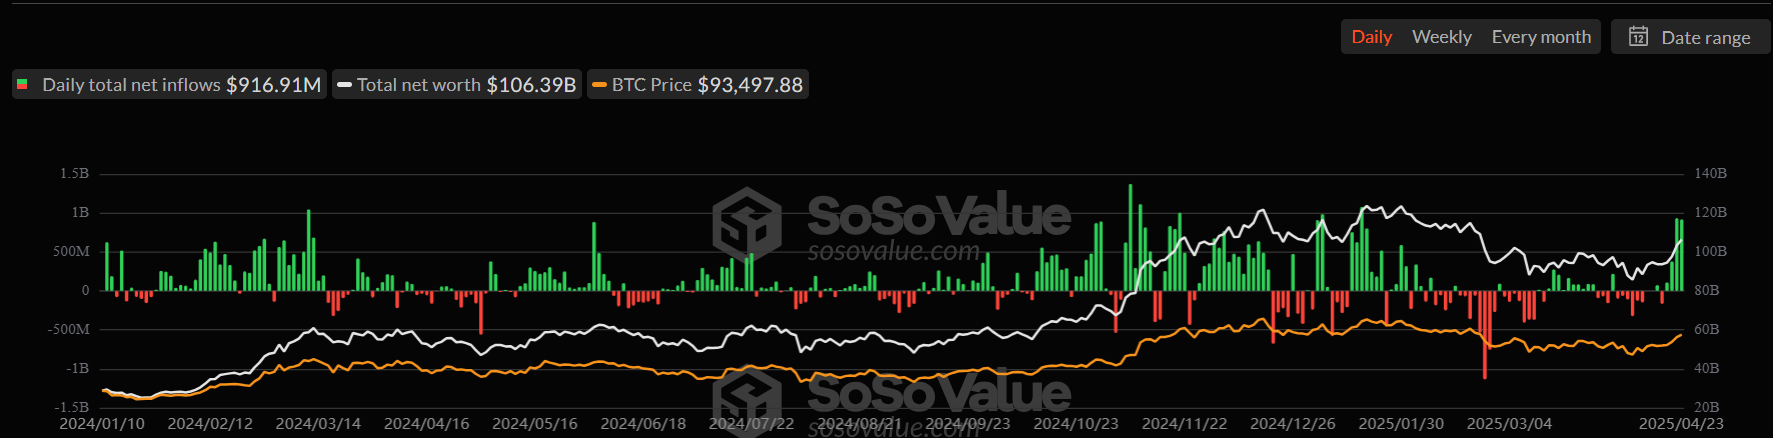
Total Bitcoin Spot ETFs daily chart. Source: SoSoValue
Risk-on sentiment prevails as Trump eases rhetoric on Fed and China
According to a report by The Wall Street Journal, the Asian stock markets were broadly higher early Thursday, extending gains for a second session as the Trump administration softened its tone on the Federal Reserve and trade tensions with China.
The report further explains that the Trump administration is considering slashing steep tariffs on Chinese imports – in some cases by more than half – in a bid to de-escalate tensions with Beijing. The shift in tone from Trump, possibly scaling back China tariffs despite the lack of specifics, has boosted investor confidence and supported the risk-on sentiment for riskier assets, such as Bitcoin, which has rallied nearly 9% so far this week, reaching a high of $94,696 on Wednesday.
Bitcoin Price Forecast: BTC shows weakness in bullish momentum
Bitcoin price faced multiple rejections around its 200-day Exponential Moving Average (EMA) at $85,000 since April 13. BTC finally broke above this resistance level on Monday, rising 9.7% to close above $90,000. It continued rising and faced resistance around the $95,000 on Wednesday. At the time of writing on Thursday, it faces a mild correction and trades near $92,000.
If BTC continues its pullback, it could extend the decline to find support around the $90,000 psychological importance level.
The Relative Strength Index (RSI) on the daily chart reads 63 after being rejected around its overbought level of 70 on Wednesday, indicating fading bullish momentum. If the RSI falls below its neutral level of 50, Bitcoin’s price could experience a sharp decline.
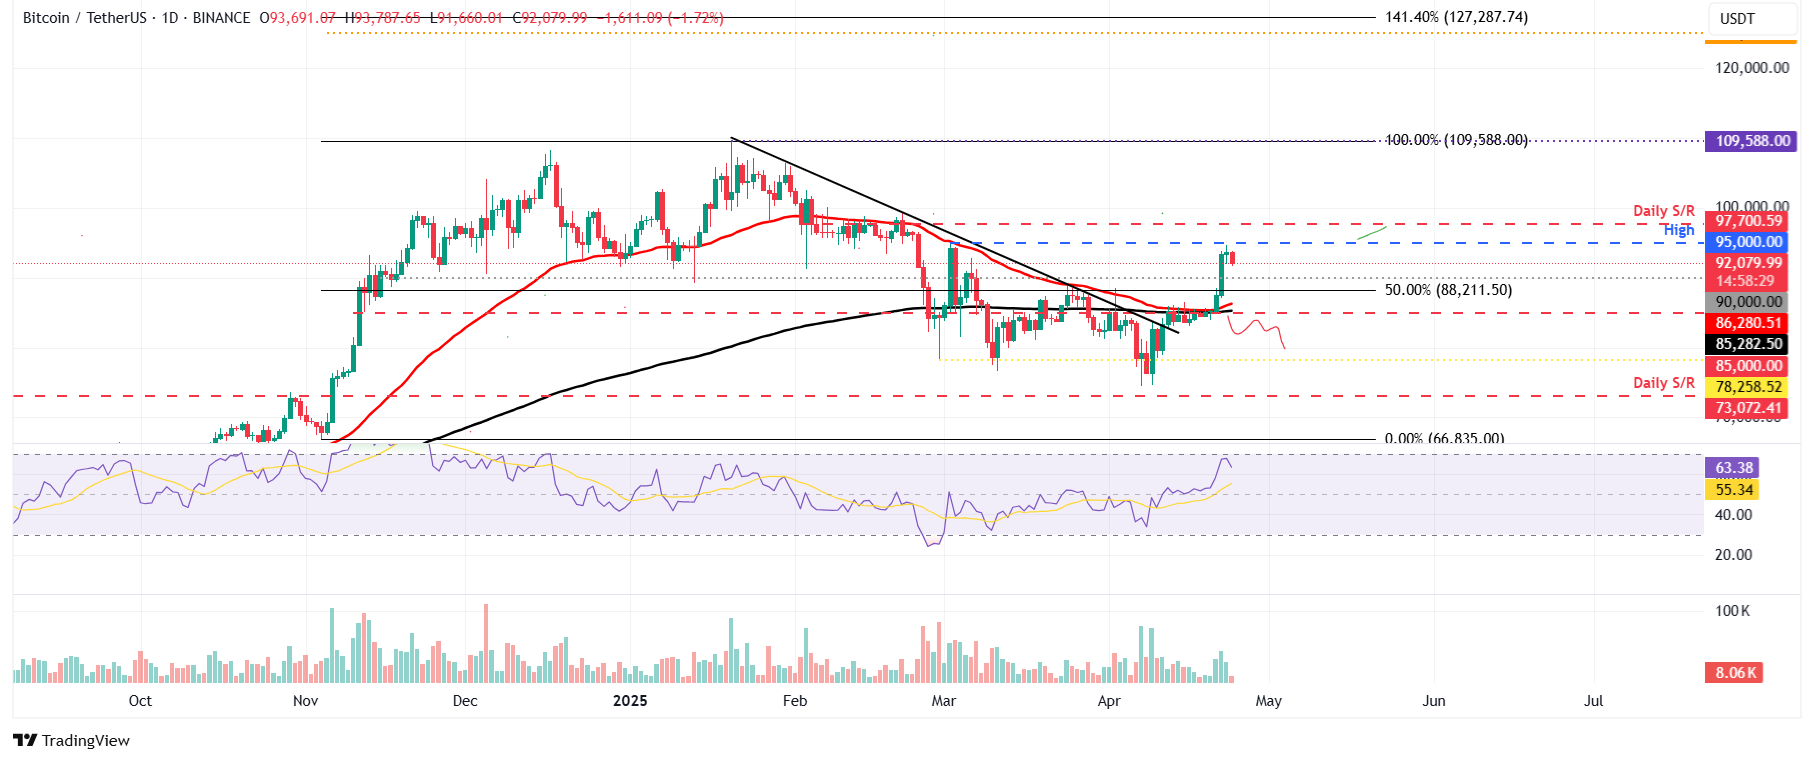
BTC/USDT daily chart
On the other hand, if BTC continues its upward momentum and closes above $95,000, it could extend the rally to retest its next daily resistance at $97,000.
Crypto ETF FAQs
An Exchange-Traded Fund (ETF) is an investment vehicle or an index that tracks the price of an underlying asset. ETFs can not only track a single asset, but a group of assets and sectors. For example, a Bitcoin ETF tracks Bitcoin’s price. ETF is a tool used by investors to gain exposure to a certain asset.
Yes. The first Bitcoin futures ETF in the US was approved by the US Securities & Exchange Commission in October 2021. A total of seven Bitcoin futures ETFs have been approved, with more than 20 still waiting for the regulator’s permission. The SEC says that the cryptocurrency industry is new and subject to manipulation, which is why it has been delaying crypto-related futures ETFs for the last few years.
Yes. The SEC approved in January 2024 the listing and trading of several Bitcoin spot Exchange-Traded Funds, opening the door to institutional capital and mainstream investors to trade the main crypto currency. The decision was hailed by the industry as a game changer.
The main advantage of crypto ETFs is the possibility of gaining exposure to a cryptocurrency without ownership, reducing the risk and cost of holding the asset. Other pros are a lower learning curve and higher security for investors since ETFs take charge of securing the underlying asset holdings. As for the main drawbacks, the main one is that as an investor you can’t have direct ownership of the asset, or, as they say in crypto, “not your keys, not your coins.” Other disadvantages are higher costs associated with holding crypto since ETFs charge fees for active management. Finally, even though investing in ETFs reduces the risk of holding an asset, price swings in the underlying cryptocurrency are likely to be reflected in the investment vehicle too.
บทความแนะนำ


