

Ethereum Price Forecast: ETH rallies 10% amid decline in CME short positions
Ethereum price today: $1,750
- Ethereum CME basis has dropped from 20% in November 2024 to around 5% in April 2025.
- The drop follows arbitrageurs covering short positions by selling their ETH ETF holdings after Trump's tariffs sparked a crypto market plunge.
- ETH could face a bearish test after moving above the $1,688 resistance.
Ethereum (ETH) saw a 10% gain on Tuesday after the general crypto market rallied alongside Bitcoin. The rally comes after the ETH Chicago Mercantile Exchange (CME) basis plunged from 20% in November to about 5% in April.
Ethereum rallies as CME short positions fall from elevated levels
Ethereum short positions on the CME have declined steadily since Trump's tariffs set in, dropping below $500 million across all traders categories for the first time in 2025.
The drop stems from a decline in the Ethereum CME basis, which plunged from 20% in November to around 4-5% in April. Basis is the difference between a futures contract price and its underlying asset's spot price.

ETH CME Futures annualized basis. Source: CryptoQuant
The 20% basis — greater than US Treasury yields at the time — attracted arbitrageurs, especially hedge funds. They bought US spot ETH ETF shares and simultaneously shorted ETH on the CME, according to an analyst note on CryptoQuant's Quicktake page.
However, the basis gap closed after Trump's tariffs and the Federal Reserve's hawkish tone caused a market-wide correction across crypto assets and stocks. As a result, these arbitrageurs have sold their spot ETH ETF holdings, sparking a major dump in the top altcoin.
This is visible in US spot ETH ETFs’ net outflows since mid-February, which are fast approaching the $1 billion mark. Notably, their total net assets dropped to an all-time low of $5.21 billion on Monday, according to data from SoSoValue.
"When we look at the current state of the market, we can see that a large portion of those arbitrage positions that dominated our agenda 2–3 months ago have now been closed. That's because basis levels have dropped to around 4–5%, aligning closely with US Treasury yields," the analyst wrote.
The decline in CME short positions indicates that ETH is free from "that pressure," but the analyst added that the market needs a series of positive macro news to turn bullish.
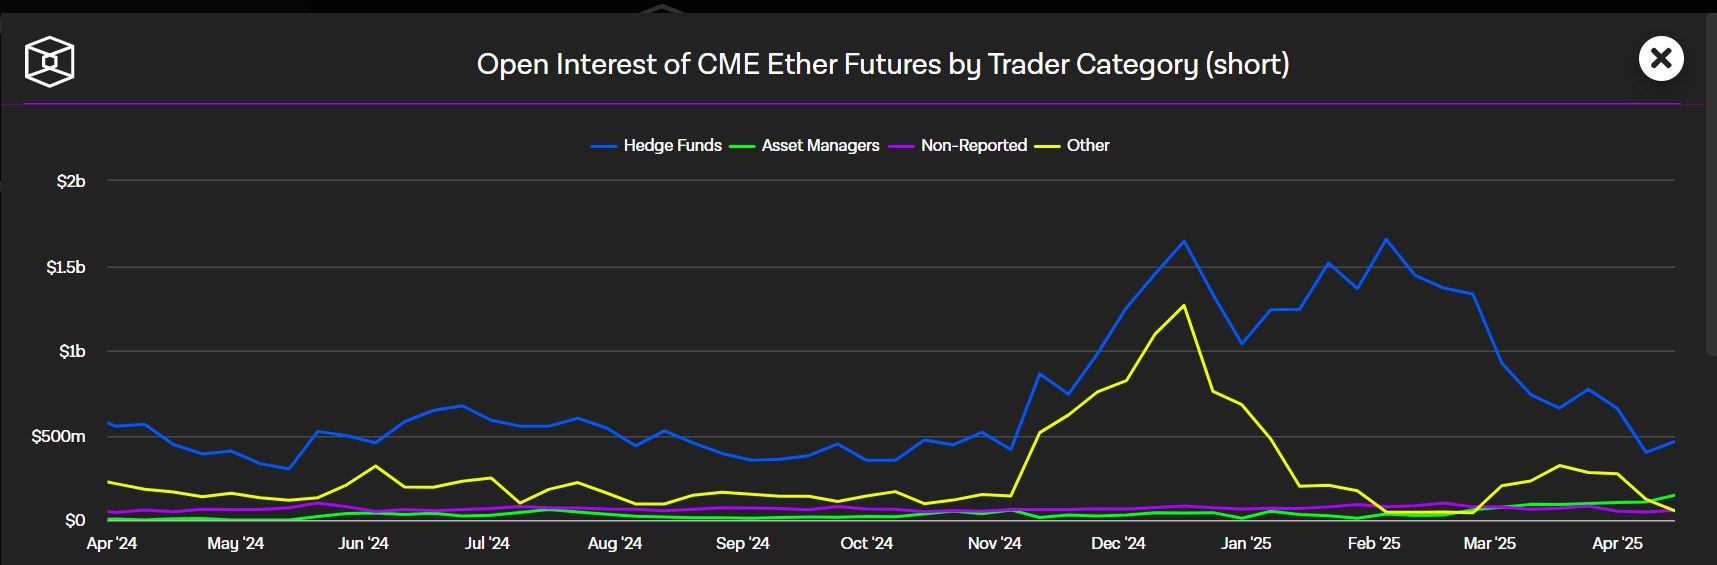
ETH CME Futures Shorts OI. Source: The Block
Ethereum is up over 10% on Tuesday, rising above $1,700 for the first time since April 6. The rally is fueled by optimism following US Treasury Secretary Scott Bessent's statement that the US-China tariff battle will likely ease soon, according to Bloomberg.
Ethereum Price Forecast: ETH needs to hold $1,688 support to limit downside pressure
Ethereum saw $91.62 million in futures liquidations in the past 24 hours, per Coinglass data. The total amount of long and short liquidations is $35.73 million and $55.90 million, respectively.
ETH bounced off a descending trendline extending from March 25 and quickly rose above the resistance at $1,688, which has held since April 9. With the recent bullish momentum still modest compared to the three-month-long overall bearish pressure, sellers could gain control near the $1,800 psychological level. If ETH reclaims $1,800 and flips its descending channel's upper boundary into a support level, it could spark a major uptrend.
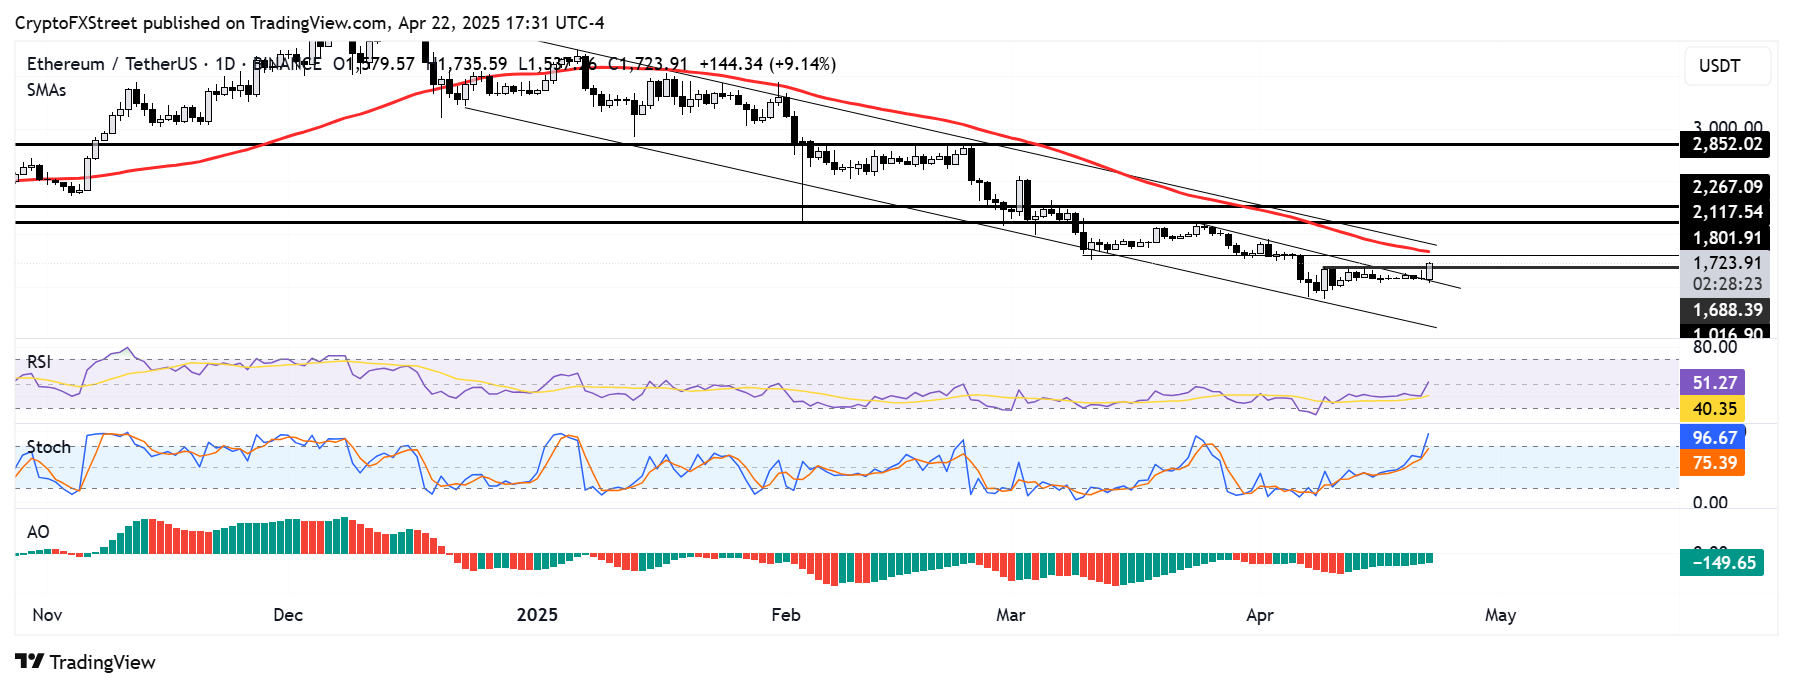
ETH/USDT daily chart
However, a failure to hold $1,688 as support could see ETH continuing its downside-biased consolidation.
The Relative Strength Index (RSI), Awesome Oscillator (AO) and Stochastic Oscillator (Stoch) are all moving upward, with the latter entering into the overbought region. The RSI and AO need to remain above their neutral levels to strengthen the bullish momentum.
บทความแนะนำ


