
Bitcoin Price Forecast: BTC holds steady as ETF inflows rise ahead of key macro events
- Bitcoin price has been consolidating within the $116,000–$120,000 range over the past two weeks, indicating market indecision.
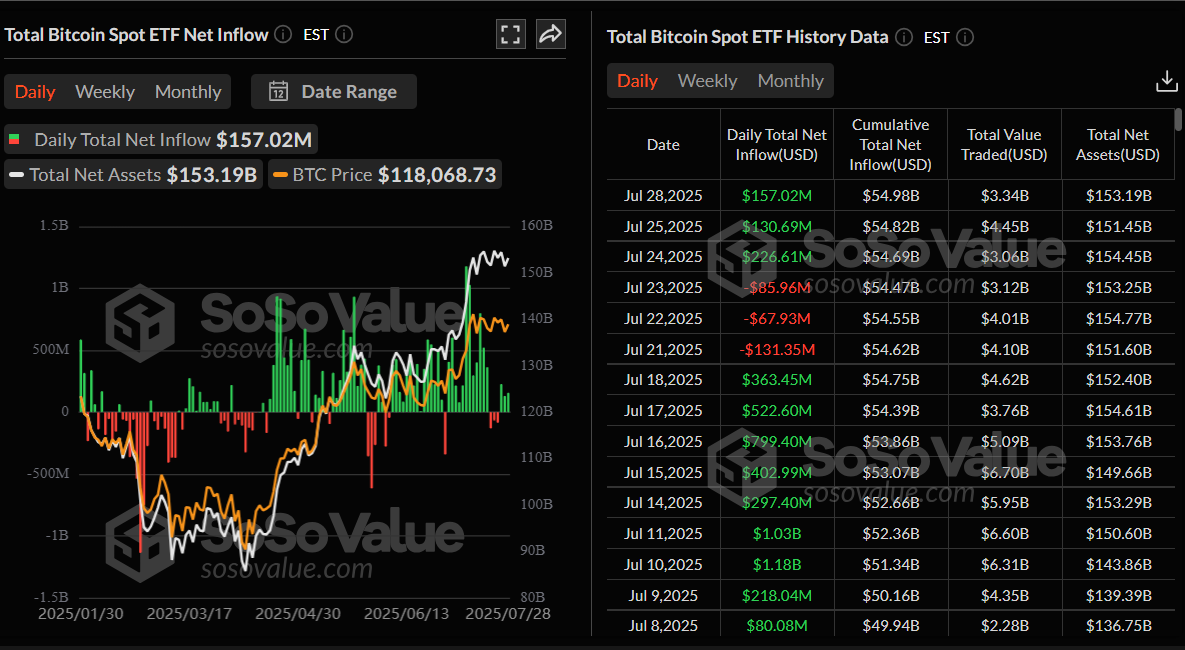
- US-listed spot Bitcoin ETFs recorded an inflow of $157.02 million on Monday, marking the third straight day of positive flows.
- Traders should be cautious as the upcoming tariff decline and macroeconomic data releases suggest a potentially volatile week.
Bitcoin (BTC) has been trading sideways between $116,000 and $120,000 for two weeks, signaling indecision among traders. Despite the lack of strong price direction, investor confidence appears to be growing, as US-listed spot Bitcoin Exchange Traded Funds (ETFs) recorded $157.02 million in inflows on Monday, extending a three-day streak. However, traders should keep a watch on potential volatility, with the upcoming US tariff deadline and the Federal Reserve’s (Fed) interest rate decision expected to drive volatility across crypto assets, including the largest cryptocurrency by market capitalization.
Bitcoin price shows resilience despite 80,000 BTC sale
A K33 report on Tuesday highlights that the BTC price shows signs of resilience despite Galaxy’s recent sell-off on Friday. Galaxy Digital wallets confirmed they had completed the sale of more than 80,000 BTC Over The Counter (OTC) on behalf of a client. This sell-off had caused BTC to slide slightly, but the price remained resilient and recovered quickly.
“BTC has behaved remarkably resilient given the magnitude of the sales pressure from this single entity over the past weeks,” said a K33 analyst.
The analyst continued that one core explanation behind the resilience lies in the continuous strong accumulation from BTC treasury vehicles and Exchange Traded Products (ETPs) throughout July.
The graph below shows that these three entities alone netted a total of $35,165 BTC, which was accumulated in July when adding ETP and treasury absorptions and subtracting the OTC sale order. Thus, a steadfastly strong demand for BTC has helped facilitate BTC’s robust response to the recent excess selling pressure from the OTC sale.
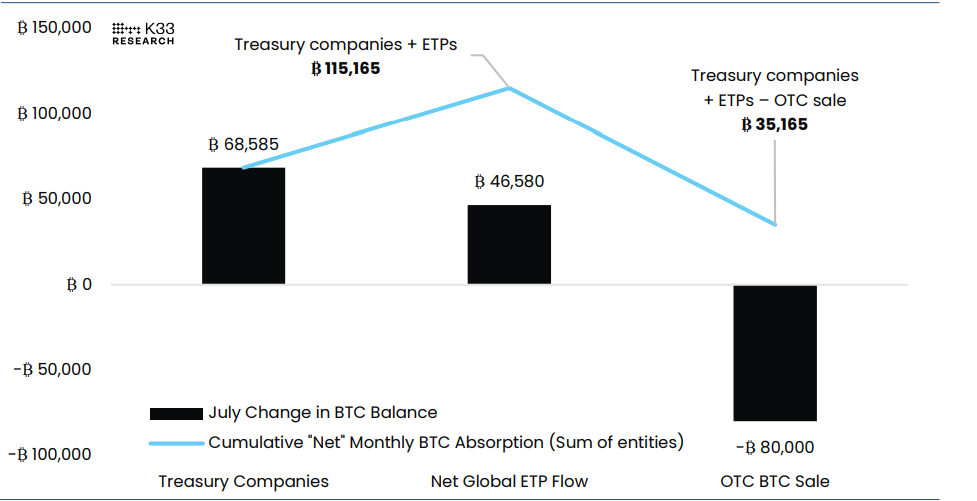
Monthly Change in BTC Exposure, various entities chart. Source: K33 Research
Looking down at the institutional demand, it continues to remain robust. According to the SoSoValue data, as shown below, US spot Bitcoin ETFs recorded an inflow of $157.02 million on Monday, marking the third straight day of positive net flows.
Bitcoin’s 7-day volatility hovers at 1-year lows ahead of key macro events
Bitcoin price has been trading sideways between $116,000 and $120,000 for the past two weeks after reaching a new all-time high of $123,213 on July 14. The graph below shows that the BTC 7-day volatility has been hovering around the yearly low levels, and the 30-day volatility has now declined to 1.34%, the lowest recorded since June 23, 2024.
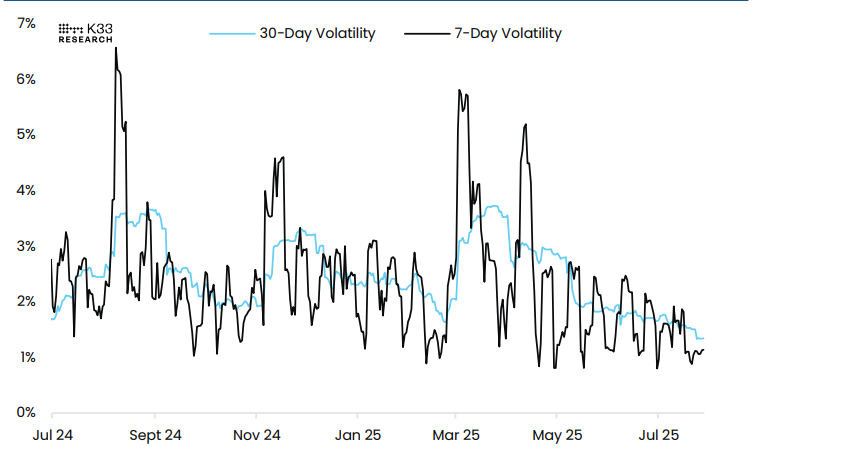
BTC–USD Volatility chart. Source: K33 Research
This low volatility could come to an end this week, with multiple announcements expected to be released: The US employment data release on Tuesday and Wednesday, followed by the US Gross Domestic Product (GDP) for the second quarter, the Fed’s interest rate decision and a potential White House Crypto Report on Wednesday, and the approaching US President Donald Trump's tariff deadline and the US Nonfarm Payrolls (NFP) report on Friday. These news and macroeconomic conditions could bring in sharp volatility in either direction, which could trigger massive liquidation in leveraged traders across Bitcoin.
Bitfinex analysts told FXStreet that “Derivatives exposure suggests that traders are increasingly looking beyond BTC to capture higher beta opportunities, particularly in Ethereum and trending altcoins.”
The analysts continued that the market becomes more vulnerable to liquidation cascades, sharp reversals, and exaggerated volatility. If momentum stalls or unexpected macro or regulatory news emerges, this leverage can unwind rapidly, potentially exacerbating downside moves across the altcoin complex. In short, while speculative enthusiasm is clearly returning, this build-up in leverage suggests that the market is entering a more fragile phase where risk management becomes increasingly important.
US SEC delays its decision on Trump’s Truth Social Bitcoin ETF
The US Securities and Exchange Commission (SEC) on Monday announced that it has extended the review deadline to September 18 from August 4 on the proposed Truth Social Bitcoin exchange-traded fund (ETF).
Apart from the Trump Media and Technology Group (TMTG) BTC ETF, the US SEC also postponed decisions on Grayscale's Solana Trust and Canary Capital’s proposed Litecoin ETF, extending the deadline to October 10.
If these ETFs are approved, they will bring a longer bullish outlook for Bitcoin as well as Solana and Litecoin. These ETFs would provide institutional and retail investors with direct exposure to native tokens, increasing exposure and wider adoption.
Bitcoin Price Forecast: BTC consolidates for two weeks
Bitcoin price has been consolidating in the $116,000 to $120,000 range for the past two weeks, following a new all-time high of $123,218 reached on July 14. At the time of writing on Tuesday, BTC hovers at around $118,200.
If BTC falls below $116,000 on a daily basis, it could extend the decline to retest the 50-day Exponential Moving Average (EMA) at $112,526.
The Relative Strength Index (RSI) indicator reads 58 on the daily chart, which is above its neutral level of 50 but points downward, indicating fading bullish momentum. Moreover, the Moving Average Convergence Divergence (MACD) indicator showed a bearish crossover on Wednesday, giving a sell signal and indicating a potential downward trend.
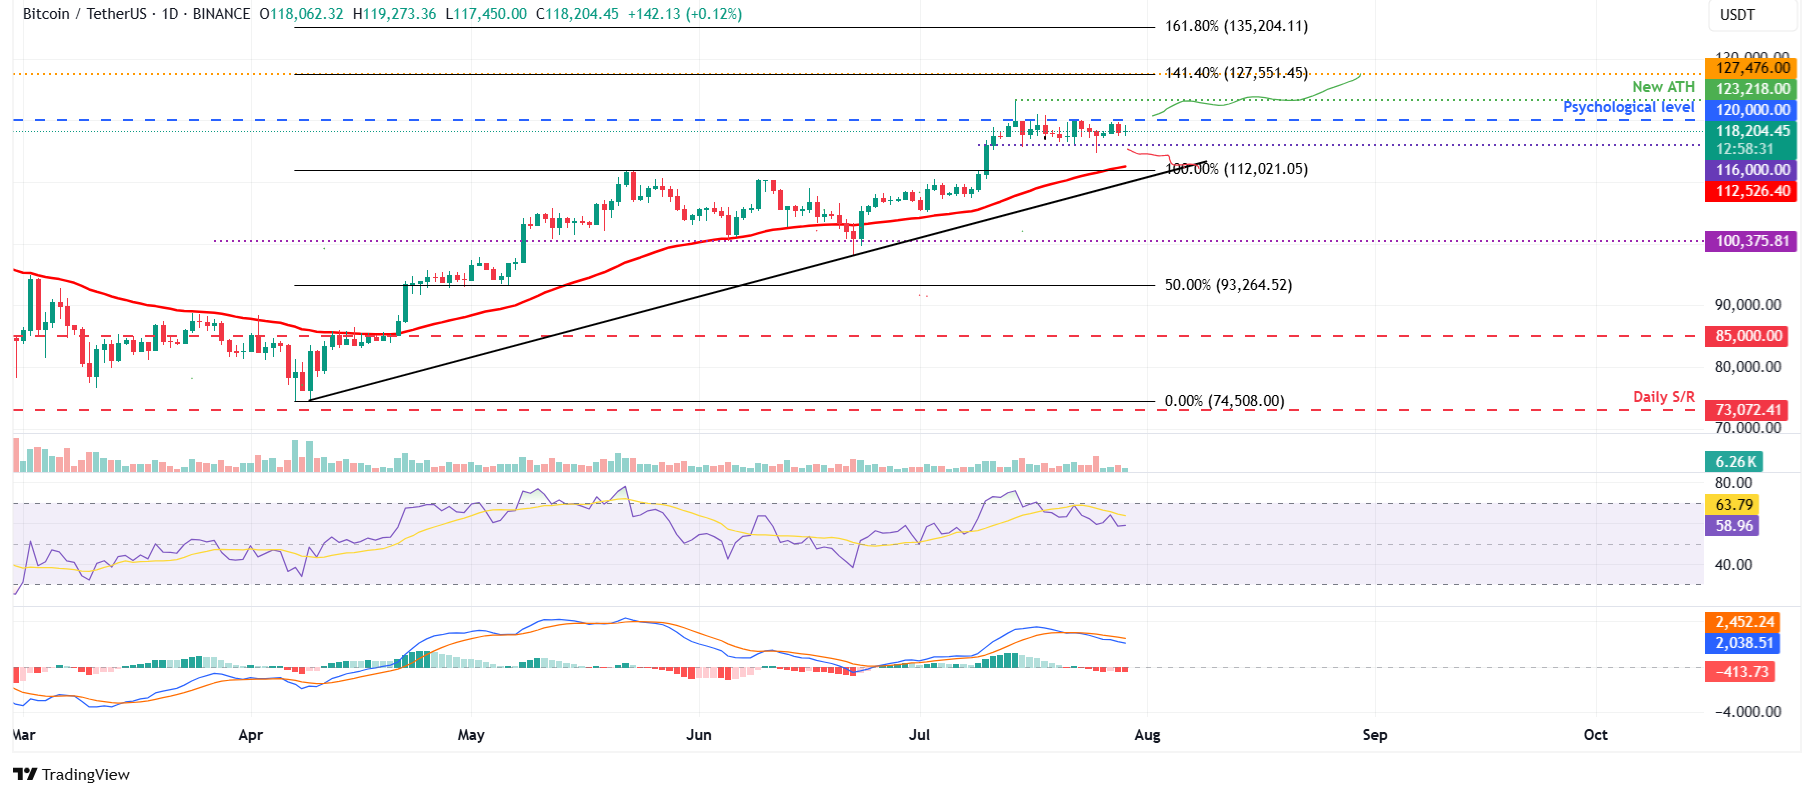
BTC/USDT daily chart
On the other hand, if BTC closes above $120,000 on a daily basis, it could extend the recovery toward the fresh all-time high at $123,218.
Bitcoin, altcoins, stablecoins FAQs
Bitcoin is the largest cryptocurrency by market capitalization, a virtual currency designed to serve as money. This form of payment cannot be controlled by any one person, group, or entity, which eliminates the need for third-party participation during financial transactions.
Altcoins are any cryptocurrency apart from Bitcoin, but some also regard Ethereum as a non-altcoin because it is from these two cryptocurrencies that forking happens. If this is true, then Litecoin is the first altcoin, forked from the Bitcoin protocol and, therefore, an “improved” version of it.
Stablecoins are cryptocurrencies designed to have a stable price, with their value backed by a reserve of the asset it represents. To achieve this, the value of any one stablecoin is pegged to a commodity or financial instrument, such as the US Dollar (USD), with its supply regulated by an algorithm or demand. The main goal of stablecoins is to provide an on/off-ramp for investors willing to trade and invest in cryptocurrencies. Stablecoins also allow investors to store value since cryptocurrencies, in general, are subject to volatility.
Bitcoin dominance is the ratio of Bitcoin's market capitalization to the total market capitalization of all cryptocurrencies combined. It provides a clear picture of Bitcoin’s interest among investors. A high BTC dominance typically happens before and during a bull run, in which investors resort to investing in relatively stable and high market capitalization cryptocurrency like Bitcoin. A drop in BTC dominance usually means that investors are moving their capital and/or profits to altcoins in a quest for higher returns, which usually triggers an explosion of altcoin rallies.
บทความแนะนำ


