
Pi Network Price Forecast: PI consolidates as Pi App Studio launched on Pi2Day gains transaction
- Pi Network remains muted in a consolidation range, under the $0.45 resistance level.
- Pi App Studio gains traction with over 7,600 chatbot apps and 14,100 custom apps, boosting the Pi Network ecosystem.
- The large transactions over the last 24 hours indicate increasing whale activity at lower price levels.
Pi Network (PI) edges higher by nearly 1% at press time on Monday while maintaining a sideways trend in a consolidation range. The recently launched Pi App Studio on Pi2Day (June 28) gains traction with the increased developer activity, while the large transactions over the last 24 hours hint at increased whale activity. The technical outlook suggests a decline in bearish momentum, indicating a potential breakout from the consolidation range.
Pi App Studio boosts developer activity on Pi Network
Pi App Studio is an AI-powered no-code platform launched on the Pi Network on Pi2Day (June 18). In an announcement on Sunday, it was revealed that over 7,600 chatbot apps and 14,100 custom apps were built with the help of Pi App Studio. The increased developer activity on Pi Network translates to a growing ecosystem.

Pi Network whale makes a strategic allocation move
PiScan data shows that the three largest transactions in the last 24 hours account for over 18 million PI tokens. The largest transaction refers to a transfer of 11.66 million PI tokens worth $5.26 million from GDIRB4…MRZNFL to GBE2AI…NUV6Q7.
It is worth noting that the other two largest transactions are 3.32 million and 3.26 million PI token transfers to the GDIRB4…MRZNFL wallet. This suggests a strategic allocation of PI tokens by a whale.
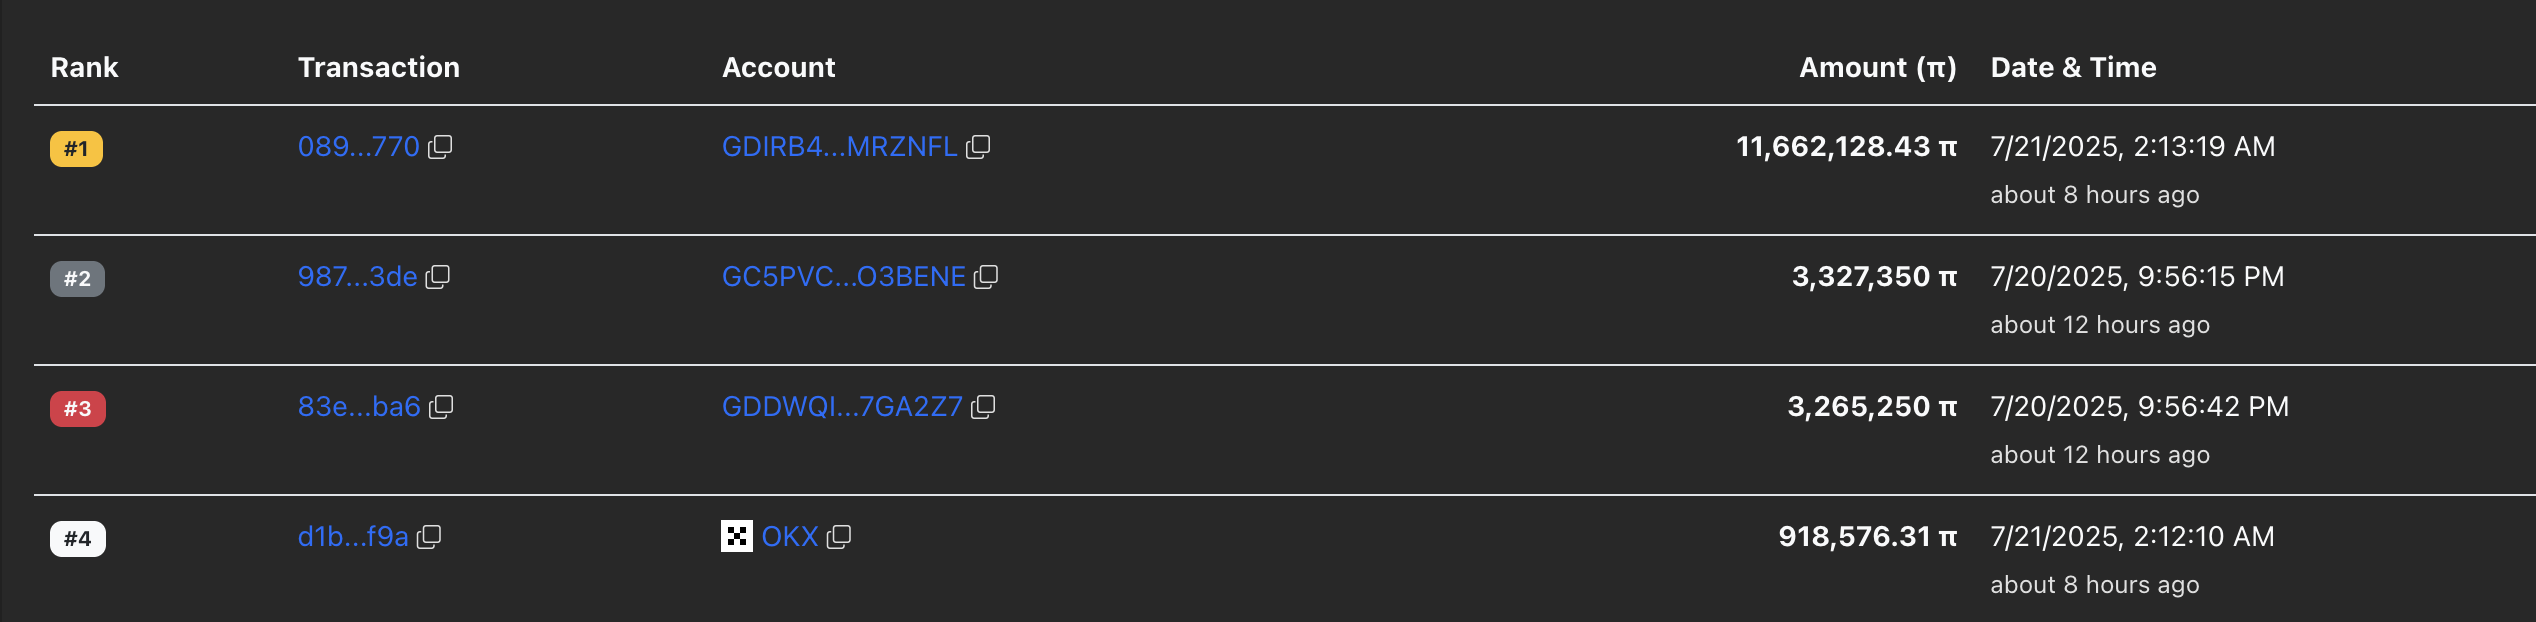
Pi Network's largest transactions. Source: PiScan
PI trapped in a range, eyes bullish breakout
Pi network edges higher within a consolidation range marked by a green band on the daily chart shared below. The recovery run struggles to surpass the 50-period Exponential Moving Average (EMA) at $0.4518, acting as a dynamic resistance.
A potential daily close above the upper boundary of the consolidation range, at $0.4547 or the 50-period EMA, could extend the breakout rally to the $0.4734 resistance level, last tested on July 14.
The Relative Strength Index (RSI) stands at 54 on the 4-hour chart, hovering slightly above the midpoint, flashing a neutral signal.
The Moving Average Convergence/Divergence (MACD) and its signal line display a rising trend, inching closer to crossing above the zero line. A trend of growing green histogram bars indicates a boost in bullish momentum.
Still, investors must remain cautious as the bullish momentum shift on the 4-hour chart reflects the short-term changes and could result in a false positive.
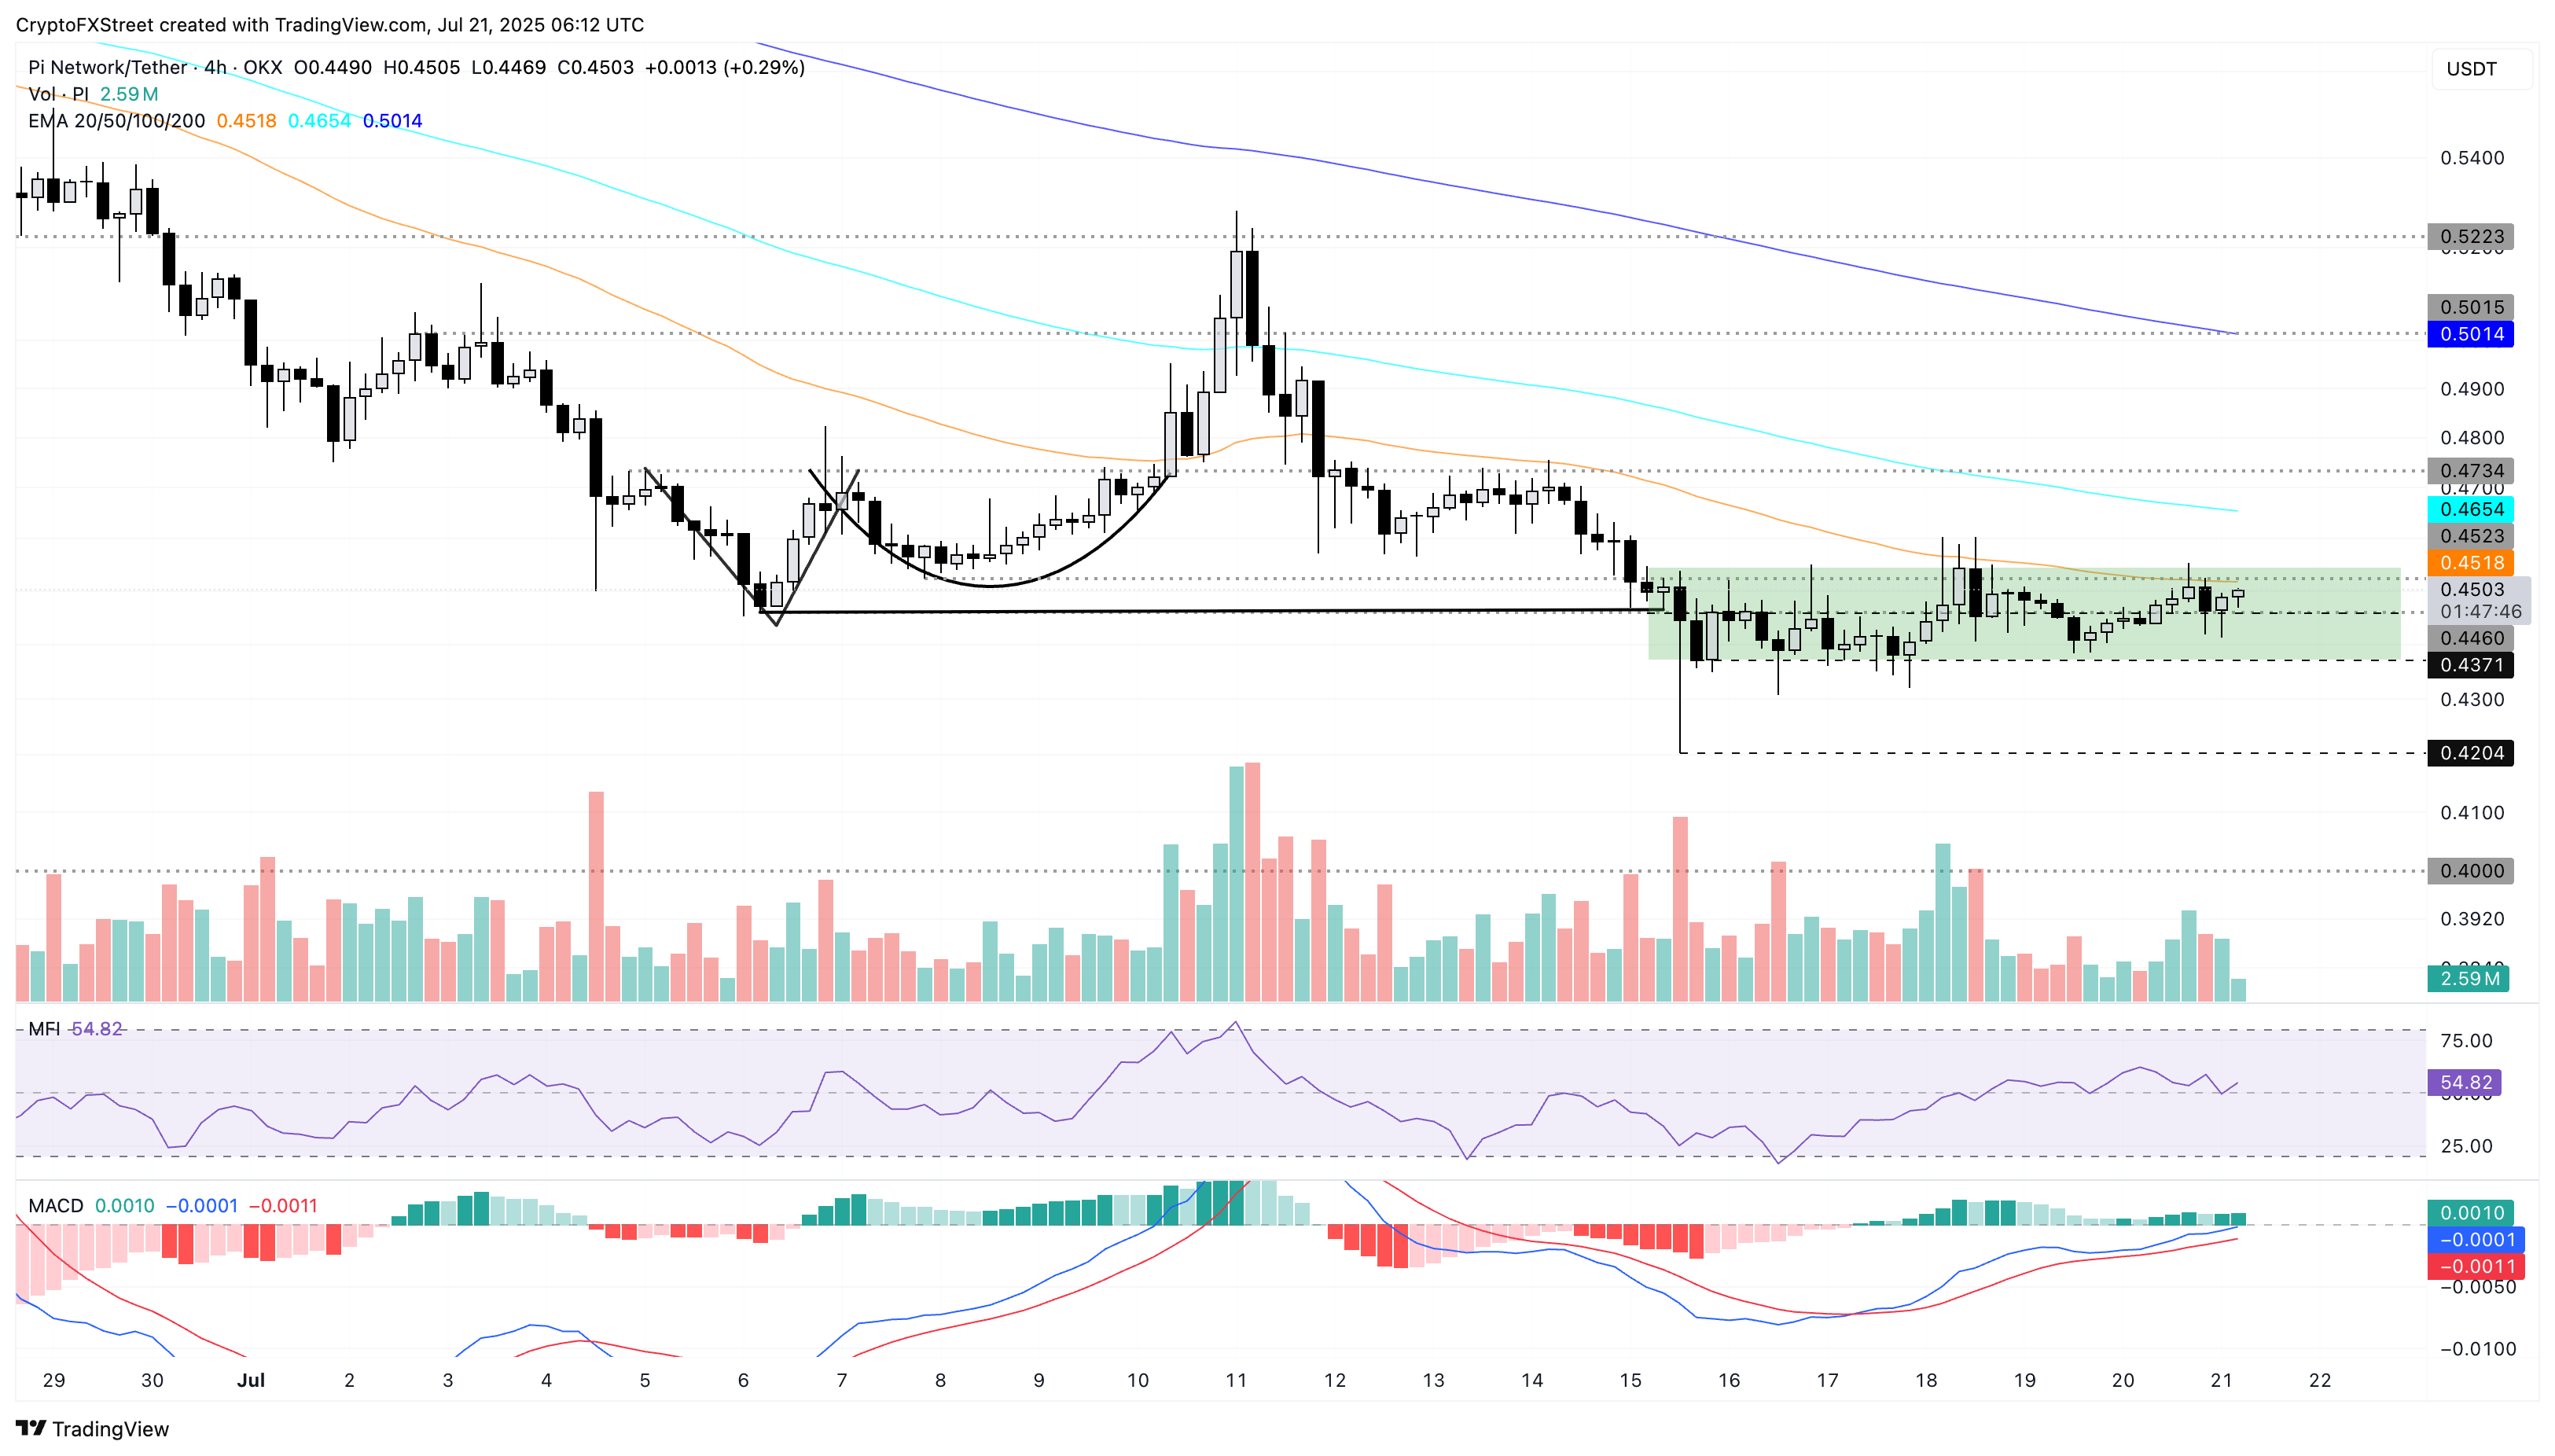
PI/USDT daily price chart.
On the downside, a reversal in Pi Network from the 50-period EMA within the range could retest the lower boundary at $0.4369. A decisive close below this level would invalidate the range, potentially extending the decline to $0.4204, marked by the July 15 low.
Bitcoin, altcoins, stablecoins FAQs
Bitcoin is the largest cryptocurrency by market capitalization, a virtual currency designed to serve as money. This form of payment cannot be controlled by any one person, group, or entity, which eliminates the need for third-party participation during financial transactions.
Altcoins are any cryptocurrency apart from Bitcoin, but some also regard Ethereum as a non-altcoin because it is from these two cryptocurrencies that forking happens. If this is true, then Litecoin is the first altcoin, forked from the Bitcoin protocol and, therefore, an “improved” version of it.
Stablecoins are cryptocurrencies designed to have a stable price, with their value backed by a reserve of the asset it represents. To achieve this, the value of any one stablecoin is pegged to a commodity or financial instrument, such as the US Dollar (USD), with its supply regulated by an algorithm or demand. The main goal of stablecoins is to provide an on/off-ramp for investors willing to trade and invest in cryptocurrencies. Stablecoins also allow investors to store value since cryptocurrencies, in general, are subject to volatility.
Bitcoin dominance is the ratio of Bitcoin's market capitalization to the total market capitalization of all cryptocurrencies combined. It provides a clear picture of Bitcoin’s interest among investors. A high BTC dominance typically happens before and during a bull run, in which investors resort to investing in relatively stable and high market capitalization cryptocurrency like Bitcoin. A drop in BTC dominance usually means that investors are moving their capital and/or profits to altcoins in a quest for higher returns, which usually triggers an explosion of altcoin rallies.
บทความแนะนำ


