The Graph aims to enable secure cross-chain GRT transfers with Chainlink’s CCIP

แหล่งที่มา Fxstreet
  • The Graph announced the integration of Chainlink’s Cross-Chain Interoperability protocol for cross-chain operations on Wednesday. 
  • With plans to deploy cross-chain GRT transfers across Arbitrum, Base, and Solana, Graph plans to build secure bridges.
  • The GRT token reflects mild gains and aims to surpass a critical supply zone. 

The Graph (GRT) plans to adopt the Chainlink (LINK) interoperability standard (CCIP) to enable GRT transfers across three ecosystems. A successful deployment of GRT bridges across Arbitrum (ARB), Base (BASE), and Solana (SOL) will significantly expand its cross-chain functionality. 

With the announcement of upcoming cross-chain functionalities and the adoption of CCIP, the GRT token records mild gains, projecting a potential breakout rally ahead. 

The Graph plots to make GRT a cross-chain token

The Graph announced on Wednesday that it would adopt the Chainlink Cross-Chain Interoperability Protocol (CCIP) to deploy GRT bridges across Arbitrum, Base, and Solana. With this move, the Graph plans to expand the GRT token’s functionality in cross-chain staking, delegation, and query fee payments over the layer-2 projects. 

Cautiously, the Graph indicates that the potential functionalities will depend on successful GRT bridge infrastructure. 

At the time of writing, the Graph holds a market capitalization of $1.14 billion. 

GRT rally holds firm, targets $0.13 breakout

GRT token trades at $0.1180 with an intraday gain of 3.15% on Thursday, at the time of writing. Stacking over the 3.25% surge on Wednesday, the recovery rally in the altcoin surpasses the 100-day Exponential Moving Average (EMA) at $0.1136. 

The altcoin is up 77% from the year-to-date low at $0.0663, creating a support trendline with higher lows. As the uptrend gains momentum, the price action nears the critical resistance zone encapsulating the $0.13 mark. 

The Relative Strength Index (RSI) at 59, with a bounce back from the midline, shows a resurgence of underlying bullishness. Further up, the Moving Average Convergence/Divergence (MACD) line is close to surpassing its signal lines to trigger a bullish crossover. This will offset the recent negative fallout, suggesting the re-entry of bulls. 

A potential breakout of the $0.13 supply zone could propel the GRT spot price to $0.1551, aligning with the 50% Fibonacci level. The Fibonacci retracement extends over the 79% crash from the $0.3366 trough peak to $0.714 between December 6 and April 8. Notably, the 200-day EMA at $0.1376 could be a minor hurdle for the breakout rally. 

Chainlink

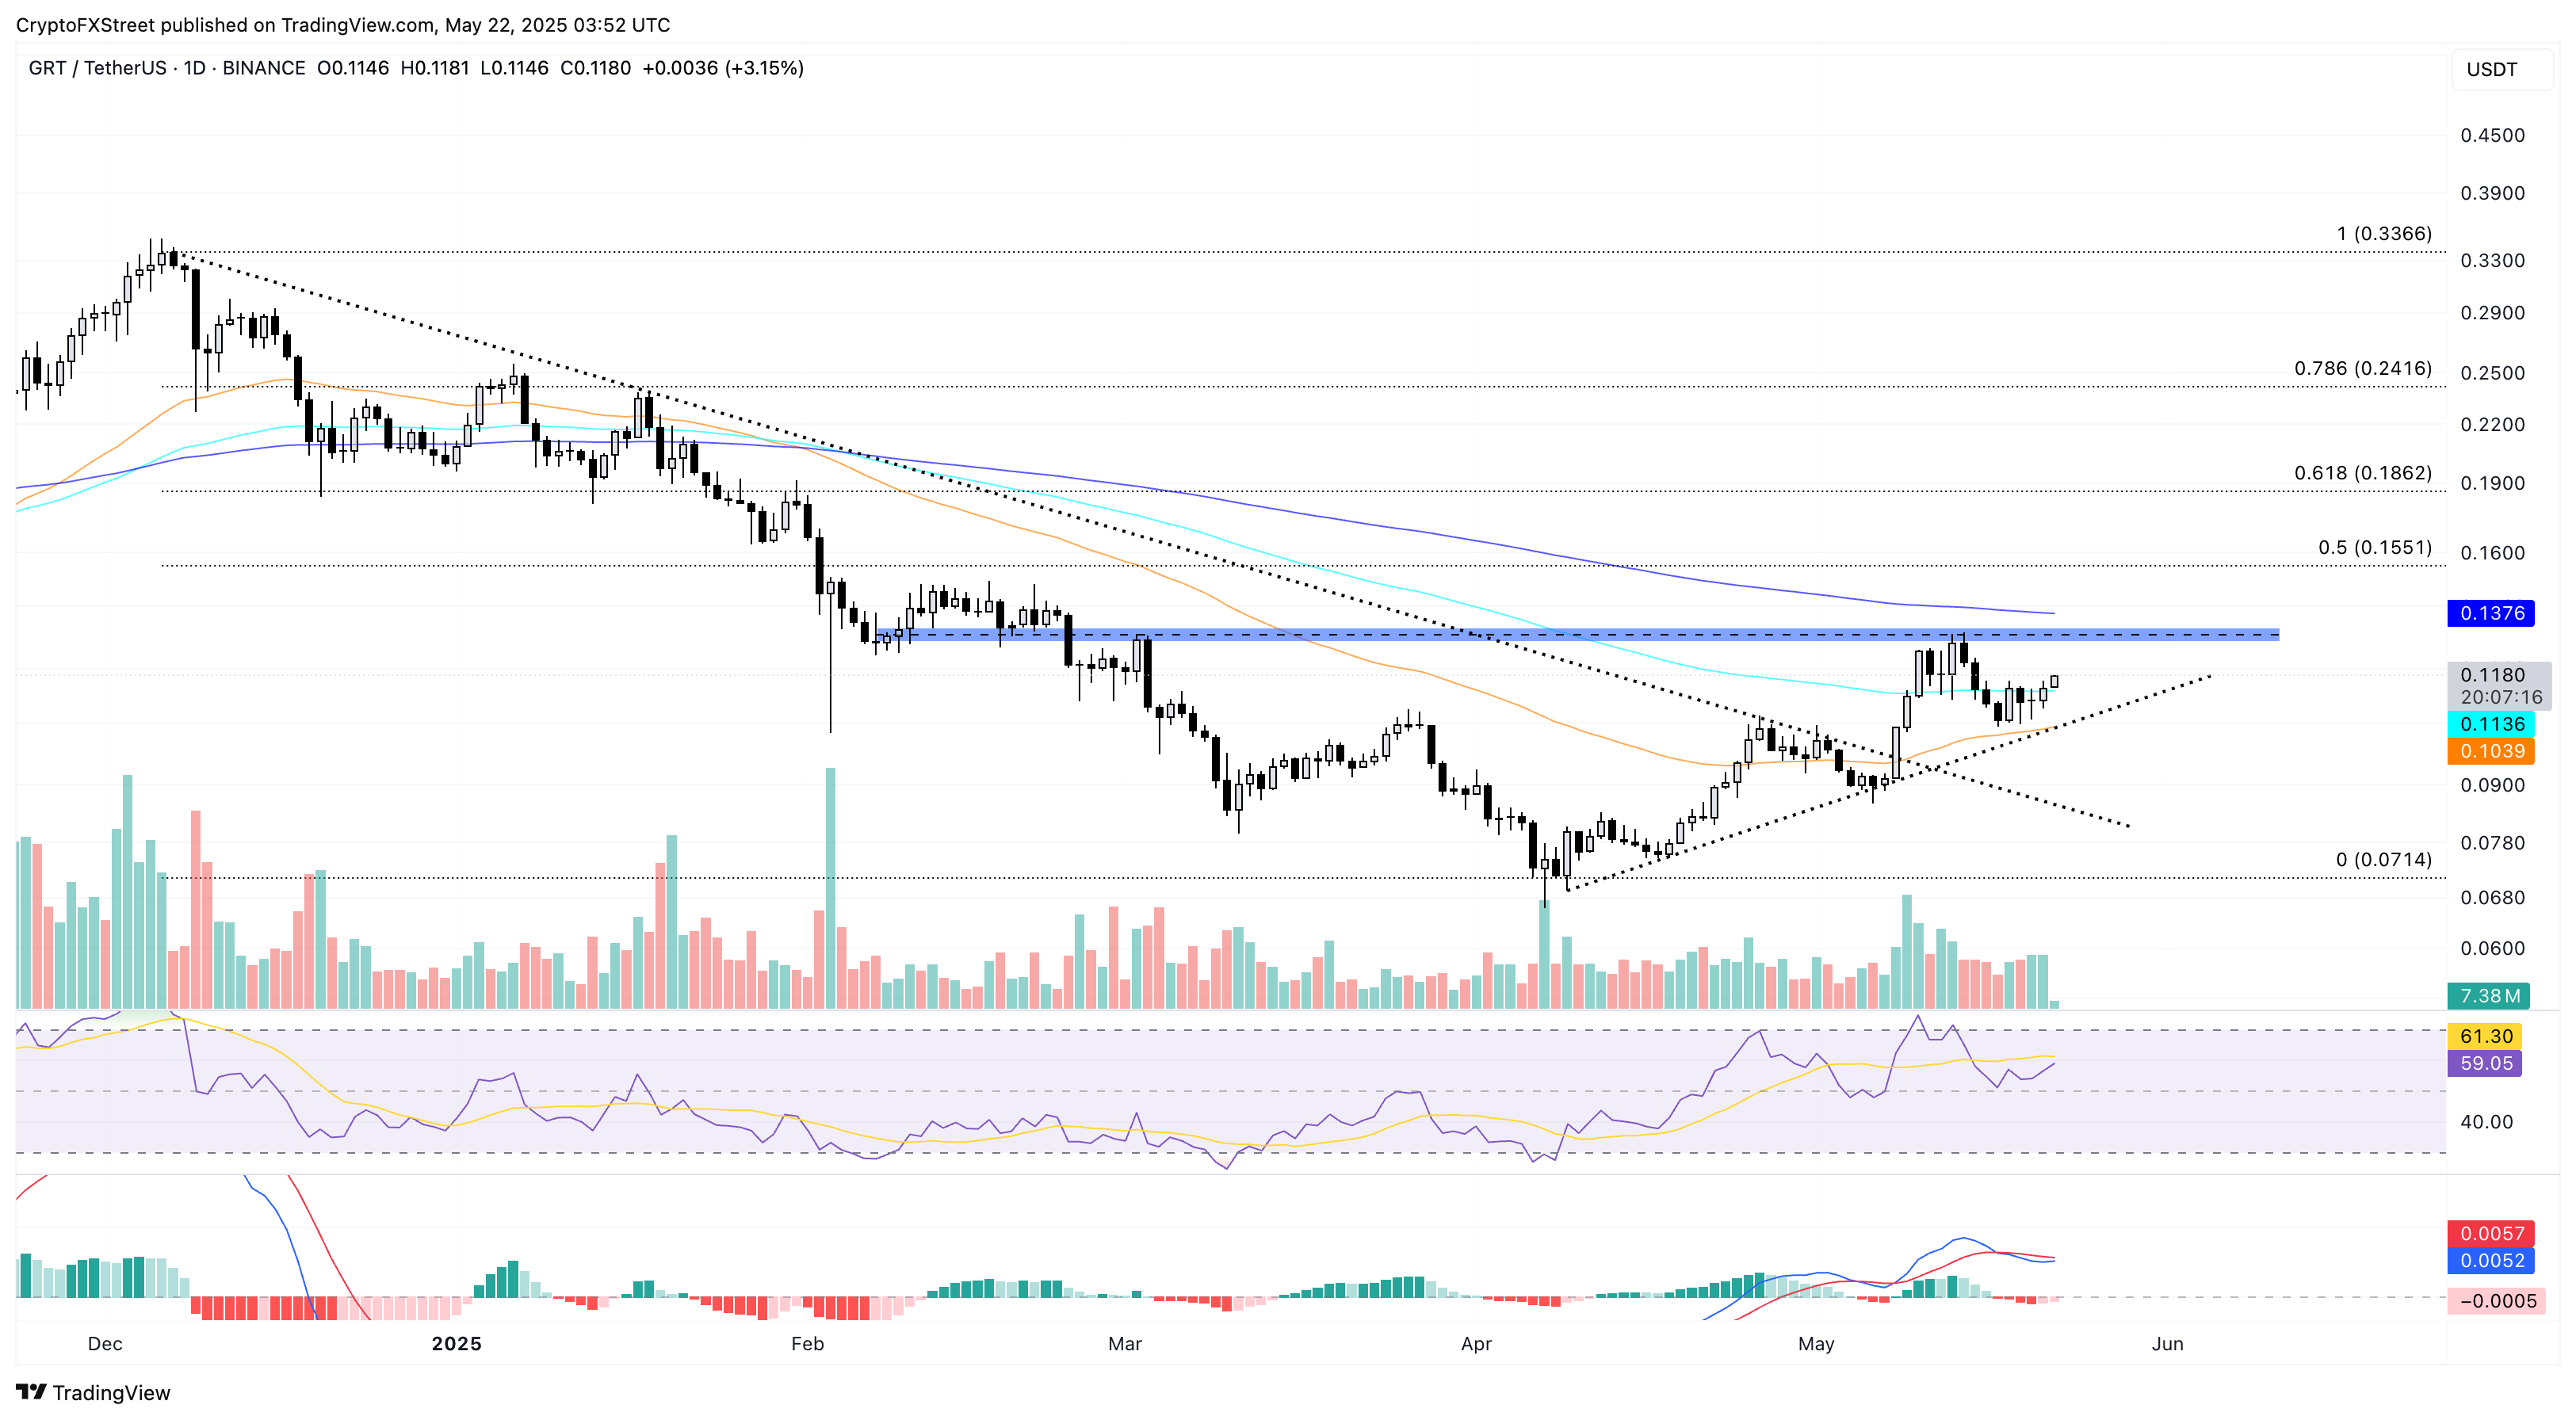
GRT/USDT price chart. Source: Tradingview

Conversely, a reversal from $0.13 might retest the 100-day EMA at $0.1136, followed by the next 50-day EMA support at $0.1039.

ข้อจำกัดความรับผิดชอบ: เพื่อการอ้างอิงเท่านั้น ผลการดำเนินงานในอดีตไม่ได้บ่งบอกถึงผลลัพธ์ในอนาคต
placeholder
EUR/USD ปรับตัวลดลงสู่ระดับกลาง 1.1300; มองไปที่ดัชนีราคาสินค้าใช้จ่ายส่วนบุคคลของสหรัฐฯ เพื่อหาแรงกระตุ้นใหม่คู่ EUR/USD ดิ้นรนเพื่อใช้ประโยชน์จากการดีดตัวขึ้นที่แข็งแกร่งในวันก่อนหน้าจากบริเวณ 1.1200 หรือระดับต่ำสุดในรอบหนึ่งสัปดาห์ครึ่ง และซื้อขายด้วยแนวโน้มเชิงลบเล็กน้อยในช่วงเซสชั่นเอเชียของวันศุกร์
ผู้เขียน  FXStreet
5 เดือน 30 วัน ศุกร์
คู่ EUR/USD ดิ้นรนเพื่อใช้ประโยชน์จากการดีดตัวขึ้นที่แข็งแกร่งในวันก่อนหน้าจากบริเวณ 1.1200 หรือระดับต่ำสุดในรอบหนึ่งสัปดาห์ครึ่ง และซื้อขายด้วยแนวโน้มเชิงลบเล็กน้อยในช่วงเซสชั่นเอเชียของวันศุกร์
placeholder
การคาดการณ์ราคาของ EUR/USD: ขาขึ้นมีความได้เปรียบเมื่ออยู่เหนือ SMA 100 ชั่วโมง บริเวณรอบ 1.1380คู่ EUR/USD ดึงดูดแรงช้อนซื้อในช่วงเริ่มต้นของสัปดาห์ใหม่ โดยกลับตัวจากการปรับตัวลดลงในวันศุกร์และหยุดการย่อตัวในสัปดาห์ที่แล้วจากระดับสูงสุดนับตั้งแต่วันที่ 22 เมษายน
ผู้เขียน  FXStreet
6 เดือน 09 วัน จันทร์
คู่ EUR/USD ดึงดูดแรงช้อนซื้อในช่วงเริ่มต้นของสัปดาห์ใหม่ โดยกลับตัวจากการปรับตัวลดลงในวันศุกร์และหยุดการย่อตัวในสัปดาห์ที่แล้วจากระดับสูงสุดนับตั้งแต่วันที่ 22 เมษายน
placeholder
การคาดการณ์ราคา USD/JPY: ทะลุเหนือ 145.00 ขณะที่ความหวังในการซื้อขายสนับสนุน USDUSD/JPY ขยับขึ้นเป็นครั้งแรกในสัปดาห์นี้ โดยทะลุจุดสูงสุดของวันจันทร์ที่ 144.95 ขณะที่ดอลลาร์สหรัฐแข็งค่าขึ้นจากการคาดการณ์ว่าวอชิงตันและปักกิ่งอาจบรรลุข้อตกลงการค้าในลอนดอน ซึ่งทำให้คู่เงินนี้ทะลุ 145.00 และมีการปรับตัวเพิ่มขึ้นมากกว่า 0.24%
ผู้เขียน  FXStreet
23 ชั่วโมงที่แล้ว
USD/JPY ขยับขึ้นเป็นครั้งแรกในสัปดาห์นี้ โดยทะลุจุดสูงสุดของวันจันทร์ที่ 144.95 ขณะที่ดอลลาร์สหรัฐแข็งค่าขึ้นจากการคาดการณ์ว่าวอชิงตันและปักกิ่งอาจบรรลุข้อตกลงการค้าในลอนดอน ซึ่งทำให้คู่เงินนี้ทะลุ 145.00 และมีการปรับตัวเพิ่มขึ้นมากกว่า 0.24%
placeholder
AUD/JPY ยังคงรักษาผลกำไรใกล้ 94.50 ขณะที่นักลงทุนสงสัยเกี่ยวกับแผนการปรับขึ้นอัตราดอกเบี้ยของ BoJคู่ AUD/JPY ยังคงรักษาการปรับตัวขาขึ้นติดต่อกันสี่วันเข้าใกล้ระดับ 94.50 ในช่วงชั่วโมงการซื้อขายในเอเชียวันพุธ ข้ามคู่เงินนี้แสดงถึงความแข็งแกร่งเมื่อเหล่านักลงทุนเริ่มตั้งคำถามว่าธนาคารกลางญี่ปุ่น (BoJ) จะขึ้นอัตราดอกเบี้ยอีกครั้งในปีนี้หรือไม่
ผู้เขียน  FXStreet
19 ชั่วโมงที่แล้ว
คู่ AUD/JPY ยังคงรักษาการปรับตัวขาขึ้นติดต่อกันสี่วันเข้าใกล้ระดับ 94.50 ในช่วงชั่วโมงการซื้อขายในเอเชียวันพุธ ข้ามคู่เงินนี้แสดงถึงความแข็งแกร่งเมื่อเหล่านักลงทุนเริ่มตั้งคำถามว่าธนาคารกลางญี่ปุ่น (BoJ) จะขึ้นอัตราดอกเบี้ยอีกครั้งในปีนี้หรือไม่
placeholder
การคาดการณ์ราคาทองคำเงิน: XAGUSD เคลื่อนไหวไซด์เวย์รอบๆ $36.50 ขณะที่นักลงทุนรอข้อมูลอัตราเงินเฟ้อของสหรัฐฯราคาเงิน (XAG/USD) เคลื่อนไหวในกรอบราคาแคบๆ ประมาณ $36.50 ในช่วงชั่วโมงการซื้อขายยุโรปวันพุธ โลหะเงินปรับฐานขณะที่นักลงทุนรอข้อมูลดัชนีราคาผู้บริโภค (CPI) ของสหรัฐอเมริกาในเดือนพฤษภาคม ซึ่งจะประกาศในเวลา 12:30 GMT
ผู้เขียน  FXStreet
17 ชั่วโมงที่แล้ว
ราคาเงิน (XAG/USD) เคลื่อนไหวในกรอบราคาแคบๆ ประมาณ $36.50 ในช่วงชั่วโมงการซื้อขายยุโรปวันพุธ โลหะเงินปรับฐานขณะที่นักลงทุนรอข้อมูลดัชนีราคาผู้บริโภค (CPI) ของสหรัฐอเมริกาในเดือนพฤษภาคม ซึ่งจะประกาศในเวลา 12:30 GMT
ตราสารที่เกี่ยวข้อง
goTop
quote