


Solana Price Forecast: SOL slides below key EMAs as ETF outflows peak
- Solana hovers around $95.48 on Monday after five straight weeks of losses since late September and closes below key EMAs.
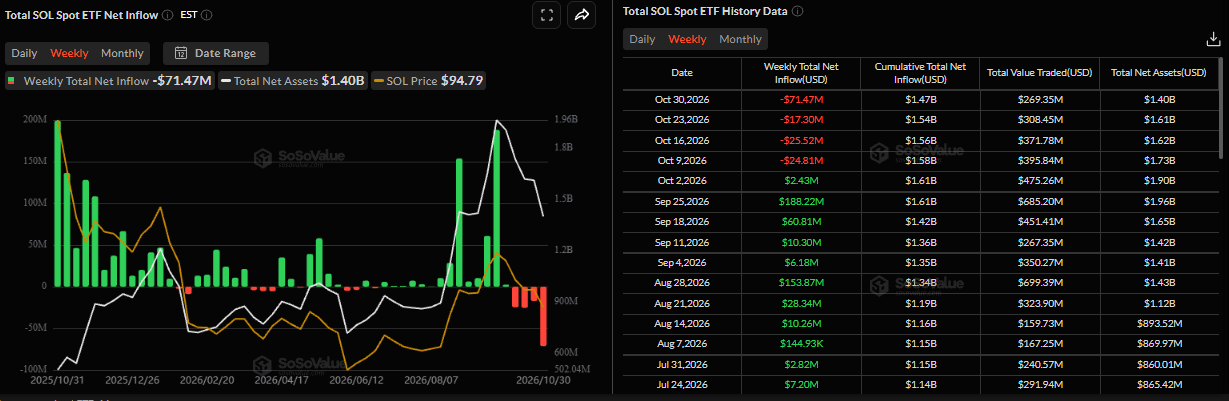
- US-listed spot SOL ETFs recorded net outflows of $71.47 million last week, the highest weekly withdrawals since their launch.
- Weakening on-chain metrics and deteriorating technical outlook suggest cautionary signs.
Solana (SOL) remains under pressure on Monday, hovering around $95.48 after extending its losing streak to five consecutive weeks. Bearish sentiment strengthens as SOL’s spot Exchange Traded Funds (ETFs) recorded weekly outflows of $71.47 million, marking the largest withdrawals since their launch. Meanwhile, weakening on-chain metrics and a deteriorating technical outlook suggest that SOL could face further downside risks.
Highest weekly outflows since launch
Institutional demand for Solana is showing signs of weakening. SoSoValue data shows spot SOL ETFs recorded net outflows of $71.47 million last week, the highest weekly withdrawals since their launch. Moreover, last week’s outflow marked the fourth consecutive week of withdrawals since early October. If this outflow trend continues and intensifies, Solana could face a deeper correction.
On-chain data shows cautionary signs
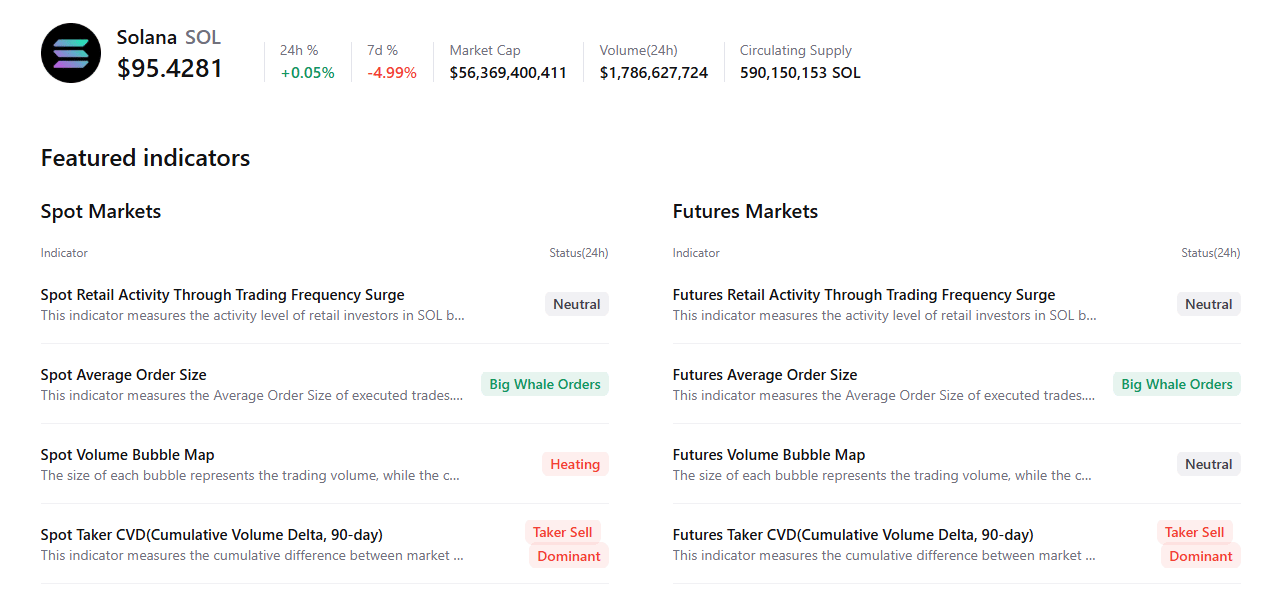
CryptoQuant’s summary data shows a cautious tone. SOL’s spot and futures markets show large whale orders alongside sell-side dominance. In addition, the spot markets show overheating conditions. These highlight a bearish, cautious sentiment bias among Solana traders.
Solana technical outlook: Slips below key EMAs
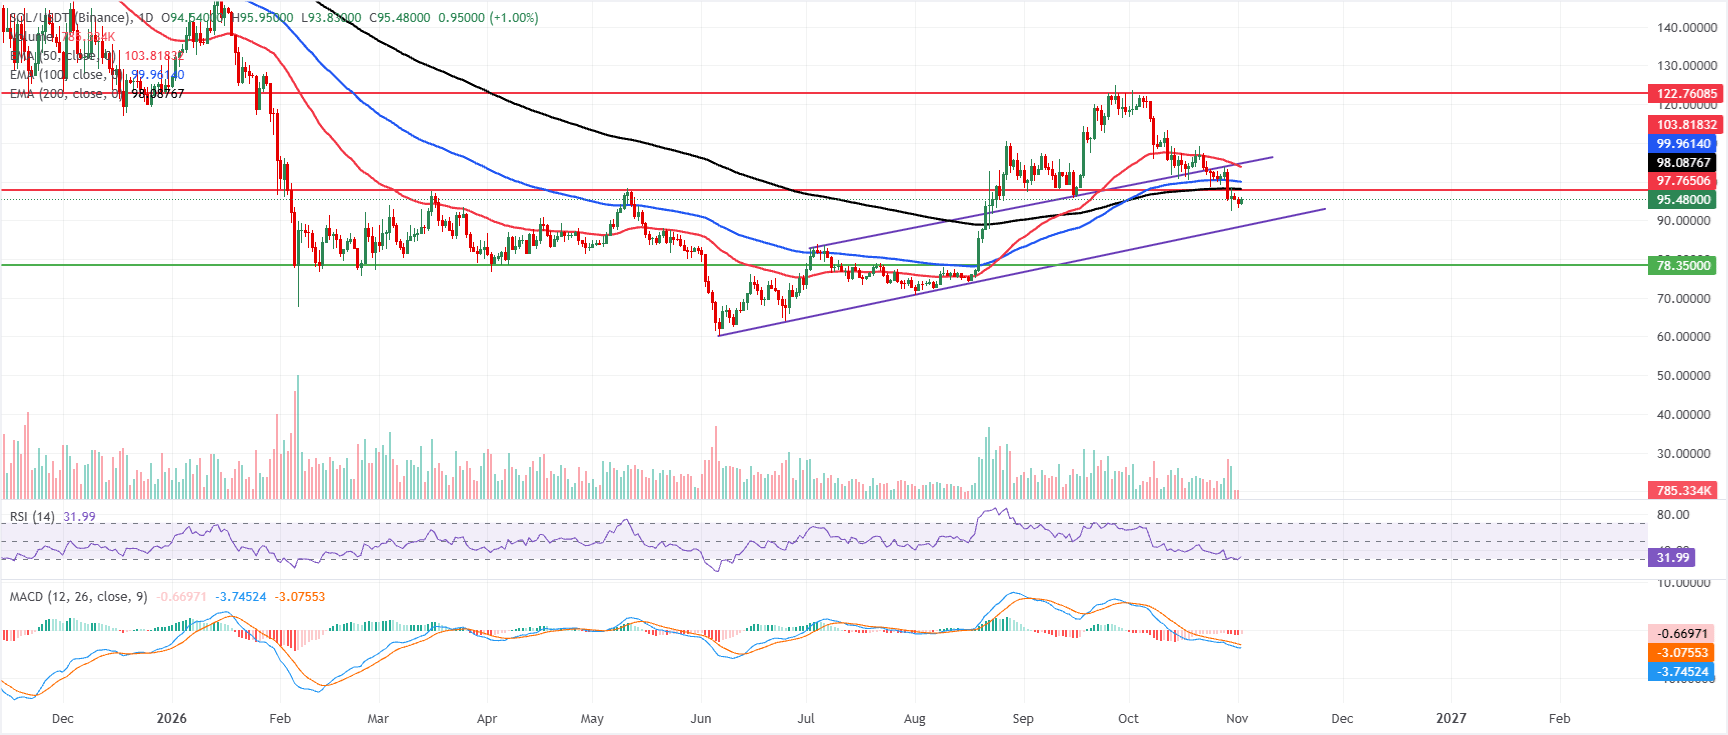
Solana price trades at $95.48 on Monday, maintaining a bearish near-term tone as it holds below the 50-day, 100-day and 200-day Exponential Moving Averages (EMAs) at $103.81, $99.96 and $98.08, respectively.
SOL has slipped back under prior horizontal resistance at $97.76, keeping it capped by a dense overhead cluster of EMAs, while the Relative Strength Index (RSI) near 31 hints at emerging but not yet decisive oversold conditions; the Moving Average Convergence Divergence (MACD) remains in negative territory with a subdued recovery, reinforcing downside pressure.
On the topside, initial resistance appears at the former barrier near $97.76, followed by the 200-day EMA at $98.08 and the 100-day EMA at $99.96, with the 50-day EMA at $103.81 marking a stronger cap ahead of a higher horizontal level at $122.76.
On the downside, the first notable support is aligned with the broken rising trendline region around $88.42, before a more substantial floor emerges at the horizontal support near $78.35, where buyers would be expected to show interest if the current decline extends.
(The technical analysis of this story was written with the help of an AI tool. Know more.)
บทความแนะนำ


