


Cardano Price Forecast: Hovers near key EMAs as cautious metrics leave rallies exposed to selling
- Cardano hovers near the key 50-day and 100-day EMAs around $0.200 on Monday after losses of over 8% in the previous week.
- Mixed derivatives metrics continue to cap ADA.
- The technical outlook suggests that bullish attempts remain vulnerable to selling pressure at higher levels.
Cardano (ADA) hovers around the key support zone of $0.200 on Monday after falling more than 8% in the previous week. Mixed derivatives metrics continue to limit bullish momentum, while the technical outlook suggests that recovery attempts remain vulnerable to selling pressure at higher levels for ADA.
Mixed derivatives metrics cap Cardano
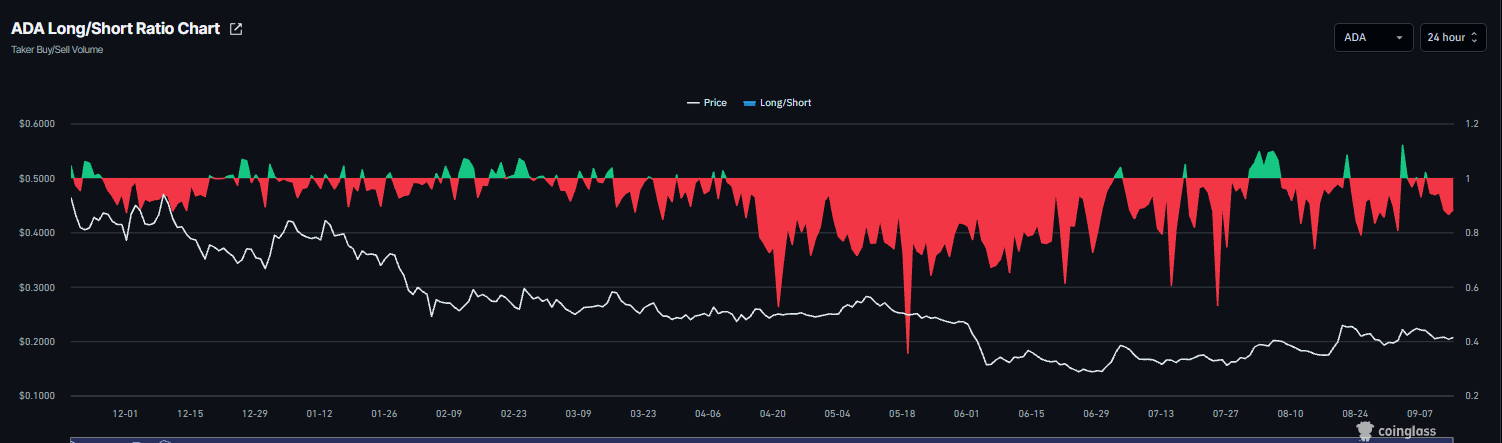
Cardano’s derivatives data shows a cautious outlook. CoinGlass’ long-to-short ratio for ADA reads 0.88 on Monday, nearing its lowest level in a month. A ratio below one indicates bearish sentiment, as traders bet that asset prices will fall.
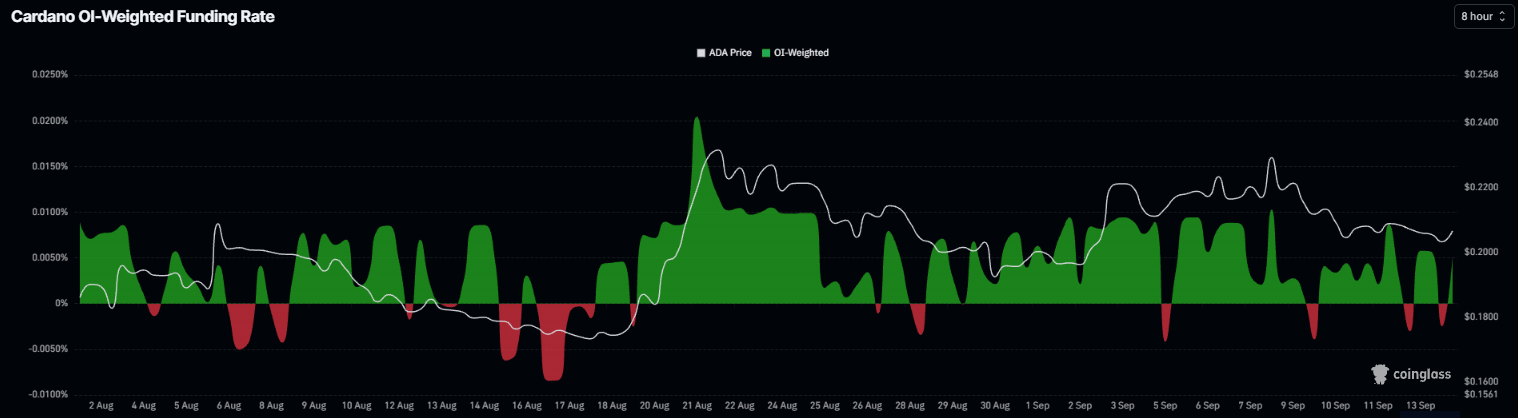
However, Cardano’s funding rate flipped positive on Monday, reading 0.0052%. This positive rate indicates longs are paying shorts and reflects a mild bullish bias among traders.
On-chain data signals cautious outlook
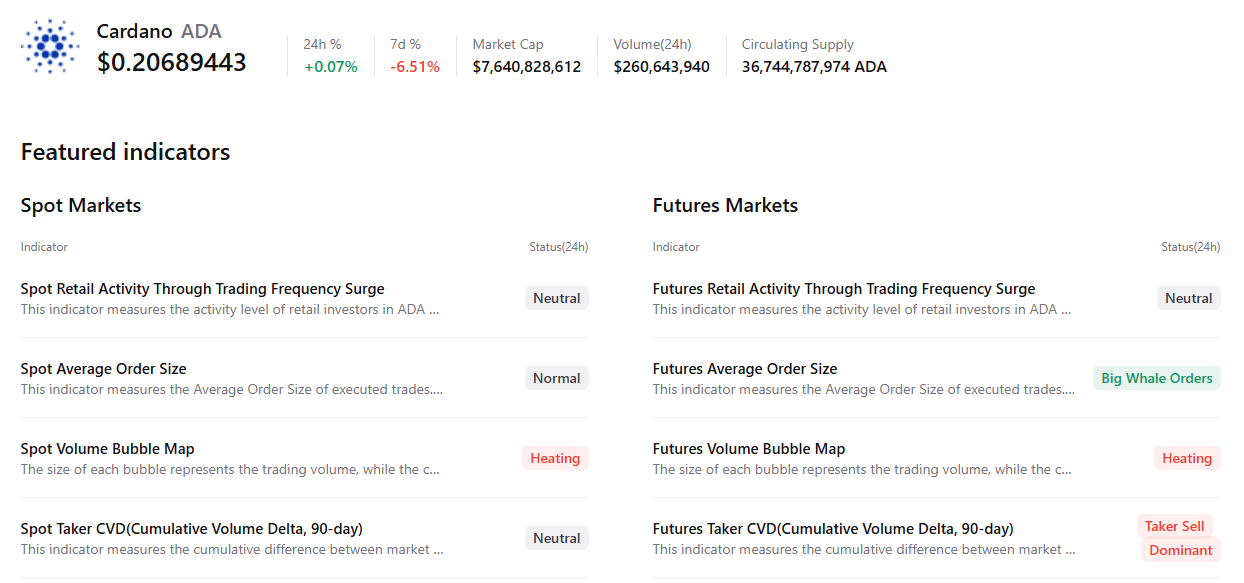
CryptoQuant’s summary data shows cautious signs for Cardano. ADA’s futures markets show large whale orders, but with sell-side dominance. Moreover, both spot and futures markets show heating conditions while other metrics remain neutral, highlighting a bearish, cautious sentiment bias among Cardano traders.
Cardano technical outlook: Recovery attempts remain vulnerable
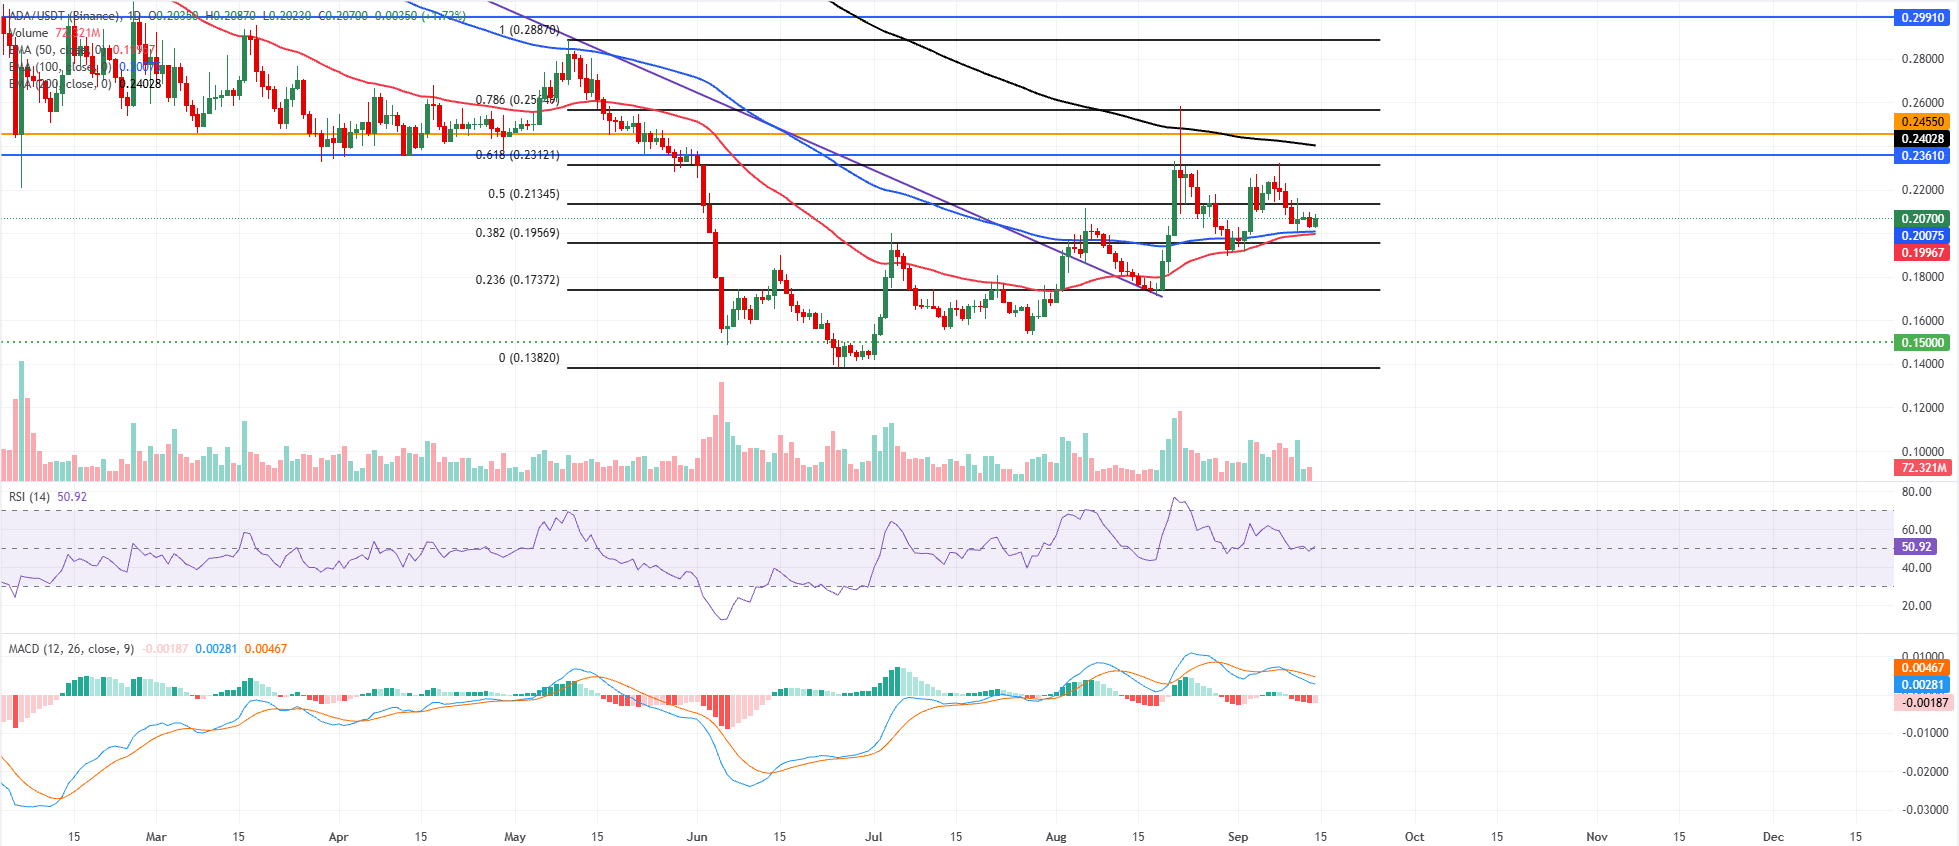
Cardano price trades at $0.207 on Monday, holding above the 50-day and 100-day exponential moving averages (EMAs) at $0.199 and $0.200, which lends the pair a mildly constructive tone despite the broader downtrend.
ADA is now sandwiched between these reclaimed short-term supports and a dense overhead layer led by the 50% retracement at $0.213 and the 61.8% Fibonacci retracement level at $0.231, while the 200-day EMA at $0.240 and horizontal caps at $0.236 and $0.245 reinforce a medium-term ceiling.
The Relative Strength Index (RSI) at 50 is essentially neutral, hinting at consolidation rather than strong directional pressure, and the Moving Average Convergence Divergence (MACD) indicator remains slightly negative, suggesting that bullish attempts are still vulnerable to selling at higher levels.
On the downside, immediate support is aligned at the 100-day and 50-day EMAs just above $0.200, followed by the 38.2% Fibonacci retracement at $0.195, which marks the first deeper pullback area before the next structural floors at $0.173 and $0.150.
On the topside, initial resistance emerges at the 50% retracement at $0.213, ahead of the 61.8% Fibonacci retracement level at $0.231 and the horizontal barrier at $0.236; a sustained break of this cluster would expose the 200-day EMA near $0.240 and the $0.245 cap, with a more ambitious objective only coming into view toward the distant horizontal barrier at $0.299.
(The technical analysis of this story was written with the help of an AI tool. Know more.)
บทความแนะนำ


