Solana Price Forecast: SOL nears key support zone as bears aim for a 20% downside

แหล่งที่มา Fxstreet
  • Solana is down 3% on Wednesday, approaching its 50-day EMA at $76.67.
  • SOL ETFs recorded inflows of $1.67 million on Tuesday, down from $8.36 million on Monday, signaling mild institutional demand.
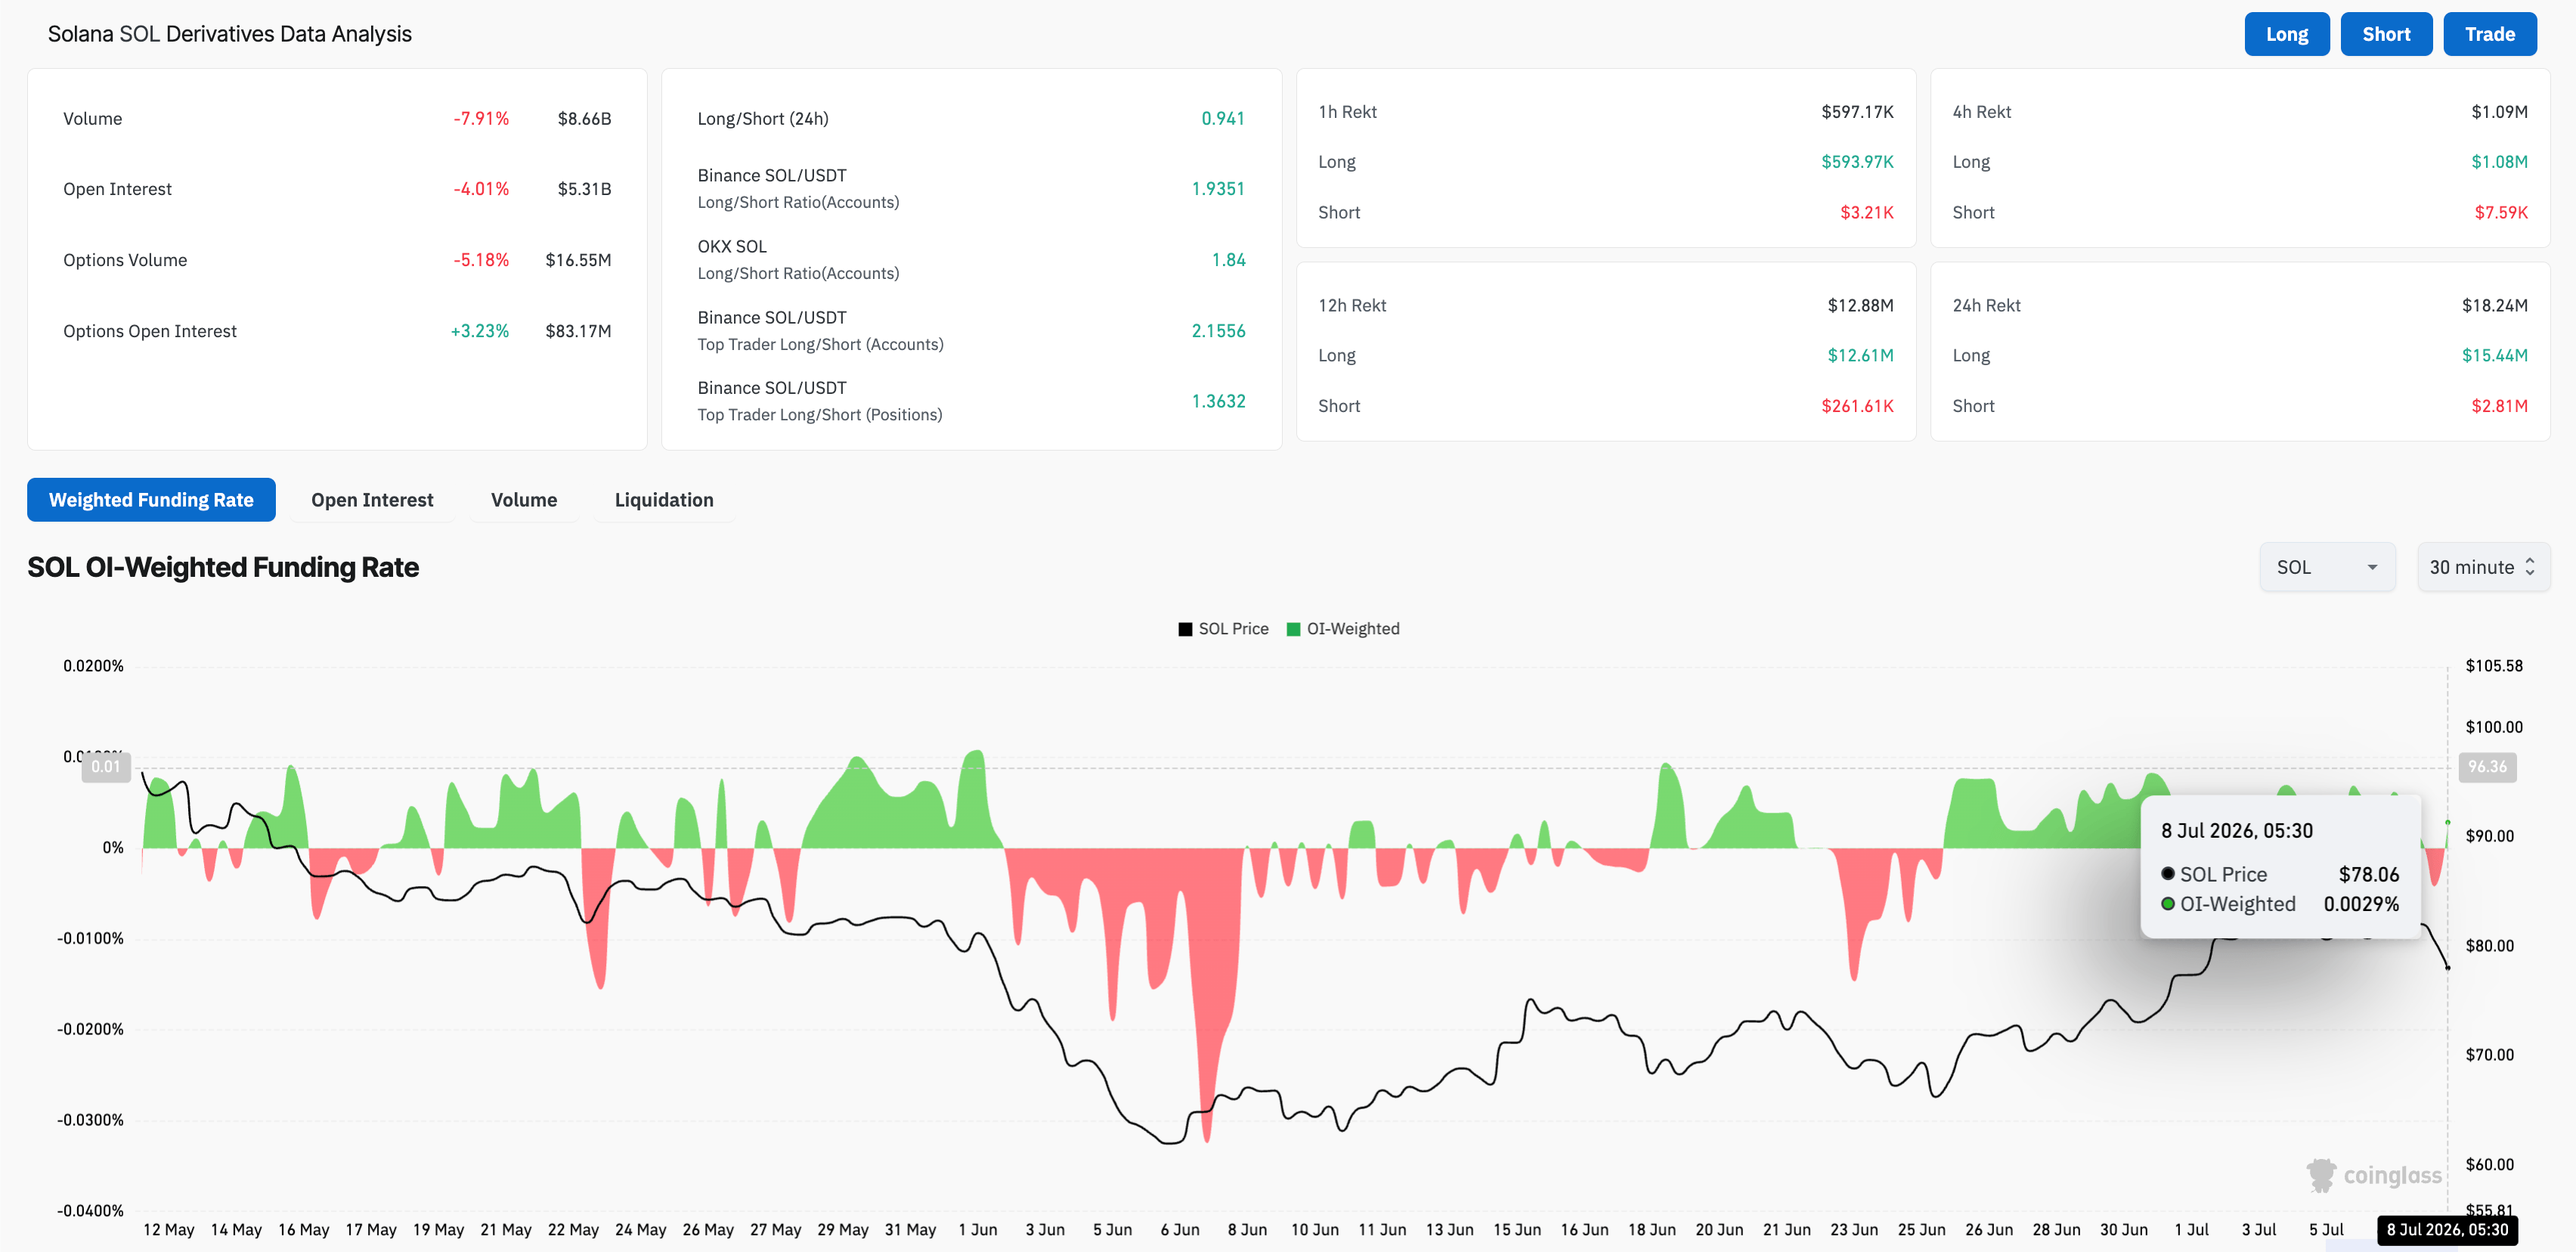
  • Retail demand for SOL is mixed, with fluctuating funding rates, while Open Interest dropped 4% over the last 24 hours.

Solana (SOL) price is down 3% on Wednesday, extending a bearish reversal after an overhead trendline capped the previous week’s recovery. Institutional inflows eased to $1.67 million on Tuesday, while declining Open Interest and fluctuating funding rates indicate mixed retail demand. The technical outlook for SOL indicates a bearish bias, with a risk of a decline of over 20% if price clears below the 50-day Exponential Moving Average (EMA) at $76.67.

Sellers regain strength as institutional buying eases

Solana is losing retail demand as broader market risk-off sentiment builds, while inflows into SOL-focused Exchange Traded Funds (ETFs) ease. CoinGlass data show SOL futures Open Interest (SOL) is down 4% in the last 24 hours to $5.31 billion, indicating a decline in open SOL contracts as risk-on sentiment eases among traders. At the same time, volume is down 8% to $8.66 billion, while funding rates stand at 0.0029%, up from -0.0042% the previous day, indicating near-term indecisiveness. 

On the institutional front, the SOL ETFs recorded inflows of $1.67 million on Tuesday, down from $8.36 million on Monday, signaling easing demand from institutional investors. 
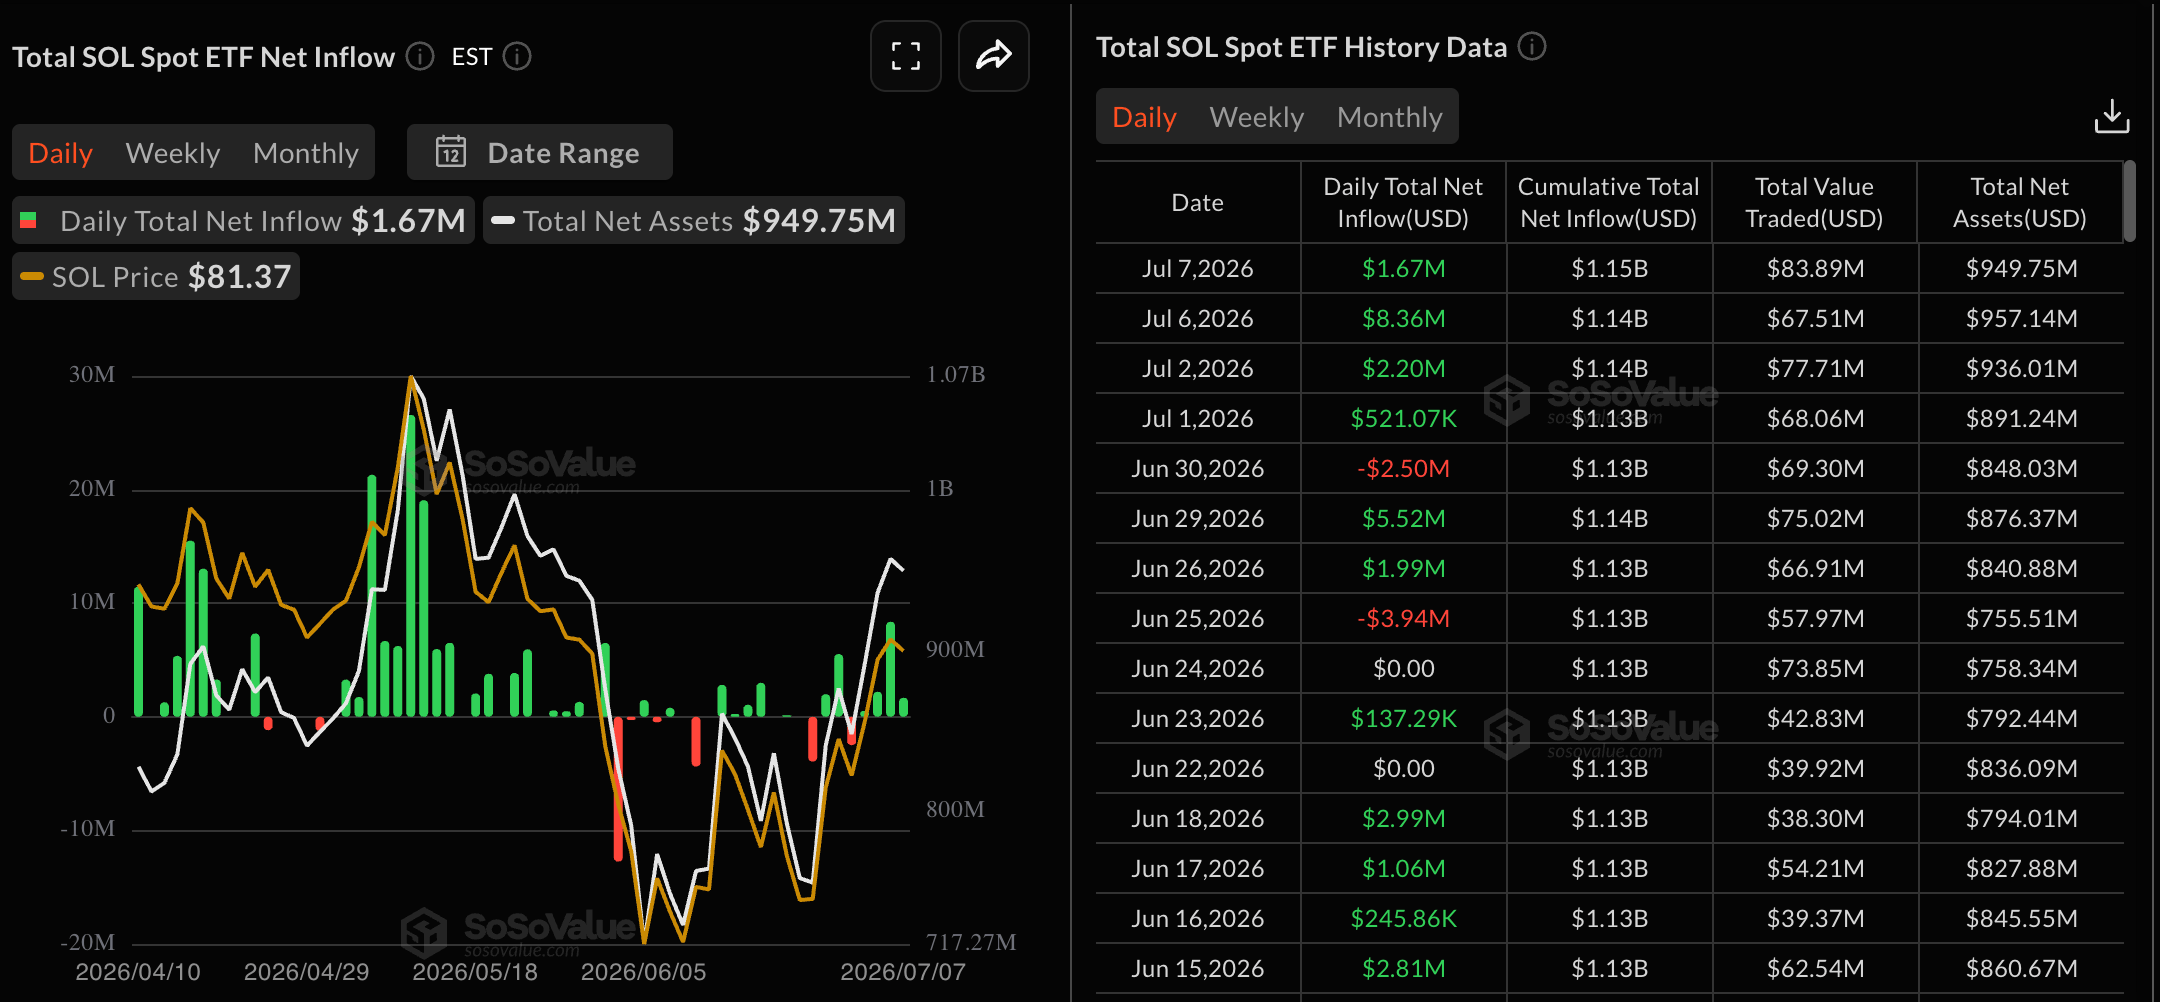
SOL ETFs data. Source: Sosovalue
SOL derivatives data. Source: CoinGlass

Solana risks a 20% drop below its 50-day EMA

Solana is down 3% on Wednesday, extending its decline from a long-term overhead trendline, which capped the previous week's recovery around $83.94. SOL remains capped well below the 200-day EMA at $95.51, which keeps the broader tone neutral rather than outright bullish

From a technical perspective, the 50-day EMA at $76.67, reinforced by the 50% retracement at $76.92, measured over the downswing from $98.41 to $60.13, serves as the immediate support zone for Solana. A decisive close below this zone could open the path toward the lower Fibonacci anchor at $60.13, indicating a downside of around 22%.

That said, the Moving Average Convergence Divergence (MACD) is descending toward its signal line, risking a bearish crossover as buying pressure wanes, while the Relative Strength Index (RSI) dips to 54 as buyers struggle to maintain momentum.

Chart Analysis SOL/USDT (Binance)
SOL/USDT daily price chart.

On the topside, initial resistance emerges at the downward resistance trendline at $83.94, where a sustained upmove would open the way toward the 200-day EMA at $95.51.

(The technical analysis of this story was written with the help of an AI tool. Know more.)

ข้อจำกัดความรับผิดชอบ: เพื่อการอ้างอิงเท่านั้น ผลการดำเนินงานในอดีตไม่ได้บ่งบอกถึงผลลัพธ์ในอนาคต
placeholder
หุ้นสหรัฐฯ ทำสถิติใหม่ เทครีบาวด์แรง ขณะ SET รอลุ้นฐาน 1,616 จุดทันทุกกระแสการเงิน สรุปข่าวเด่น Forex หุ้น ทองคำ คริปโตฯ และเศรษฐกิจรอบวัน วิเคราะห์แนวโน้มตลาดด้วยข้อมูลเชิงลึก อ่านง่าย เข้าใจไว อัปเดตล่าสุดที่นี่
ผู้เขียน  Mitrade
เมื่อวาน 06: 31
ทันทุกกระแสการเงิน สรุปข่าวเด่น Forex หุ้น ทองคำ คริปโตฯ และเศรษฐกิจรอบวัน วิเคราะห์แนวโน้มตลาดด้วยข้อมูลเชิงลึก อ่านง่าย เข้าใจไว อัปเดตล่าสุดที่นี่
placeholder
WTI พุ่งขึ้นกว่า 2% ขณะที่การโจมตีช่องแคบฮอร์มุซกระตุ้นความกังวลเรื่องอุปทานใหม่น้ำมันดิบเวสต์เทกซัสอินเตอร์มีเดียต (WTI) ปรับตัวสูงขึ้นในวันอังคาร เนื่องจากการโจมตีใหม่ใกล้ช่องแคบฮอร์มุซคุกคามการฟื้นตัวของการขนส่งที่เห็นในช่วงสัปดาห์ที่ผ่านมา หลังจากข้อตกลงสันติภาพชั่วคราวระหว่างสหรัฐฯ กับอิหร่าน ในขณะที่เขียนข่าวนี้ WTI ซื้อขายอยู่ที่ประมาณ 70.44 ดอลลาร์ เพิ่มขึ้นประมาณ 2.65% ในรายวัน
ผู้เขียน  FXStreet
8 ชั่วโมงที่แล้ว
น้ำมันดิบเวสต์เทกซัสอินเตอร์มีเดียต (WTI) ปรับตัวสูงขึ้นในวันอังคาร เนื่องจากการโจมตีใหม่ใกล้ช่องแคบฮอร์มุซคุกคามการฟื้นตัวของการขนส่งที่เห็นในช่วงสัปดาห์ที่ผ่านมา หลังจากข้อตกลงสันติภาพชั่วคราวระหว่างสหรัฐฯ กับอิหร่าน ในขณะที่เขียนข่าวนี้ WTI ซื้อขายอยู่ที่ประมาณ 70.44 ดอลลาร์ เพิ่มขึ้นประมาณ 2.65% ในรายวัน
placeholder
WTI ยืนเหนือ $72.00 ใกล้ระดับสูงสุดในรอบสองสัปดาห์ ท่ามกลางความตึงเครียดระหว่างสหรัฐฯ-อิหร่านใหม่West Texas Intermediate (WTI) – ราคาน้ำมันดิบอ้างอิงของสหรัฐฯ – กำลังประสบปัญหาในการใช้ประโยชน์จากการปรับตัวขึ้นอย่างแข็งแกร่งในวันก่อนหน้า และเข้าสู่กรอบการปรับฐานในกรอบระหว่างภาวะตลาดกระทิงใกล้ระดับสูงสุดในรอบสองสัปดาห์ที่แตะได้ในเซสชั่นเอเชียเมื่อวันพุธที่ผ่านมา น้ำมันดิบชนิดนี้ปัจจุบันเคลื่อนไหว
ผู้เขียน  FXStreet
5 ชั่วโมงที่แล้ว
West Texas Intermediate (WTI) – ราคาน้ำมันดิบอ้างอิงของสหรัฐฯ – กำลังประสบปัญหาในการใช้ประโยชน์จากการปรับตัวขึ้นอย่างแข็งแกร่งในวันก่อนหน้า และเข้าสู่กรอบการปรับฐานในกรอบระหว่างภาวะตลาดกระทิงใกล้ระดับสูงสุดในรอบสองสัปดาห์ที่แตะได้ในเซสชั่นเอเชียเมื่อวันพุธที่ผ่านมา น้ำมันดิบชนิดนี้ปัจจุบันเคลื่อนไหว
placeholder
ทองคำปรับตัวขึ้นเล็กน้อยท่ามกลางความต้องการดอลลาร์สหรัฐที่ซบเซา; เฟดที่เข้มงวดนโยบายการเงินและความตึงเครียดระหว่างสหรัฐฯ-อิหร่านจะจำกัดการปรับตัวขึ้นราคาทองคำ (XAUUSD) ปรับตัวขึ้นในช่วงเซสชั่นเอเชียวันพุธ และสําหรับตอนนี้ดูเหมือนว่าจะได้สิ้นสุดการอ่อนตัวลงติดต่อกันสองวันหลังจากร่วงลงไปต่ำกว่า $4,100 หรือระดับต่ำสุดรายสัปดาห์ที่แตะเมื่อวันก่อนหน้า
ผู้เขียน  FXStreet
4 ชั่วโมงที่แล้ว
ราคาทองคำ (XAUUSD) ปรับตัวขึ้นในช่วงเซสชั่นเอเชียวันพุธ และสําหรับตอนนี้ดูเหมือนว่าจะได้สิ้นสุดการอ่อนตัวลงติดต่อกันสองวันหลังจากร่วงลงไปต่ำกว่า $4,100 หรือระดับต่ำสุดรายสัปดาห์ที่แตะเมื่อวันก่อนหน้า
placeholder
สรุปตลาดวันนี้ Fed minutes กดตลาด หุ้น AI สะดุด น้ำมัน-ทองจับตา Hormuz ขณะ SET รอลุ้นเหนือ 1,604 จุดทันทุกกระแสการเงิน สรุปข่าวเด่น Forex หุ้น ทองคำ คริปโตฯ และเศรษฐกิจรอบวัน วิเคราะห์แนวโน้มตลาดด้วยข้อมูลเชิงลึก อ่านง่าย เข้าใจไว อัปเดตล่าสุดที่นี่
ผู้เขียน  Mitrade
4 ชั่วโมงที่แล้ว
ทันทุกกระแสการเงิน สรุปข่าวเด่น Forex หุ้น ทองคำ คริปโตฯ และเศรษฐกิจรอบวัน วิเคราะห์แนวโน้มตลาดด้วยข้อมูลเชิงลึก อ่านง่าย เข้าใจไว อัปเดตล่าสุดที่นี่
ตราสารที่เกี่ยวข้อง
goTop
quote