


Chainlink Price Forecast: Global FX infrastructure partnership fails to lift sentiment
- Chainlink remains under pressure, trading at $7.68 on Wednesday, down nearly 2% so far this week.
- Chainlink partners with several European and South Korean banks to modernize foreign exchange infrastructure.
- Mild ETF inflows offer limited support, while bearish derivatives positioning continues to cap LINK's upside potential.
Chainlink (LINK) trades near $7.68 at the time of writing on Wednesday, falling nearly 2% so far this week. LINK remains under pressure despite announcing a strategic working group with several multinational organizations across Europe and South Korea to modernize foreign exchange infrastructure. Meanwhile, modest inflows into Exchange Traded Funds (ETFs) suggest some institutional interest, but derivatives metrics continue to limit the token's prospects for recovery.
Chainlink announces global FX infrastructure initiative
Chainlink announced on Tuesday that it has formed a working group with several multinational groups across Europe and South Korea, collectively representing over $10 trillion in assets under management.
This collaborative initiative aims to modernize foreign exchange (FX) infrastructure, with a specific focus on evaluating the transition from traditional T+2 settlement cycles toward real-time T+0 settlement models.
“The initiative is designed to bring together dozens of global financial institutions from across Europe and South Korea to unlock the direct, atomic swap of regulated, fiat-referenced digital assets (including EUR and KRW stablecoins) by leveraging Chainlink's data, interoperability, and orchestration standards, along with FairSquareLab's onchain FX settlement technology,” said Chainlink in its press release.
This partnership is positive for Chainlink's native token, LINK, as it increases adoption and strengthens utility in the long term. However, in the short term, this news failed to lift traders' sentiment, with the LINK price remaining under pressure, trading below $8 as of Wednesday.
Mixed sentiment caps recovery
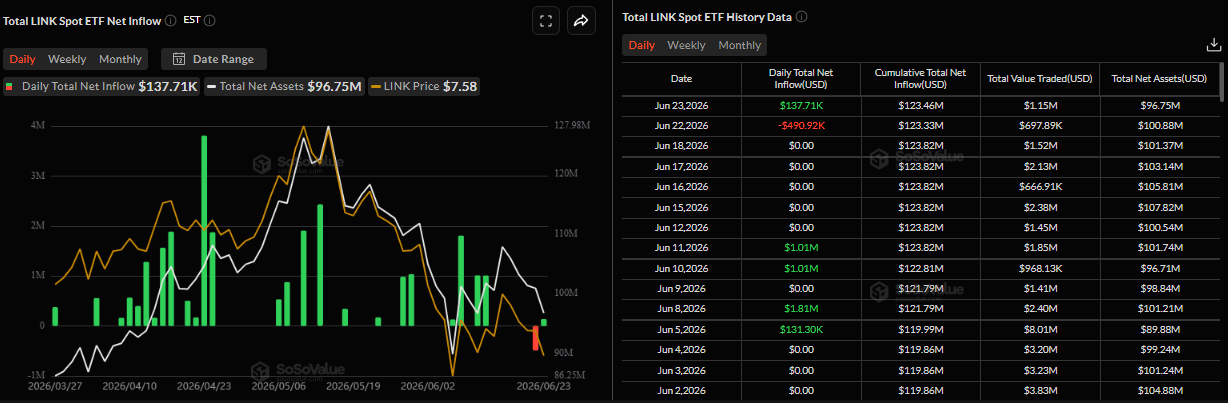
SoSoValue data shows some signs of optimism. Spot Exchange Traded Funds (ETFs) recorded a mild inflow of $137,710 on Tuesday after an outflow of $490,920 the previous day. If this inflow trend continues and intensifies, LINK could see a recovery ahead.
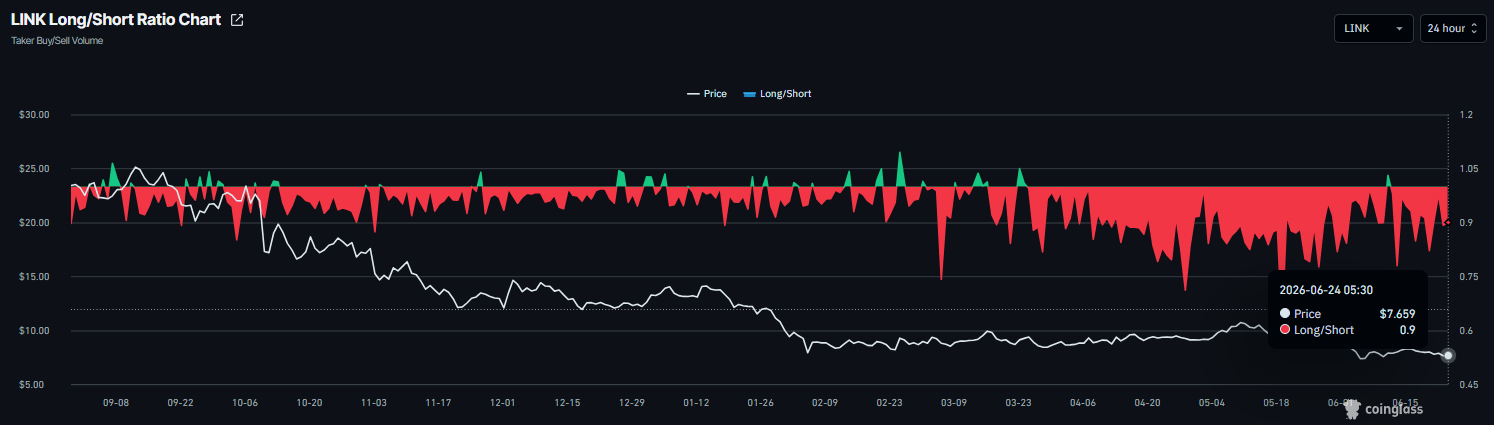
Derivatives metrics support a negative outlook for Chainlink. CoinGlass’ long-to-short ratio for LINK read 0.90 on Wednesday, nearing the lowest level over a month. The ratio being below one indicates bearish sentiment, as traders are betting that the assets’ prices will fall.
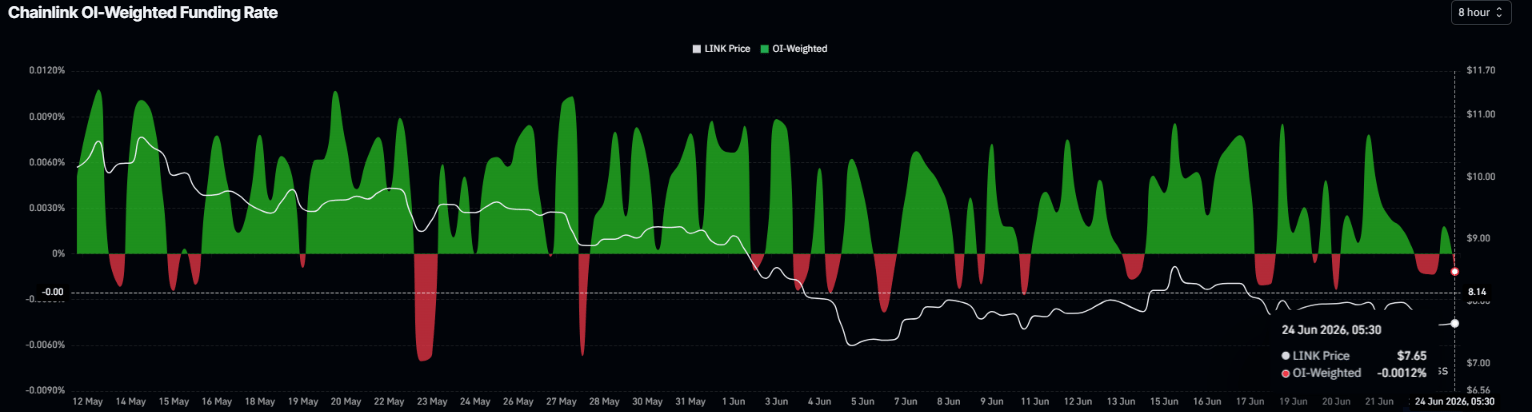
In addition, the funding rate turns negative on Wednesday, reading -0.0012%, indicating that shorts are paying longs and suggesting bearish sentiment.
Chainlink Price Forecast: Where is LINK heading?
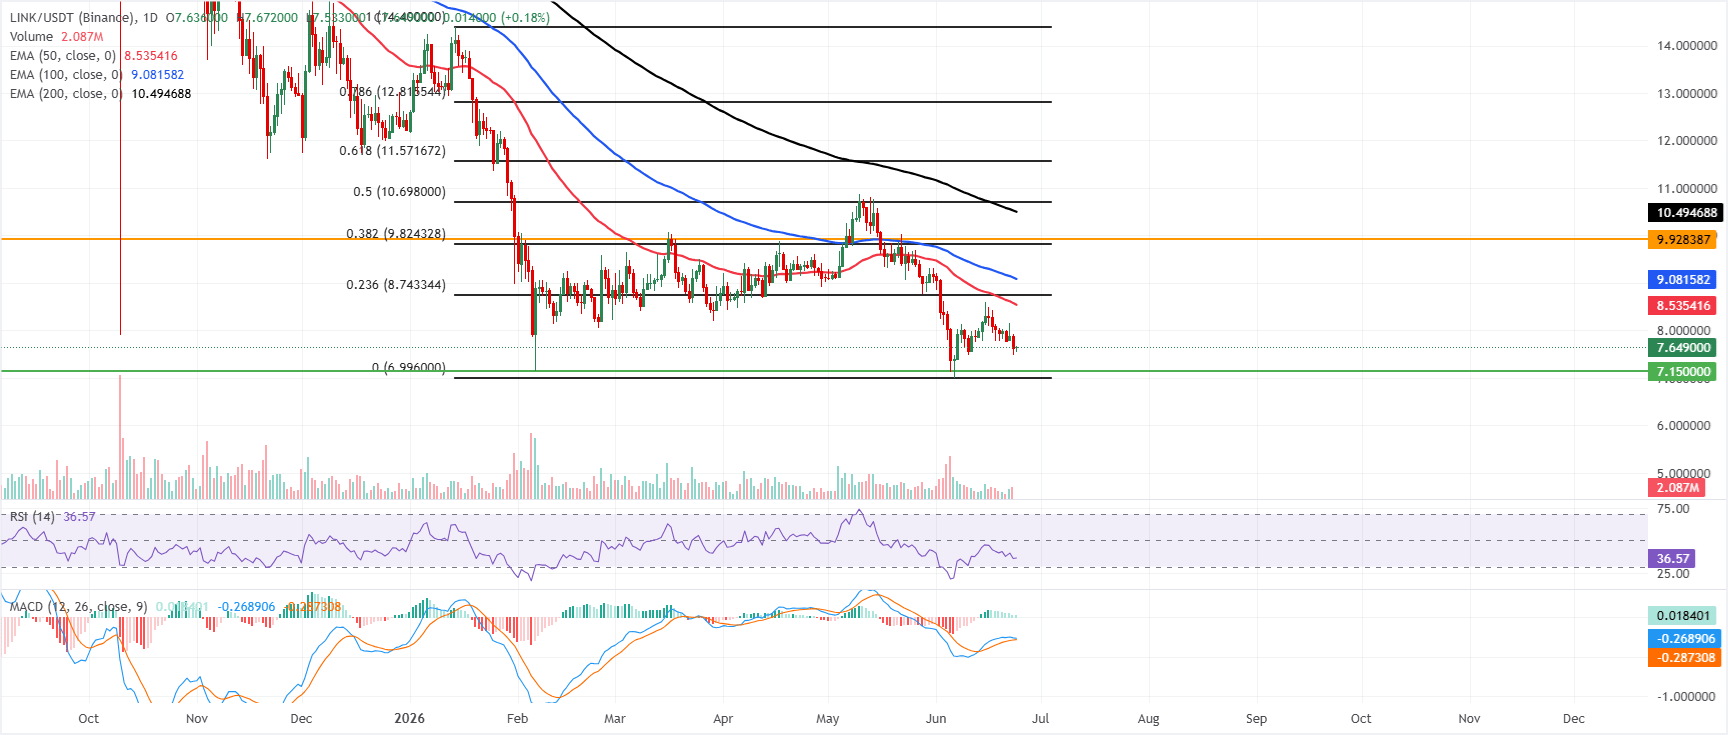
Chainlink trades at $7.64 on Wednesday, maintaining a bearish near-term bias as it holds well below the 50-day, 100-day, and 200-day Exponential Moving Averages (EMAs), clustered between about $8.54 and $10.49.
The recent recovery has stalled, with price still capped by this overhead band, while the Relative Strength Index (RSI) at around 36 remains in weak territory even as the Moving Average Convergence Divergence (MACD) inches slightly above the zero line, hinting at only modest countertrend interest so far.
On the topside, initial resistance is located at the 50-day EMA near $8.54, followed by the 23.6% Fibonacci retracement of the latest downswing at roughly $8.74 and the 100-day EMA near $9.08. Above these, a more significant supply zone aligns around the 38.2% Fibonacci retracement at $9.82 and the horizontal resistance at $9.93, ahead of the 200-day EMA near $10.49 and the 50% retracement at $10.70.
On the downside, immediate support emerges at the prior horizontal floor around $7.15, with the cycle low area near the Fibonacci anchor at $7.00 seen as the last notable defense before bears could attempt to extend the broader decline.
(The technical analysis of this story was written with the help of an AI tool.)
บทความแนะนำ


