

Ethereum Weekly Price Forecast: EF departures, sticky inflation weigh on ETH
- The Ethereum Foundation has recorded eight high-profile exits since February.
- Higher US inflation is weighing on ETH, with ETFs tied to the altcoin recording nine consecutive days of outflows.
- ETH eyes support near $2,000 after breaching the $2,108 level.
The Ethereum Foundation (EF) has come under pressure again following high-profile departures over the past few days, with researchers Carl Beek and Julian Ma announcing their exits on Monday. That extends the list of departures since February to eight key team members, including Tim Beiko, Josh Stark, Trent Van Epps, Alex Stokes, Barnabé Monnot and former co-executive director Tomasz Stanczak. Five of these exits were in May alone.
Although the departure messages from these members were sent in good faith, many community members have expressed concern that losing key protocol leaders at this time could complicate upcoming upgrades, such as Glamsterdam, which has been delayed to Q3 2026.
Others have speculated that these exits could stem from misalignment following the EF's recent restructuring initiatives.
The issue has sparked debate among prominent community members, with many demanding transparency from the EF. On top of this, Bankless co-founder David Hoffman, who once declared that 99% of his net worth was in ETH, said he sold his entire position. (Link)
Former EF member Dankrad Feist proposed founding a new organization, funded with a minimum of $1 billion in ETH, which will be largely staked to ensure it is economically aligned with Ethereum.
Asset manager Galaxy Digital outlined several steps the EF could take to address some of the issues, including focusing on a single ETH thesis and concentrating on areas where Ethereum already has a lead.
"Pick the verticals where Ethereum has a defensible moat (high-value DeFi, asset issuance, tokenized RWAs, stablecoin settlement, privacy-preserving financial infrastructure) and concentrate resources there. Ethereum can win the markets where it is credible," noted Galaxy Digital's VP of Research Lucas Tcheyan in a Friday X post. "Then commit to a single, legible thesis for ETH as an asset and stick to it. The current pitch is too diffuse. ETH cannot simultaneously be sold as ultrasound money, a tech-index proxy, L2 settlement collateral, institutional reserve asset, AI-agent money, privacy infrastructure, and generic 'world computer' exposure without the market eventually discounting all of it."
Amid all of this, ETH has also recorded major distributions over the past week, following strong US inflation and rising Treasury yields.
According to BitMine Chairman Thomas Lee, ETH's recent weakness can be traced to rising Oil prices' impact on inflation and, subsequently, the Federal Reserve's decision on interest rates.
The weakness is evident in US spot Ethereum exchange-traded funds (ETFs), which have posted nine consecutive days of net outflows amid a roughly 12% decline in ETH prices over the past three weeks.
Ethereum Price Forecast: ETH eyes support near $2,000
On the daily chart, ETH is extending a bearish phase as price holds beneath the 20-, 50- and 100-day Exponential Moving Averages (EMAs) at $2,208, $2,236 and $2,321, respectively. This alignment of descending overhead EMAs suggests rallies are likely to face supply.
Meanwhile, momentum readings indicate oversold conditions, with the Relative Strength Index (RSI) hovering near 31 and the Stochastic Oscillator (Stoch) deeply depressed, suggesting downside pressure persists, but the sell-off is becoming stretched.
On the topside, initial resistance emerges at the recent horizontal cap around $2,107, followed by a tight confluence between the 20-day EMA and the horizontal barrier at $2,211, with the 50- and 100-day EMAs reinforcing a broader supply zone before the next notable ceiling at $2,388.
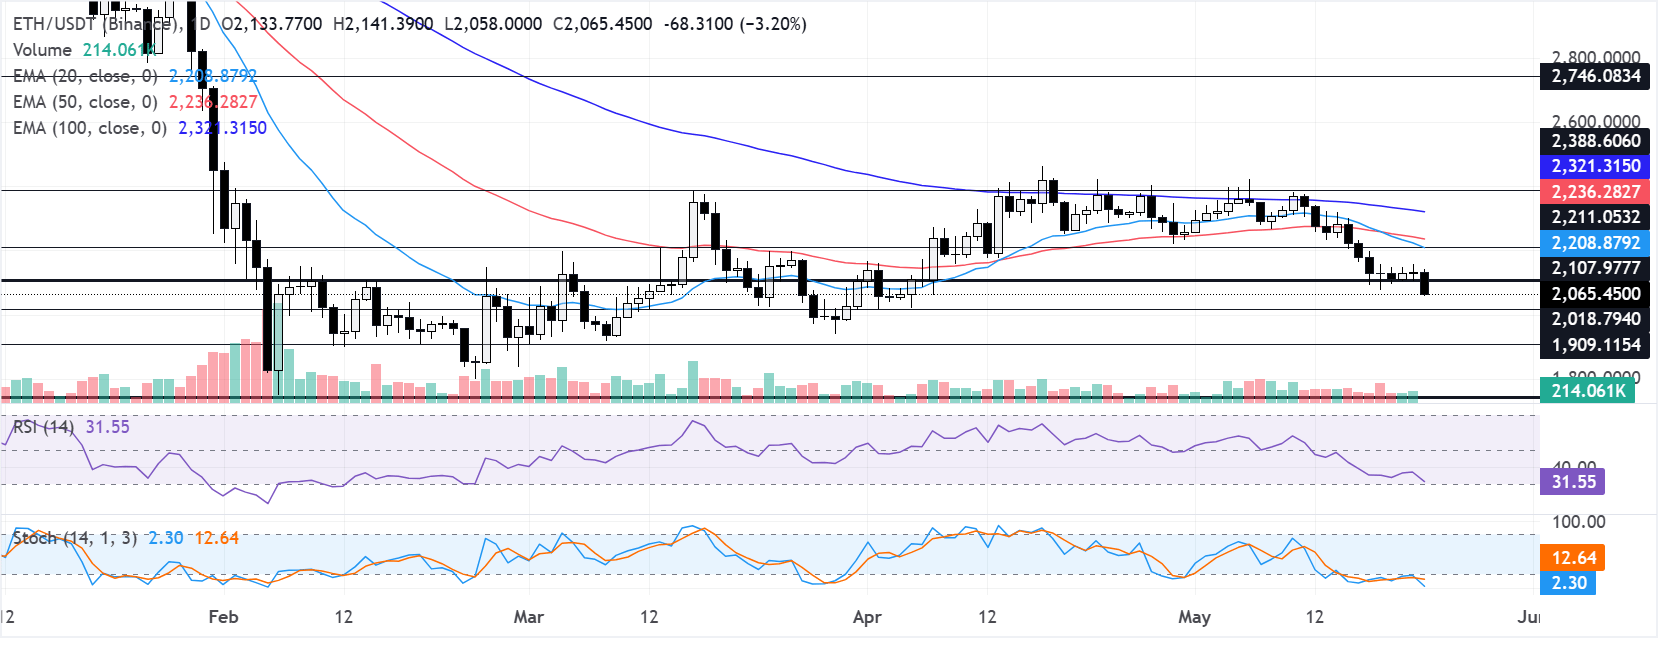
On the downside, immediate support is seen at $2,018, ahead of a more significant floor near $1,909. A break there would expose the lower supports at $1,741, then $1,524 and $1,404 if bearish momentum accelerates.
(The technical analysis of this story was written with the help of an AI tool.)
บทความแนะนำ


