

Altcoins to watch: AI tokens TAO and FET rally as derivatives data signal bullish momentum
- Bittensor extends its gains on Tuesday after rallying over 11% in the previous day.
- Artificial Superintelligence Alliance trades in green after closing above the key resistance zone.
- Derivatives data for both altcoins suggest growing bullish momentum, with rising open interest backing the bullish outlook.
Bittensor (TAO) and Artificial Superintelligence Alliance (FET) are emerging as key cryptocurrencies to watch on Tuesday, as both AI (Artificial Intelligence) tokens extend gains after soaring high in the previous week. Improving sentiment from the derivatives markets also supports bullish sentiment for both AI tokens, which traders should closely monitor this week.
TAO and FET open interest signal bullish outlook
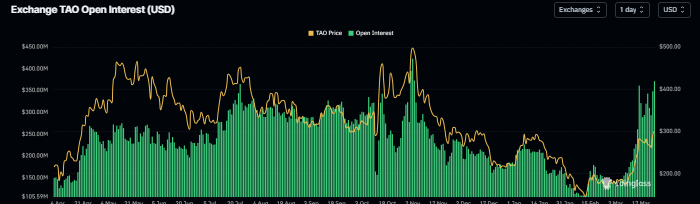
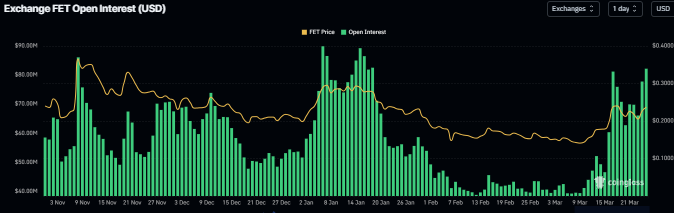
CoinGlass OI for TAO and FET surged to $371.49 million and $82.12 million on Tuesday, respectively. For TAO, the current OI is at its highest level since early November, while for FET, it is at its highest level since mid-January. These increasing OI levels represent new or additional money entering the market and new buying, which could fuel the current TAO and FET price rally.
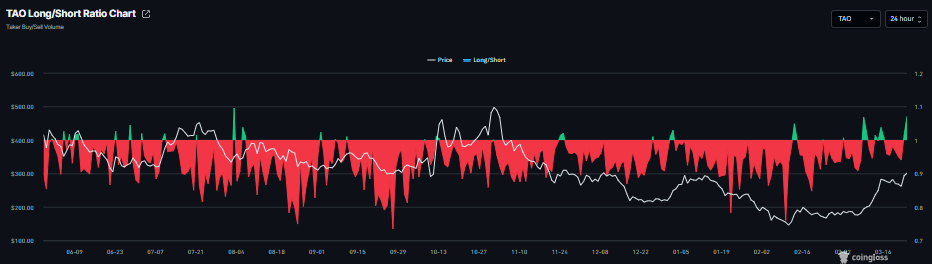
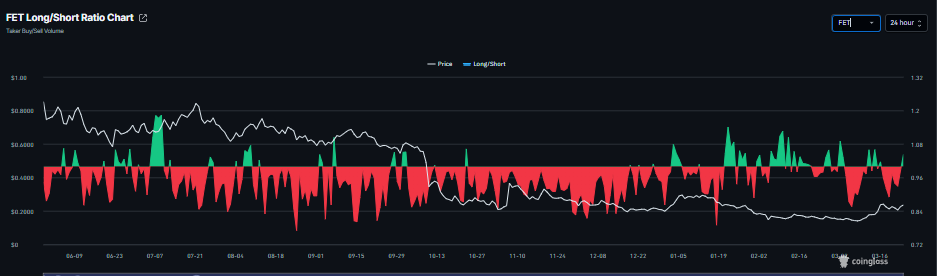
In addition, CoinGlass long-to-short ratio for TAO and FET stands at 1.07 and 1.04, respectively. The ratio above one indicates bullish sentiment as more traders are betting on the asset price to rally.
Some other signs of optimism
The overall crypto market began the week with an improving risk appetite. On Monday, US President Donald Trump directed the Department of War to suspend attacks on Iran’s power plants and energy infrastructure, citing productive talks between the two nations.
These easing developments amid the ongoing Middle East war boosted risk sentiment, with US equities closing positive on Monday, while risky assets such as Bitcoin gained nearly 5%. Meanwhile, both AI tokens, TAO and FET, followed BTC’s lead and joined the upward move.
Moreover, praise for industry leaders backing decentralized AI in the previous report also supports optimism for this sector’s tokens.
Bittensor Price Forecast: TAO bulls are in control of the momentum
Bittensor price is extending its gains, trading above $305.50 on Tuesday. The near‑term bias is cautiously bullish as price pushes further above the 50-day, 100-day and 200‑day Exponential moving Averages, confirming a recovery phase from the $140s low within the broader Fibonacci structure measured from $539.40 to $142.80.
The break above the long‑running descending resistance trendline, with the break zone near $184.62 now well behind price, underlines improving trend conditions, while the Relative Strength Index (RSI) on the daily chart at 74 holds in overbought territory, signaling strong but stretched upside momentum. The Moving Average Convergence Divergence (MACD) line stands above the signal line and remains in positive territory with a firm histogram, reinforcing persistent bullish pressure despite the extended run.
Immediate support emerges near the 38.2% Fibonacci retracement at $294.30, which aligns closely with the recent breakout zone and sits just below the current price, followed by the prior horizontal support reference at $298.20, now acting as a nearby buffer on minor dips. Below that, additional downside protection is seen toward the 23.6% retracement at $236.40, where the rising 50‑day EMA would increasingly lend trend support if a deeper correction unfolds.
On the topside, initial resistance comes in around the recent swing region just above $305.50, with the next notable technical barrier only reappearing much higher toward the $341.10 level at the 50% retracement, where profit‑taking could slow the advance if bulls extend the move.
-1774321175307-1774321175308.png)
Artificial Superintelligence Alliance Price Forecast: FET aiming for higher highs
Artificial Superintelligence Alliance’s price is trading above $0.237 on Tuesday. The near-term bias is cautiously bullish after FET broke above the long-running descending trendline resistance near $0.189 and extended away from the 50-day EMA around $0.190, while also reclaiming the 100-day EMA near $0.220.
Momentum conditions support upside pressure, with the RSI on the daily chart holding in the mid‑60s and the MACD line staying above its signal and above the zero line, although the recent flattening of MACD hints at moderating upside after the sharp rally.
Immediate support is seen at the prior breakout area around $0.192, where the 50-day EMA converges, and a break below this zone would expose the next downside area toward the 23.6% Fibonacci retracement at $0.320 measured from the $0.113 low to the $0.991 high as a distant upside reference rather than an immediate pivot.
On the topside, initial resistance stands at $0.240, followed by the horizontal barrier at $0.378 that aligns with the broader corrective structure below the 38.2% retracement at $0.448; clearance of $0.240 would keep buyers in control and maintain focus on progressively higher levels within that broader recovery path.
-1774321213833-1774321213834.png)
(The technical analysis of this story was written with the help of an AI tool.)
บทความแนะนำ


