

Top Crypto Losers: BCH, HYPE, PUMP extend losses as Bitcoin drops below $64,000
- Bitcoin Cash trades below $500 on Tuesday after a 13% fall on the previous day.
- Hyperliquid extends its decline by 1% on Tuesday for the fourth consecutive day after Monday’s 9% drop.
- Pump.fun drops below a crucial psychological support level following an 11% decline on Monday.
Altcoins, including Bitcoin Cash (BCH), Hyperliquid (HYPE), and Pump.fun (PUMP), are leading losses over the last 24 hours as Bitcoin falls below $64,000 on Tuesday. The technical outlook for BCH, HYPE, and PUMP flags downside risk amid broader market selling.
The broader cryptocurrency market remains under pressure as the US President Donald Trump seeks new legal tracks under national security concerns to impose new tariffs. Additionally, the US stock market closed Monday in the red.
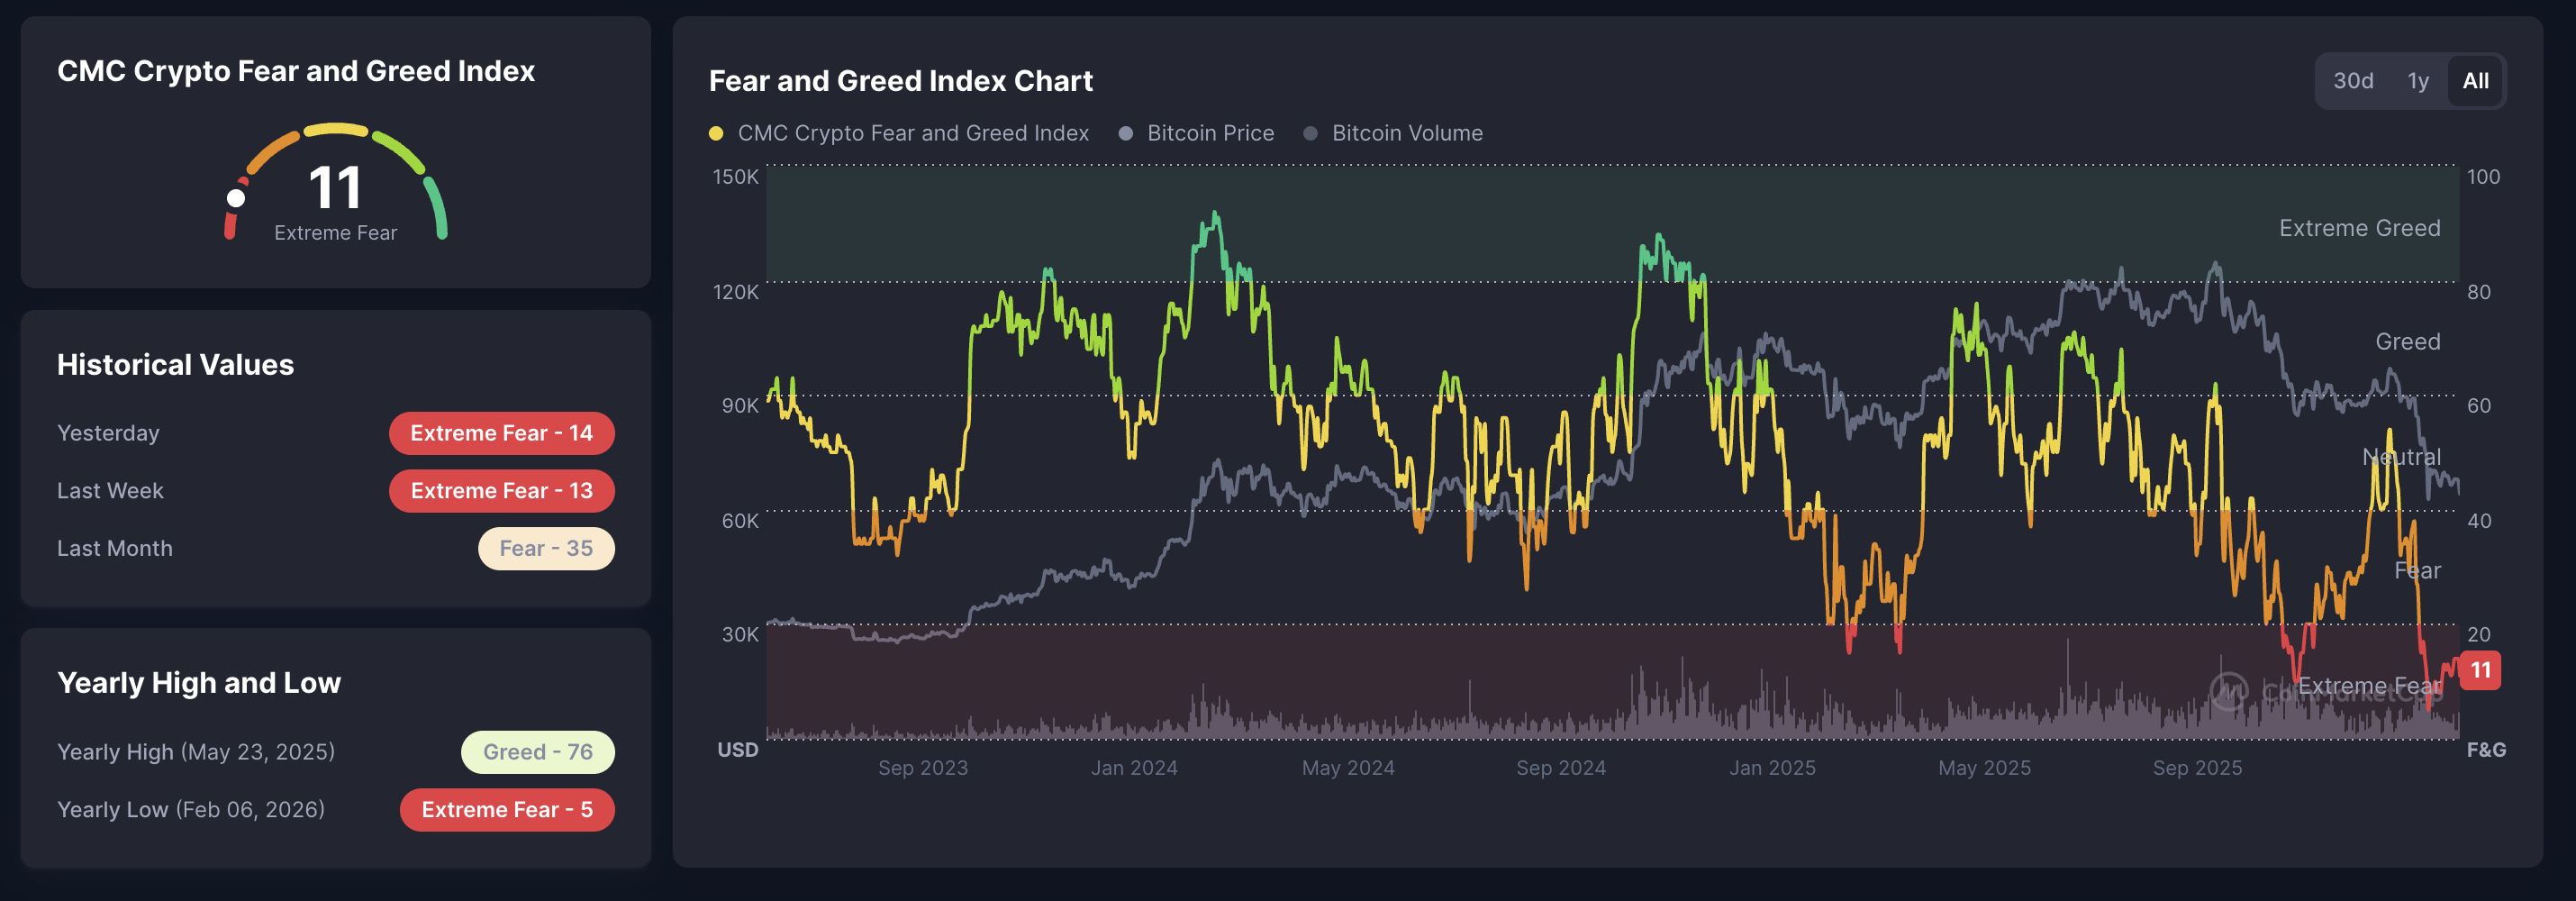
CoinMarketCap’s Fear and Greed Index at 11 flashes extreme fear in the market, reaffirming that sellers are dominant.
Bitcoin Cash falls below $500
Bitcoin Cash is trading below $500 at the time of writing on Tuesday, following a 13% drop on the previous day. The altcoin is trading below its 200-day Exponential Moving Average (EMA) at $544, while the downward-sloping 50-day EMA is at $555, risking a potential death cross.
The path of least resistance in BCH points to the $443 support level, which aligns with the October 17 low.
The technical indicators of the daily chart suggest a bearish shift in trend momentum. The Relative Strength Index (RSI) is down to 36, closing toward the oversold region as selling pressure increases. At the same time, the Moving Average Convergence Divergence (MACD) crosses below its signal line, flashing a bearish crossover.
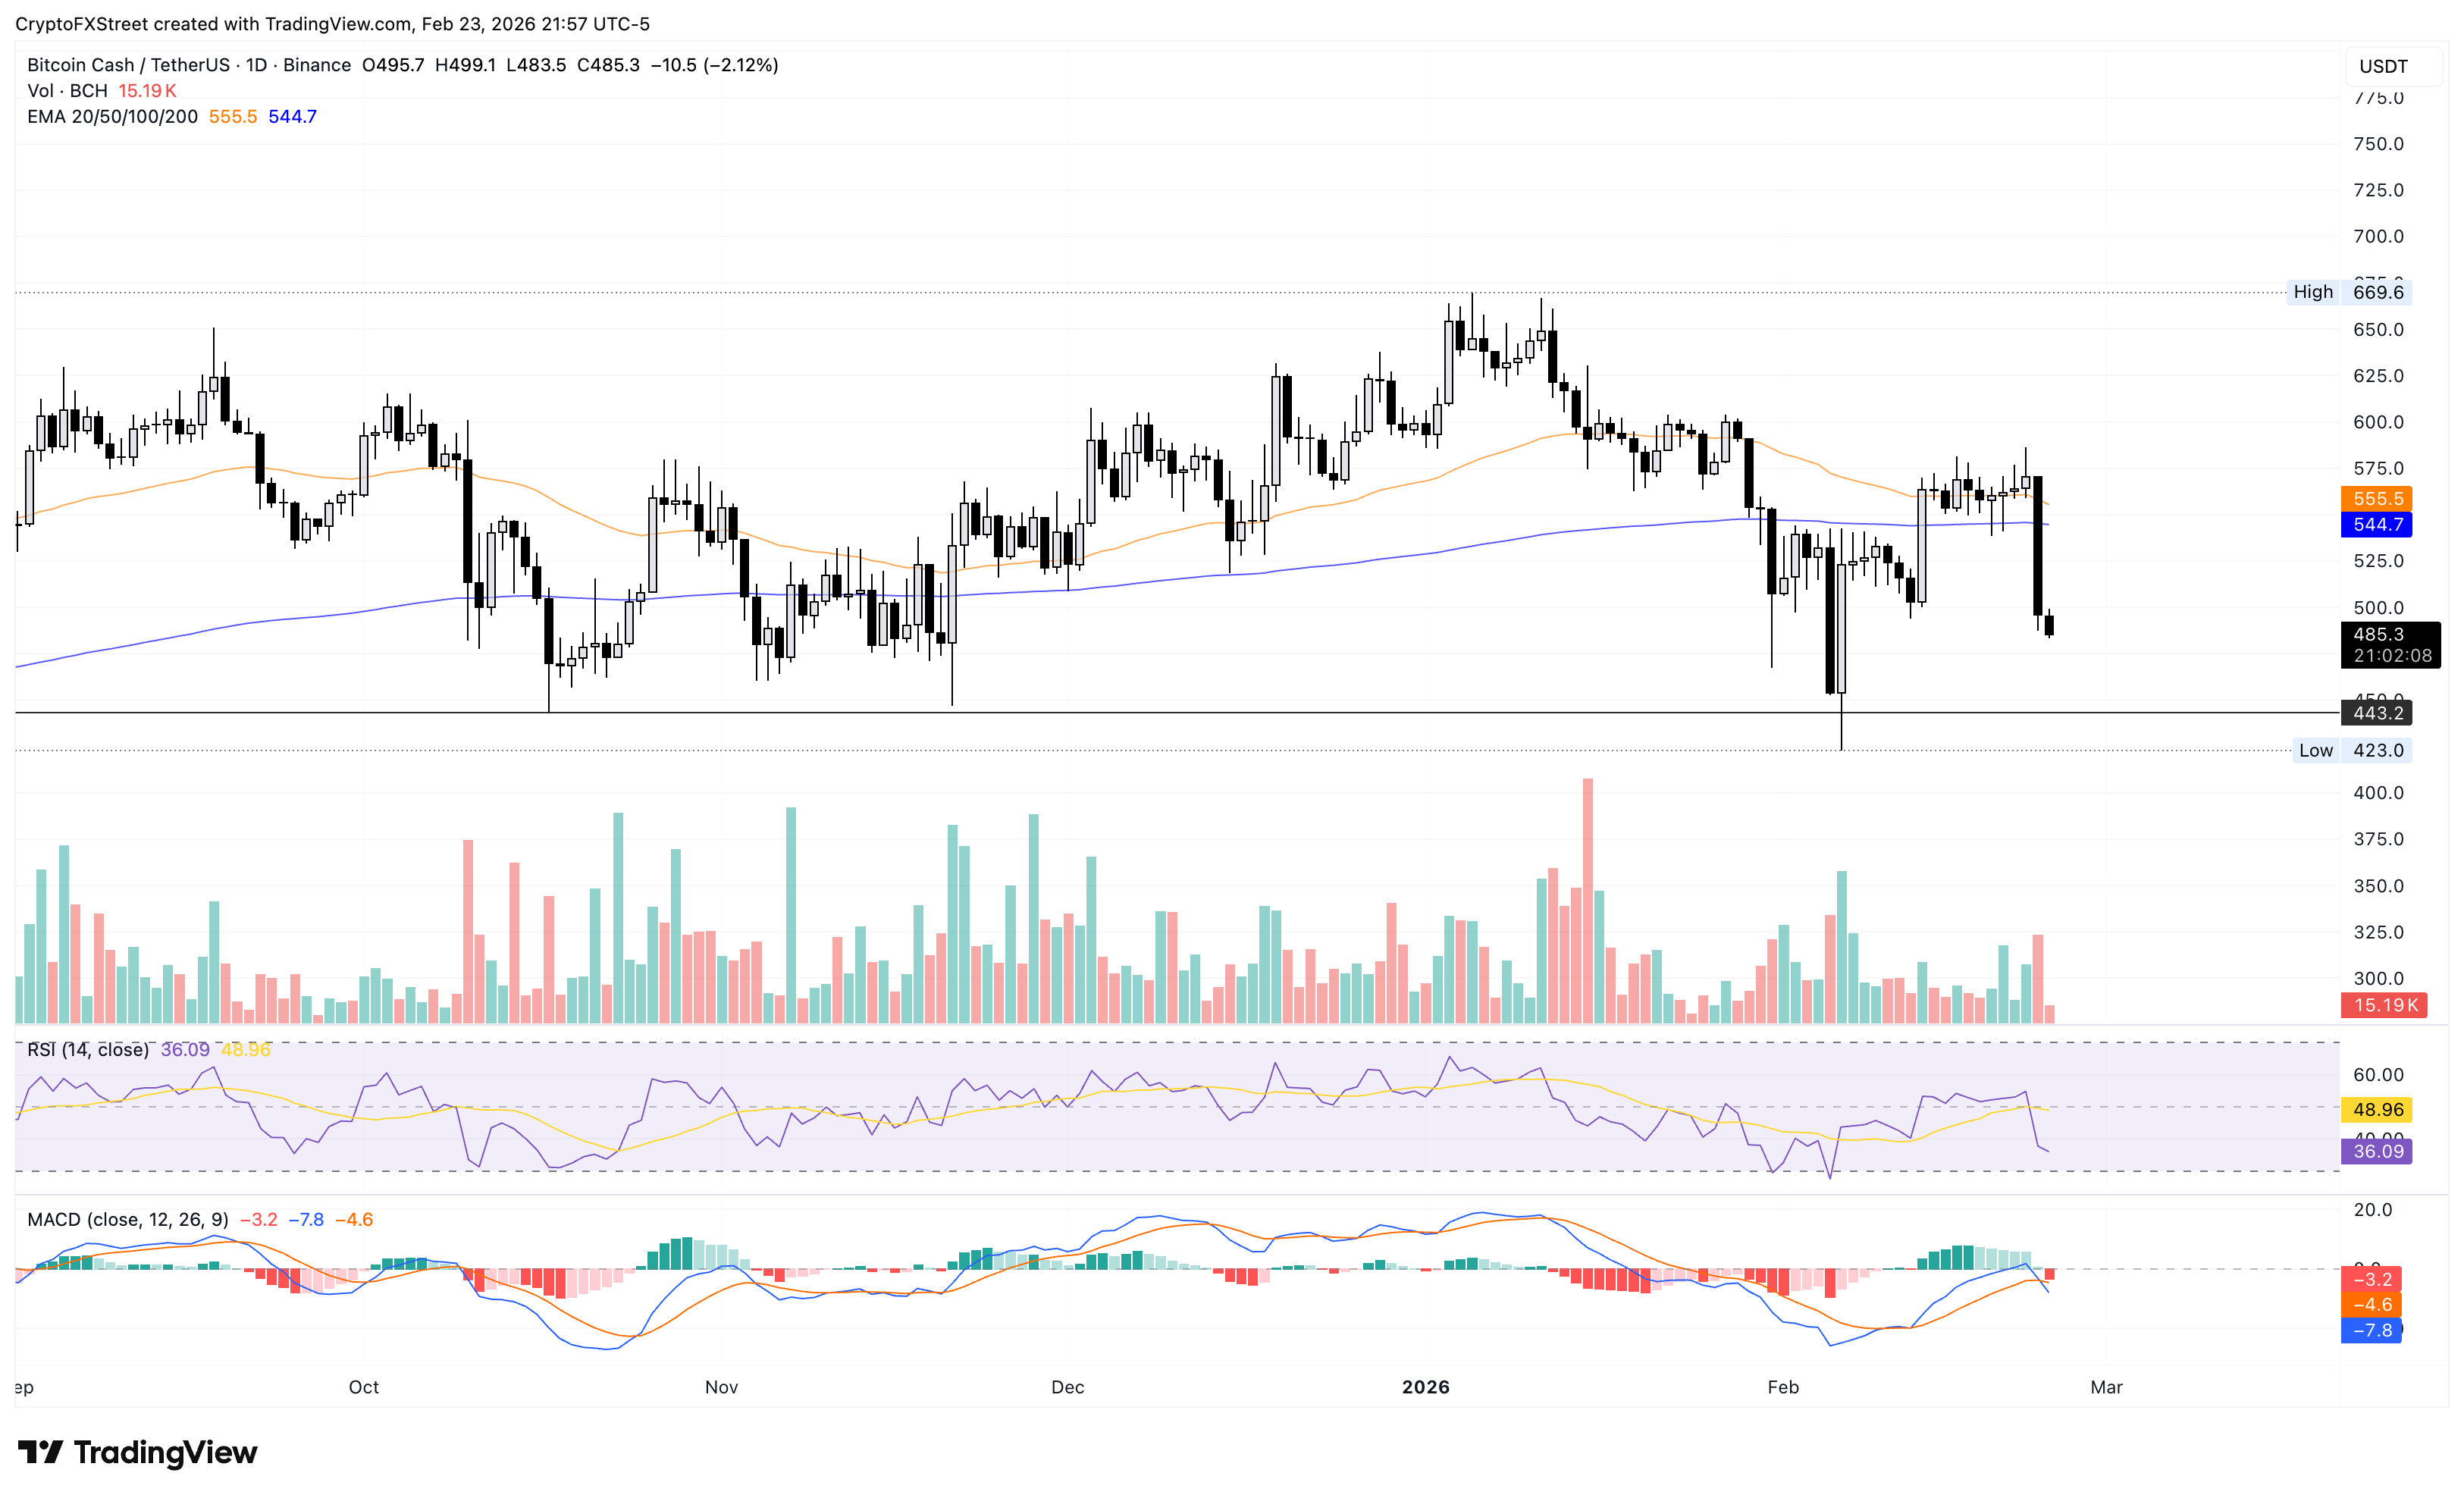
If Bitcoin Cash clears the $500 psychological level with a decisive daily close, it could ease downside pressure, lifting the recovery to the 200-day EMA at $544.
Hyperliquid loses ground as selling pressure intensifies
Hyperliquid is trading below $26 at the time of writing on Tuesday, extending the decline after a 9% drop on the previous day. The HYPE token declines for the fourth consecutive day, trades significantly below the 50-day EMA at $29.08 and the 200-day EMA at $32.37, reaffirming the bearish bias.
The RSI is at 38 on the daily chart, extending the downward trend with further room before reaching the oversold region. The MACD and its signal line extend a steady decline as the bearish histograms widen.
The immediate support levels for HYPE are the December 21 low at $23.58 and the October 10 low at $20.82.
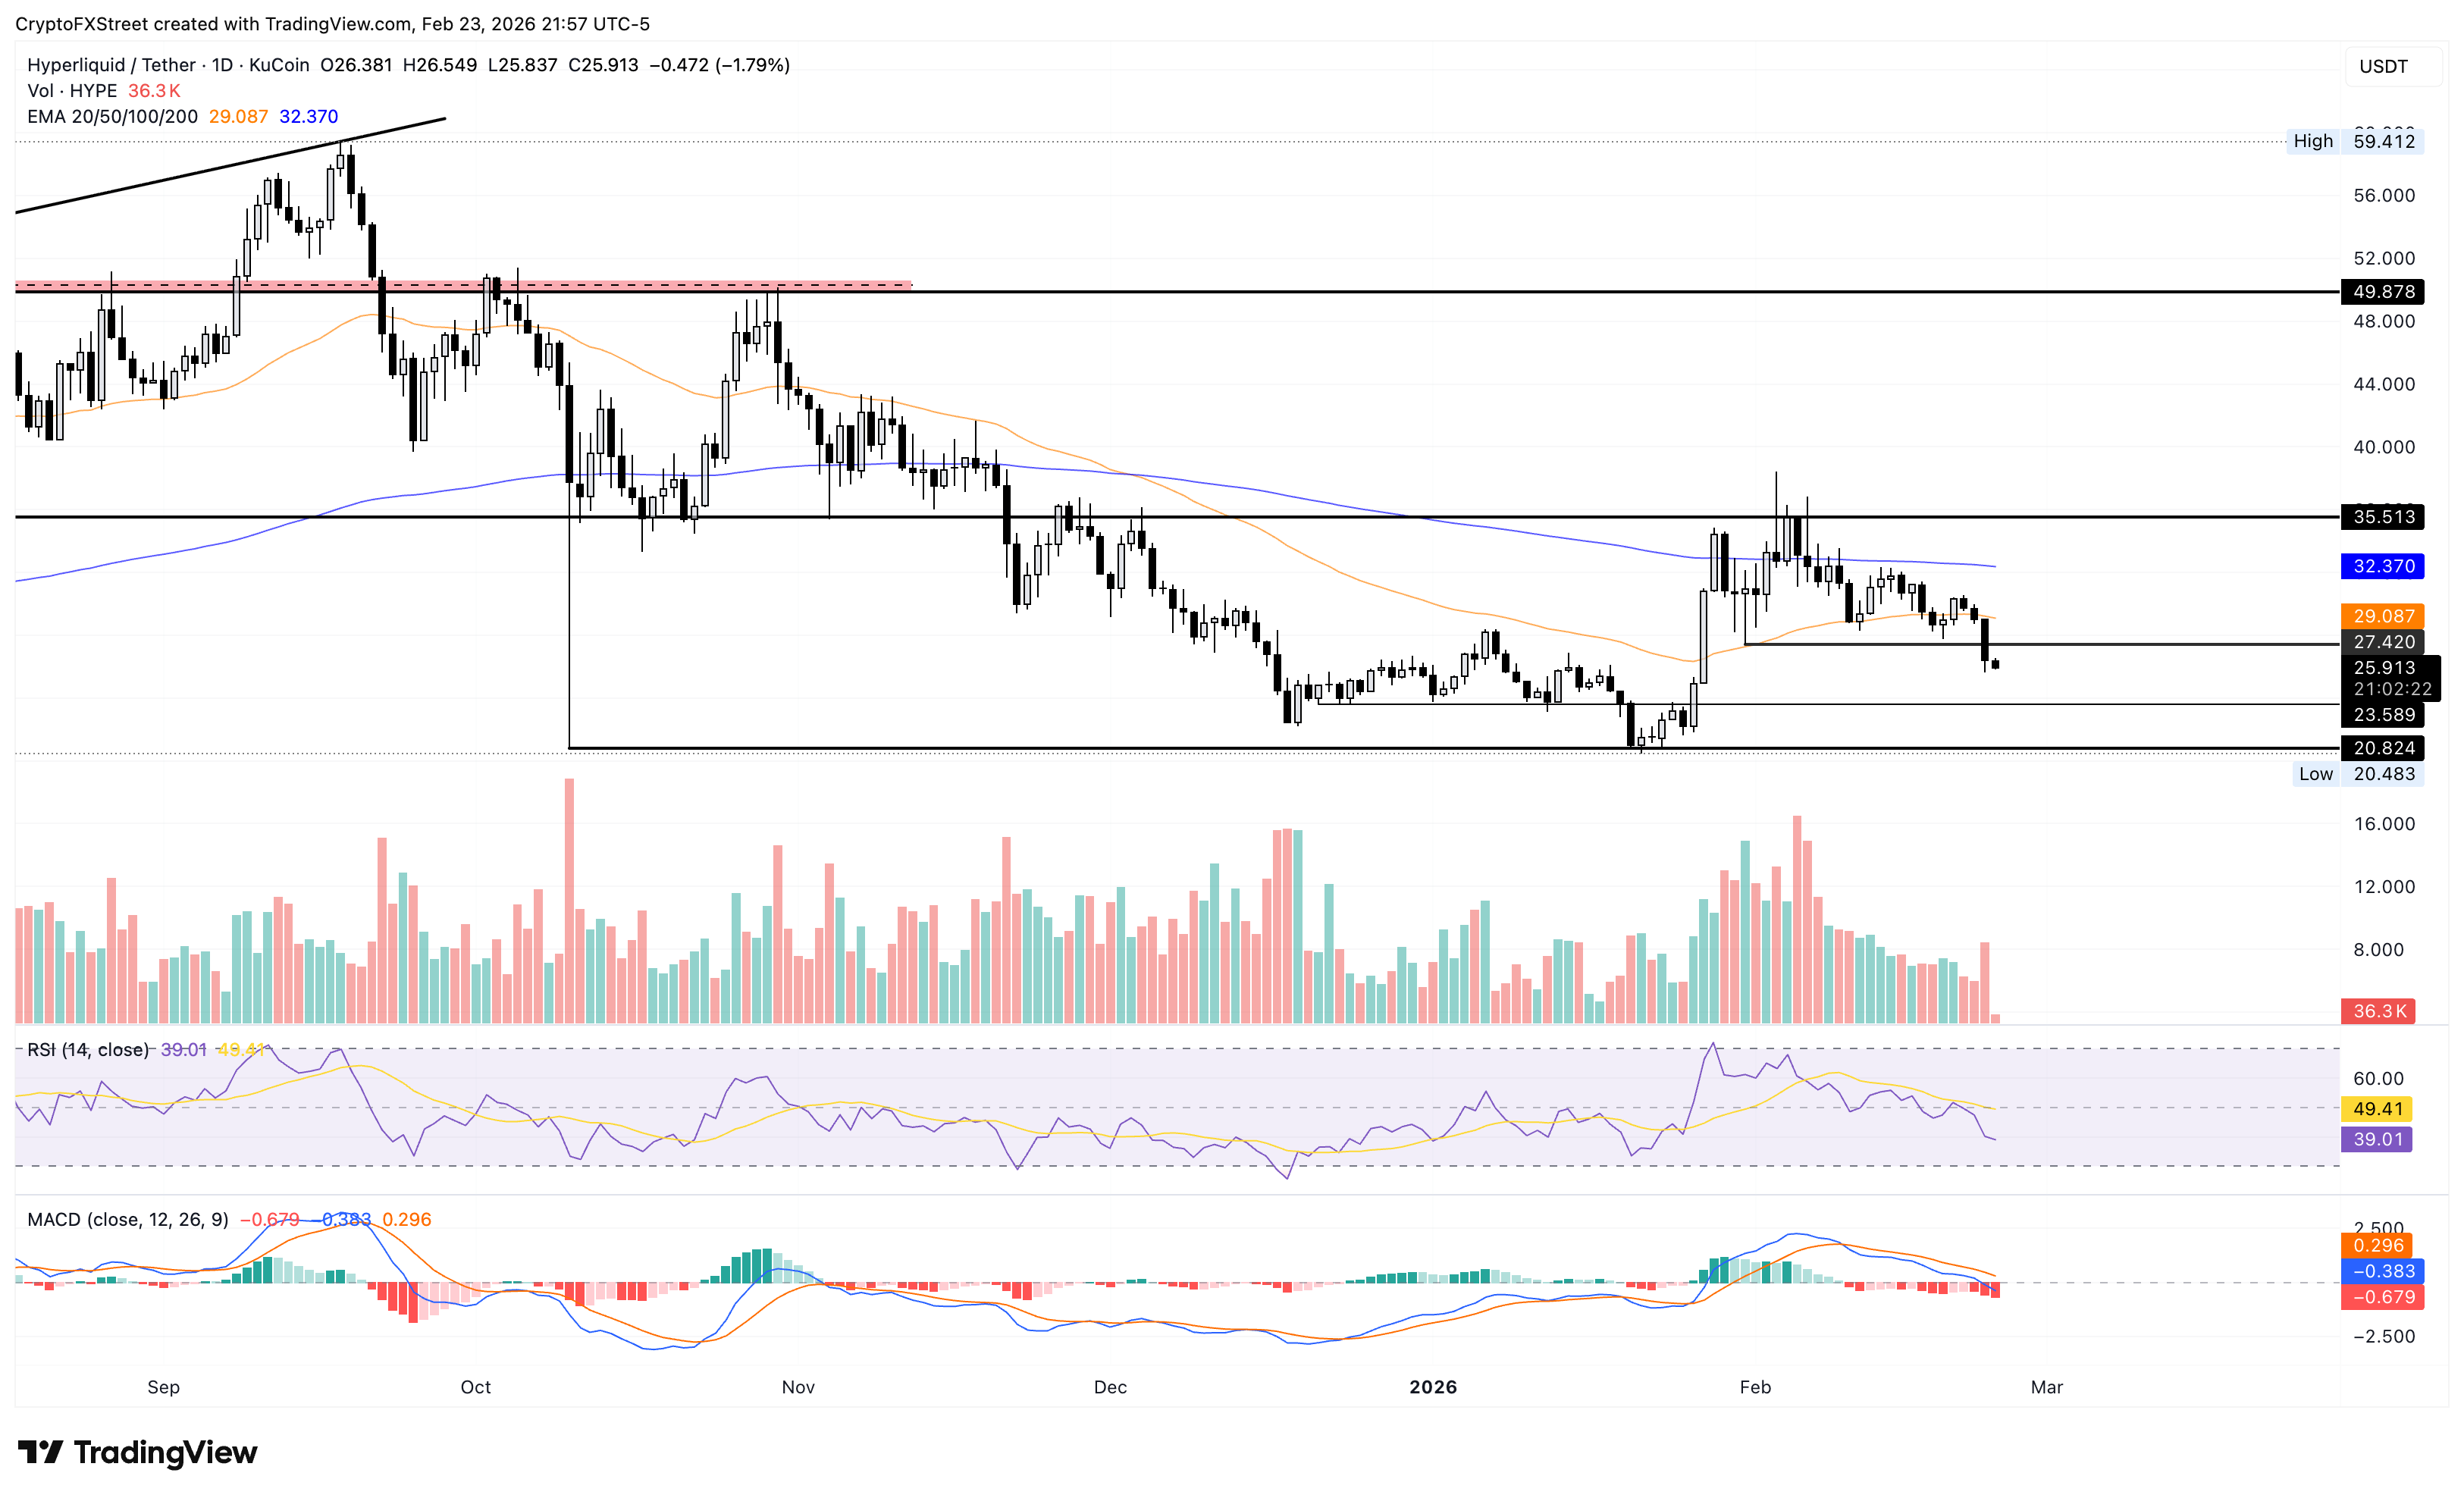
On the upside, Hyperliquid should reclaim the 50-day EMA at $29.08 to reinstate a short-term recovery.
Pump.fun under pressure flirts with all-time low
Pump.fun trades near $0.001800 at press time on Tuesday, following an 11% decline on Monday. The meme coin launchpad token has extended its broader decline since late September, targeting the $0.001678 support level, which previously helped trigger a rebound on February 6.
A decisive close below this level could extend the decline to the S2 pivot point at $0.001199.
The RSI at 37 hovers slightly above the oversold zone, suggesting increased selling pressure. Meanwhile, the MACD and signal line restart a declining trend after a crossover on Monday, suggesting renewed bearish momentum.
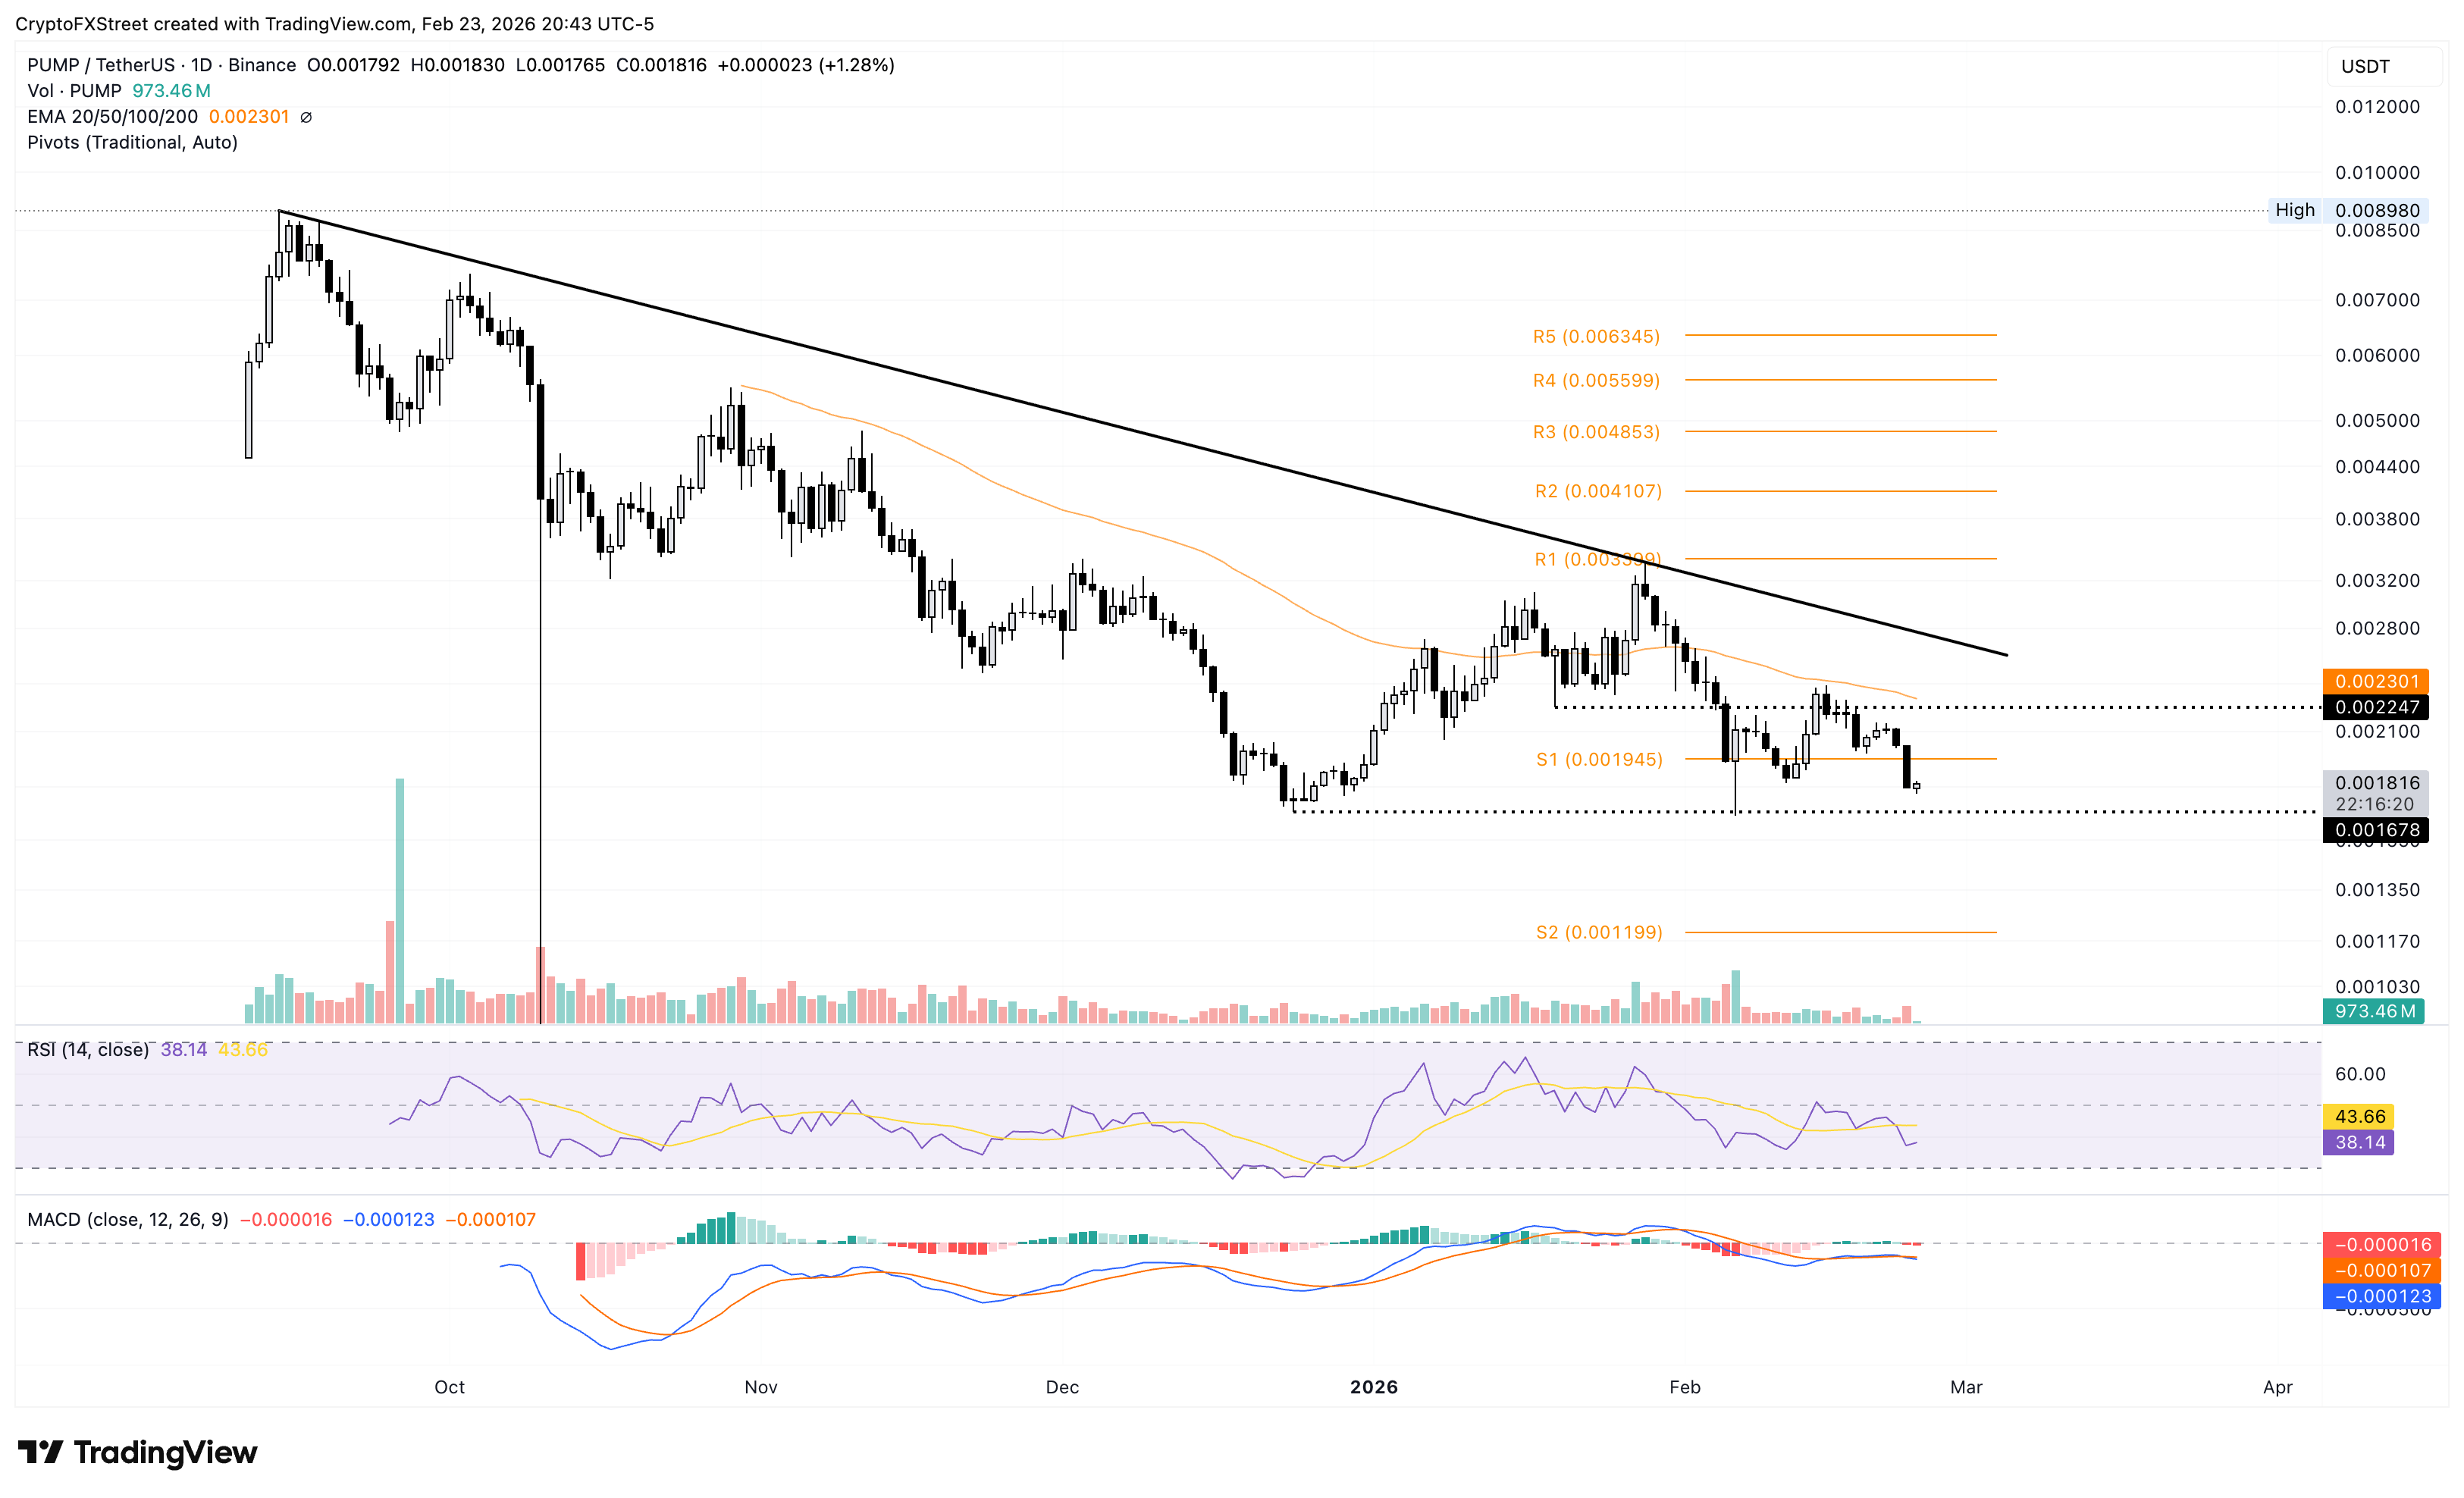
If PUMP reclaims the S1 pivot point at $0.001945, it could test the 50-day EMA at $0.002300.
บทความแนะนำ


