

Ethereum Price Forecast: ETH balance on exchanges wanes amid investor capitulation
- Ethereum slides below short-term support at $3,300 as sellers tighten their grip.
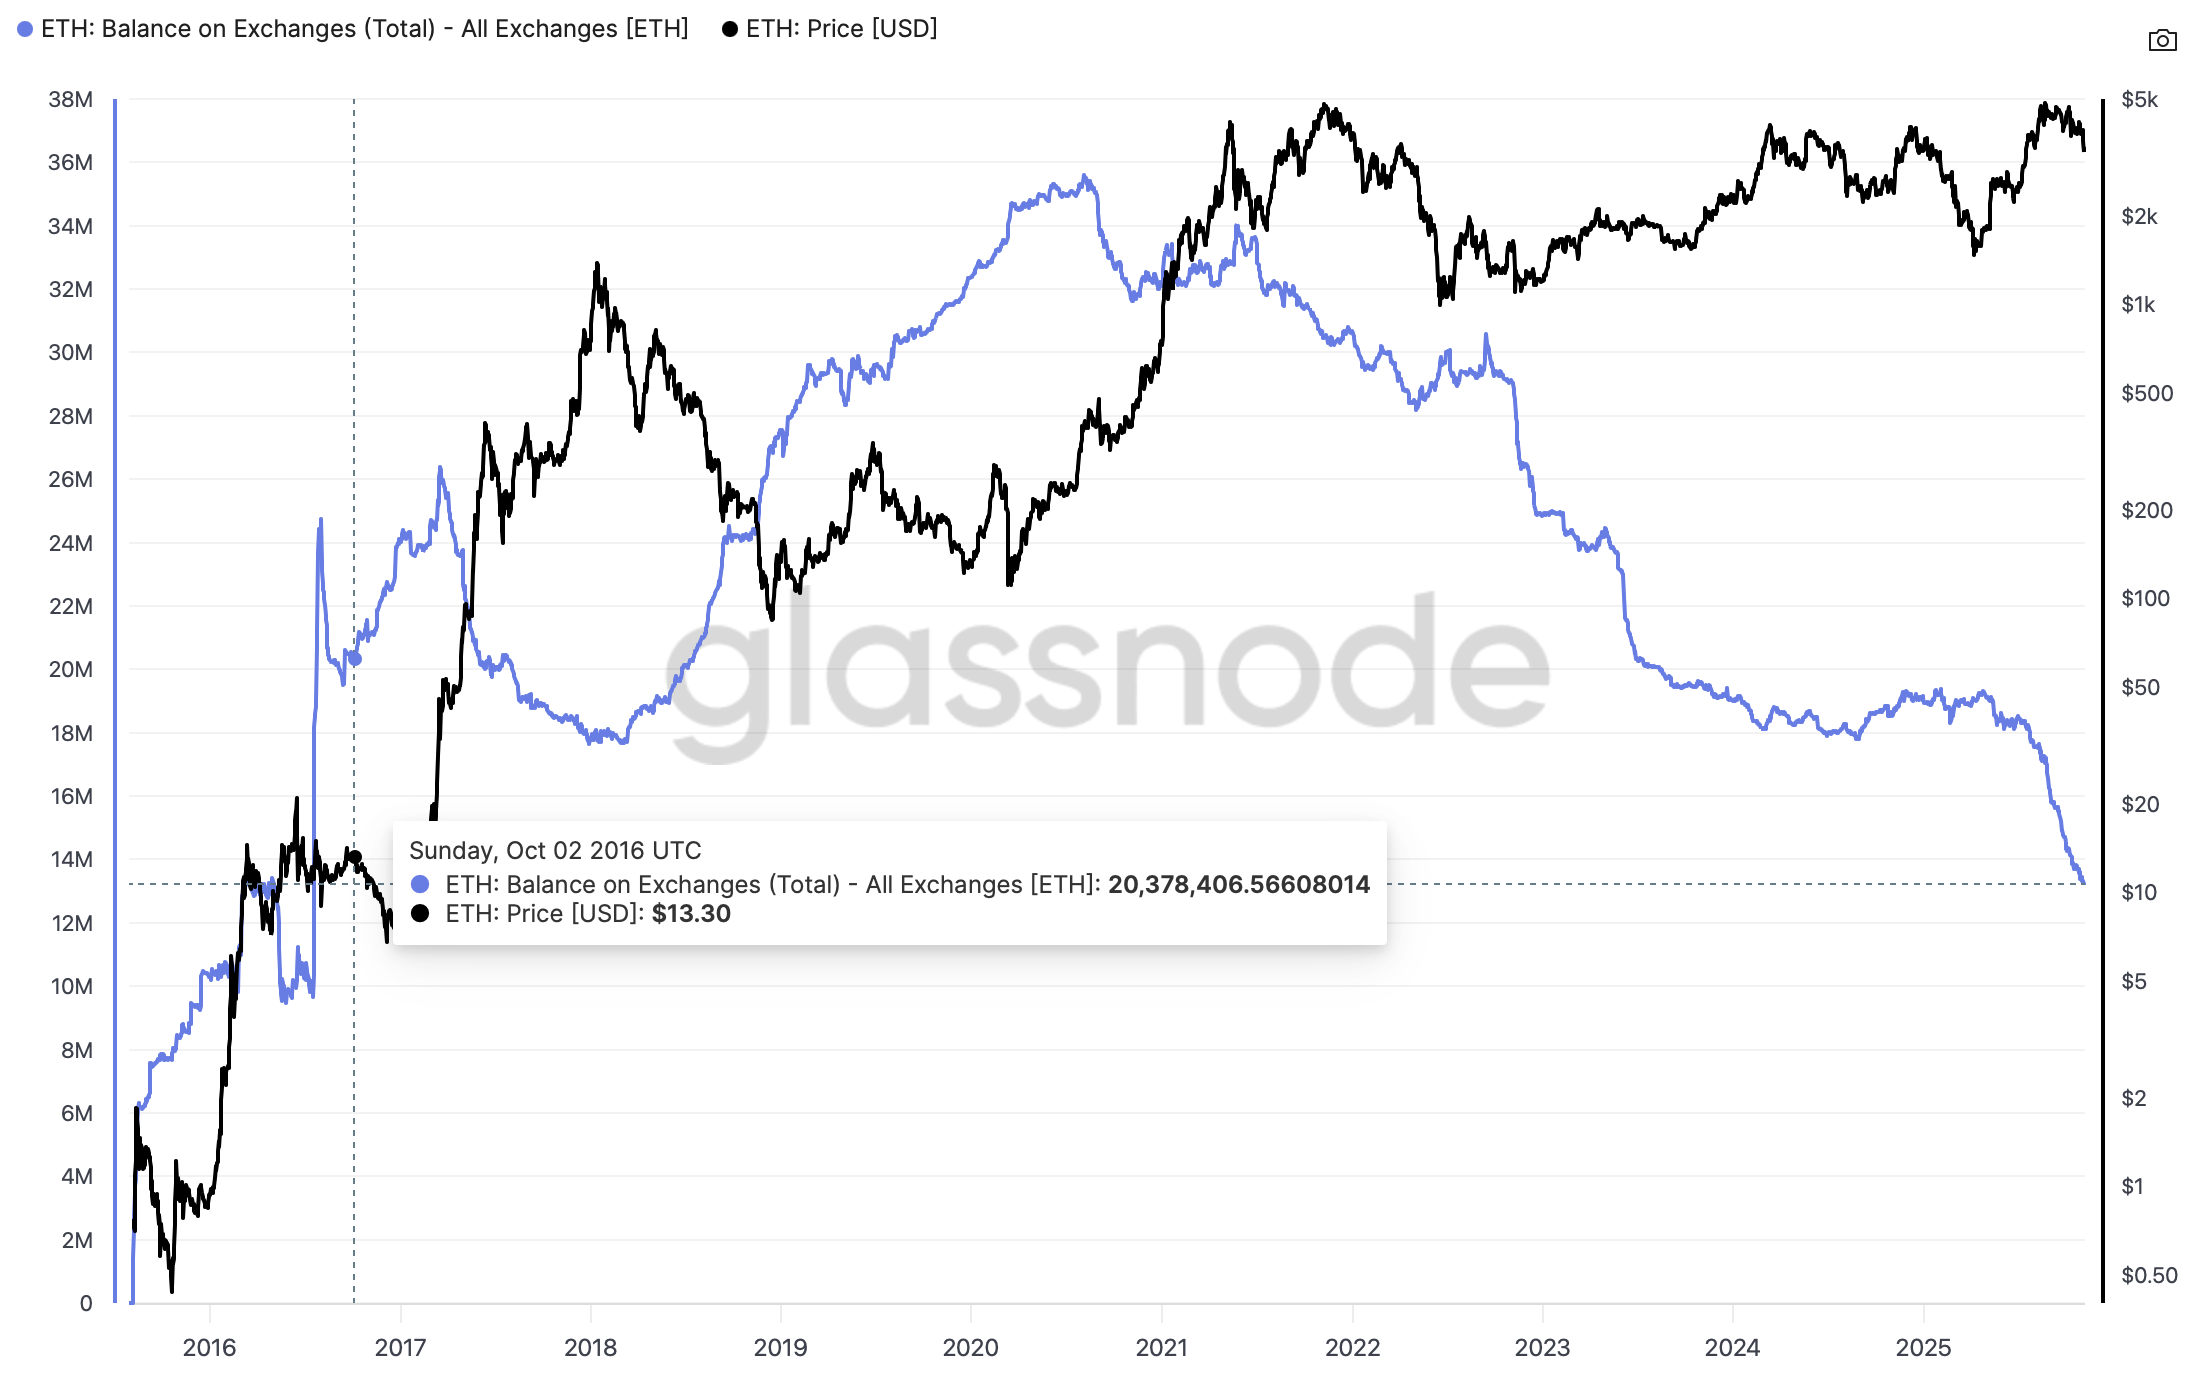
- Ethereum's balance on exchanges drops to its lowest level in nine years as capitulation continues.
- Institutional and retail interest remain subdued amid persistent ETF outflows and declining Open Interest.
Ethereum (ETH) has resumed its downtrend, trading below $3,300 at the time of writing on Thursday. The bearish outlook mirrors Bitcoin's (BTC) intraday decline below $102,000.
Overall, recovery in the cryptocurrency market has become an uphill battle, evidenced by dwindling institutional and retail demand. Still, Ethereum's balance on exchanges keeps falling, suggesting that potential selling pressure in the opening market is fading, which could bolster the next leg up.
Assessing Ethereum's exchange reserve squeeze
Ethereum's balance on exchanges reached a peak of approximately 35.5 million ETH in August 2020 and has steadily declined to 13.3 million Ethereum as of Wednesday, according to Glassnode.
A steady decline in exchange reserves suggests consistent accumulation, as holders shift to self-custody or staking. The effect is a reduced available supply for sale in the open market, easing downward pressure and potentially fostering scarcity-driven price increases.
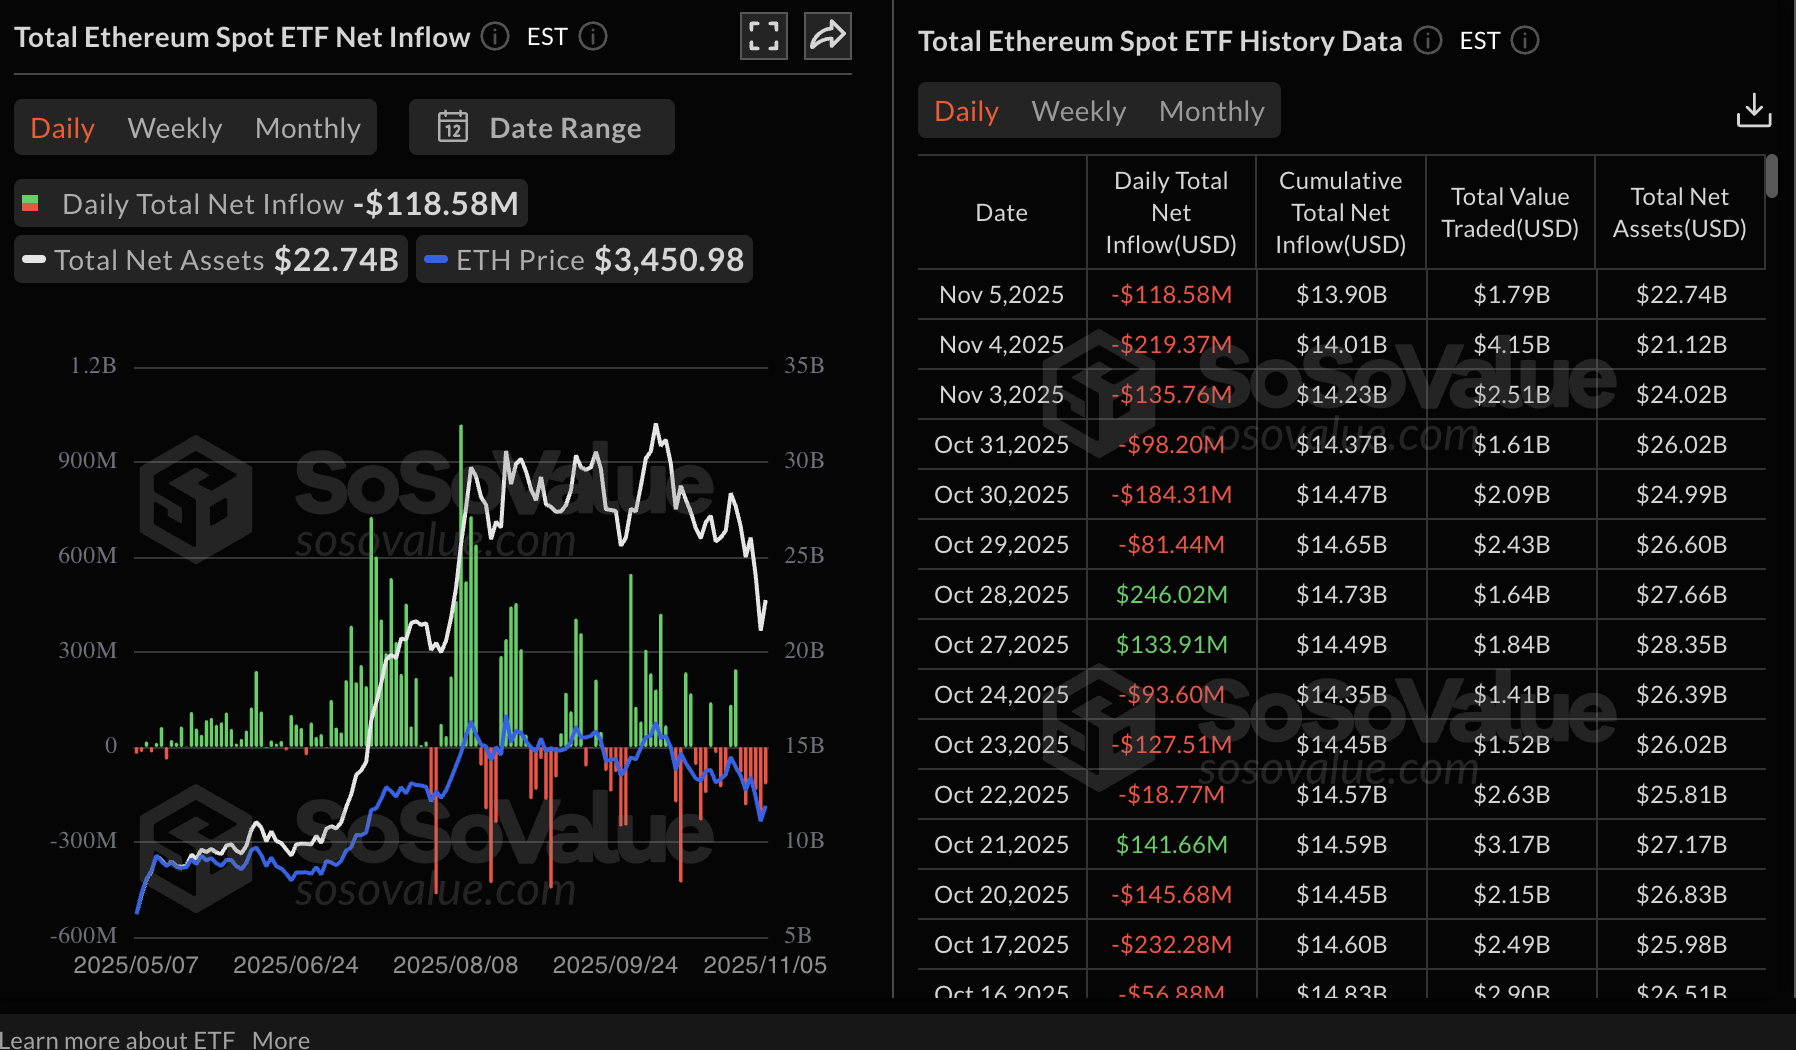
Meanwhile, institutional investors have been retreating to the sidelines, reducing their exposure to Ethereum spot Exchange Traded Funds (ETFs). SoSoValue data shows that US-listed ETFs experienced outflows of approximately $119 million on Wednesday, bringing the cumulative net inflows to $13.9 billion and net assets to approximately $22.74 billion.
Three out of the nine ETH ETFs recorded net inflows, including Grayscale's ETH with $24 million, Fidelity's FETH with $3.45 million and 21Shares' TETH with roughly $515,000. BlackRock's ETHA led the outflows, with approximately $147 million in outflows.
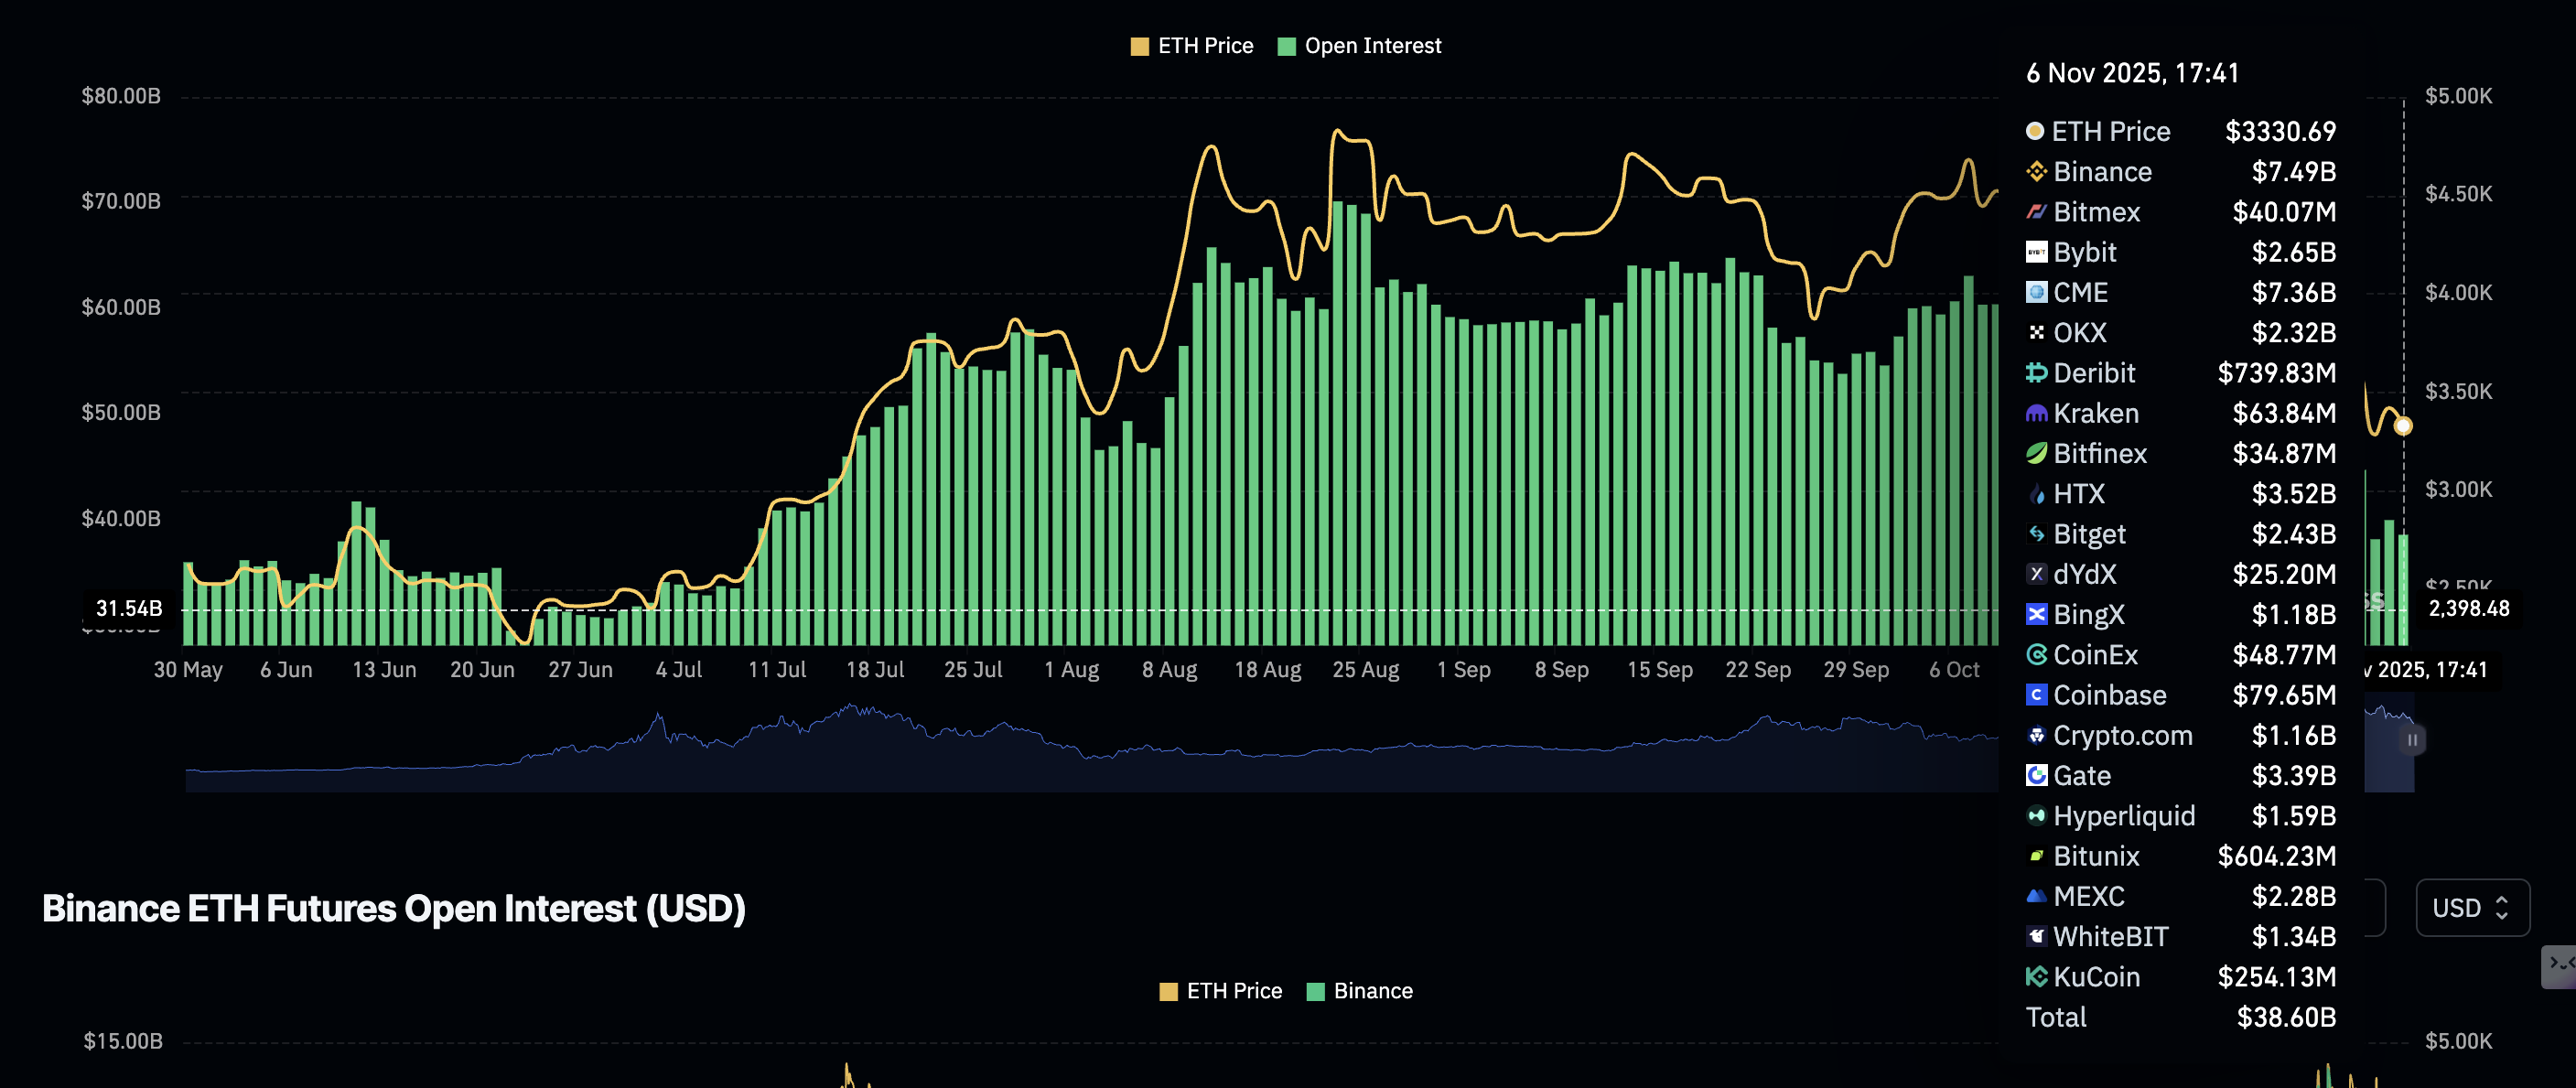
Retail demand for Ethereum is also on a steady decline, with the futures Open Interest (OI) falling to $38.6 billion from the October peak of approximately $63 billion.
OI, which refers to the notional value of outstanding futures contracts, helps gauge interest and investor confidence in the asset. A persistent decline indicates that traders are closing their long positions in favor of short positions, contributing to selling pressure.
Technical outlook: Ethereum dips further as risk-off sentiment persists
Ethereum is trading below $3,300 at the time of writing on Thursday, largely weighted down by negative sentiment in the broader cryptocurrency market. Based on the daily chart, sellers have the upper hand, particularly given the Relative Strength Index at 32 and its approach to oversold territory.
The Moving Average Convergence Divergence (MACD) indicator on the same daily chart has maintained a sell signal since Monday, calling on investors to reduce their exposure.
Traders will watch for a daily close below the short-term support to ascertain Ethereum's bearish outlook. Key downside targets include $3,057, tested on Tuesday, and $2,880, tested in June.
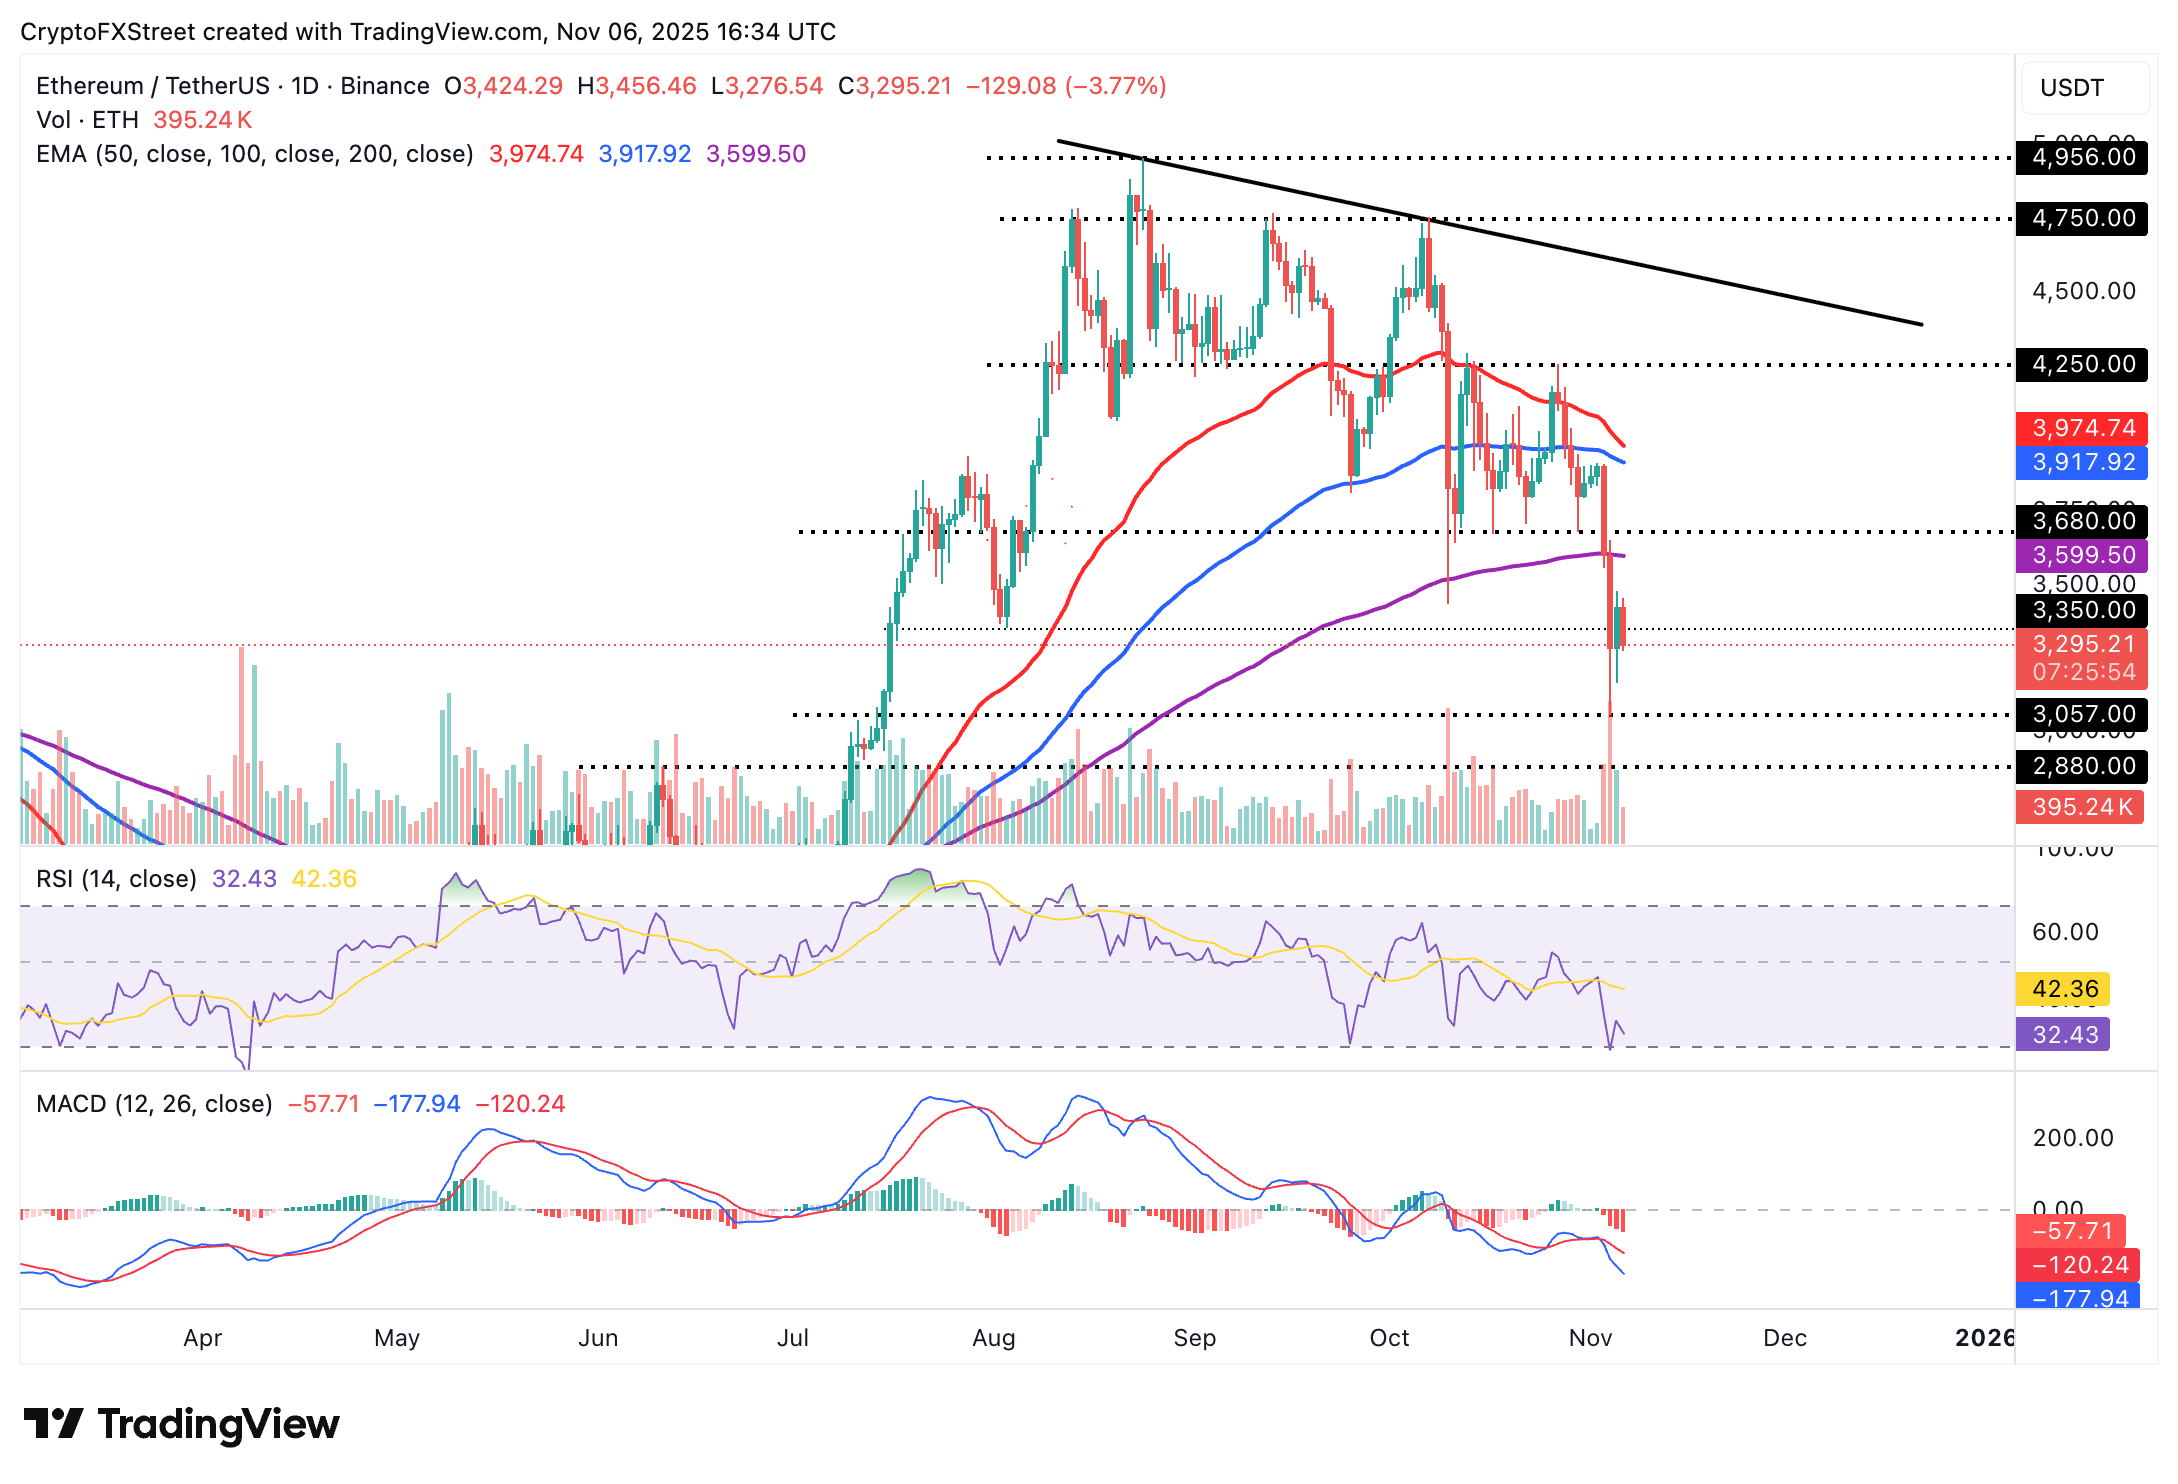
Still, a knee-jerk reversal could occur if bulls buy the dip, further strengthening the tailwind to push ETH above the 200-day Exponential Moving Average (EMA) at $3,599.
Cryptocurrency metrics FAQs
The developer or creator of each cryptocurrency decides on the total number of tokens that can be minted or issued. Only a certain number of these assets can be minted by mining, staking or other mechanisms. This is defined by the algorithm of the underlying blockchain technology. On the other hand, circulating supply can also be decreased via actions such as burning tokens, or mistakenly sending assets to addresses of other incompatible blockchains.
Market capitalization is the result of multiplying the circulating supply of a certain asset by the asset’s current market value.
Trading volume refers to the total number of tokens for a specific asset that has been transacted or exchanged between buyers and sellers within set trading hours, for example, 24 hours. It is used to gauge market sentiment, this metric combines all volumes on centralized exchanges and decentralized exchanges. Increasing trading volume often denotes the demand for a certain asset as more people are buying and selling the cryptocurrency.
Funding rates are a concept designed to encourage traders to take positions and ensure perpetual contract prices match spot markets. It defines a mechanism by exchanges to ensure that future prices and index prices periodic payments regularly converge. When the funding rate is positive, the price of the perpetual contract is higher than the mark price. This means traders who are bullish and have opened long positions pay traders who are in short positions. On the other hand, a negative funding rate means perpetual prices are below the mark price, and hence traders with short positions pay traders who have opened long positions.
บทความแนะนำ


