
Dogecoin Price Forecast: DOGE drops to $0.20 as SOPR metric resets
- Dogecoin declines, testing short-term support at $0.2000 on Monday.
- DOGE SOPR metric drops below 1.00, signaling profit-taking among holders.
- Retail demand for DOGE remains low, with futures Open Interest averaging $1.95 billion.
Dogecoin (DOGE), the leading meme coin by market capitalization, is trading above $0.2000 at the time of writing on Monday, after profit-taking and a shift in sentiment in the broader cryptocurrency market trimmed gains from an intraday high of $0.2095.
Concerns over macroeconomic uncertainty stemming from the trade standoff between the United States (US) and China persist amid a subtle uptick in inflation.
The lack of price catalysts in the cryptocurrency market, especially with the delay in the approval of Dogecoin spot Exchange Traded Funds (ETFs) due to the prolonged US government shutdown, could keep Dogecoin price suppressed near support at $0.2000.
DOGE shows weakness amid low real demand, profit-taking
The massive sell-off on October 10 left many traders counting losses as liquidators soared to historical levels. Dogecoin’s futures Open Interest (OI) plummeted to $1.81 billion on October 11 from a monthly peak of approximately $5 billion.
While the OI, representing the notional value of outstanding futures contracts, has recovered to $1.95 billion, it remains significant below the monthly high and the previous quarter peak of approximately $6 billion.
A steady increase in the OI is required to sustain the uptrend as traders increasingly pile into long positions.
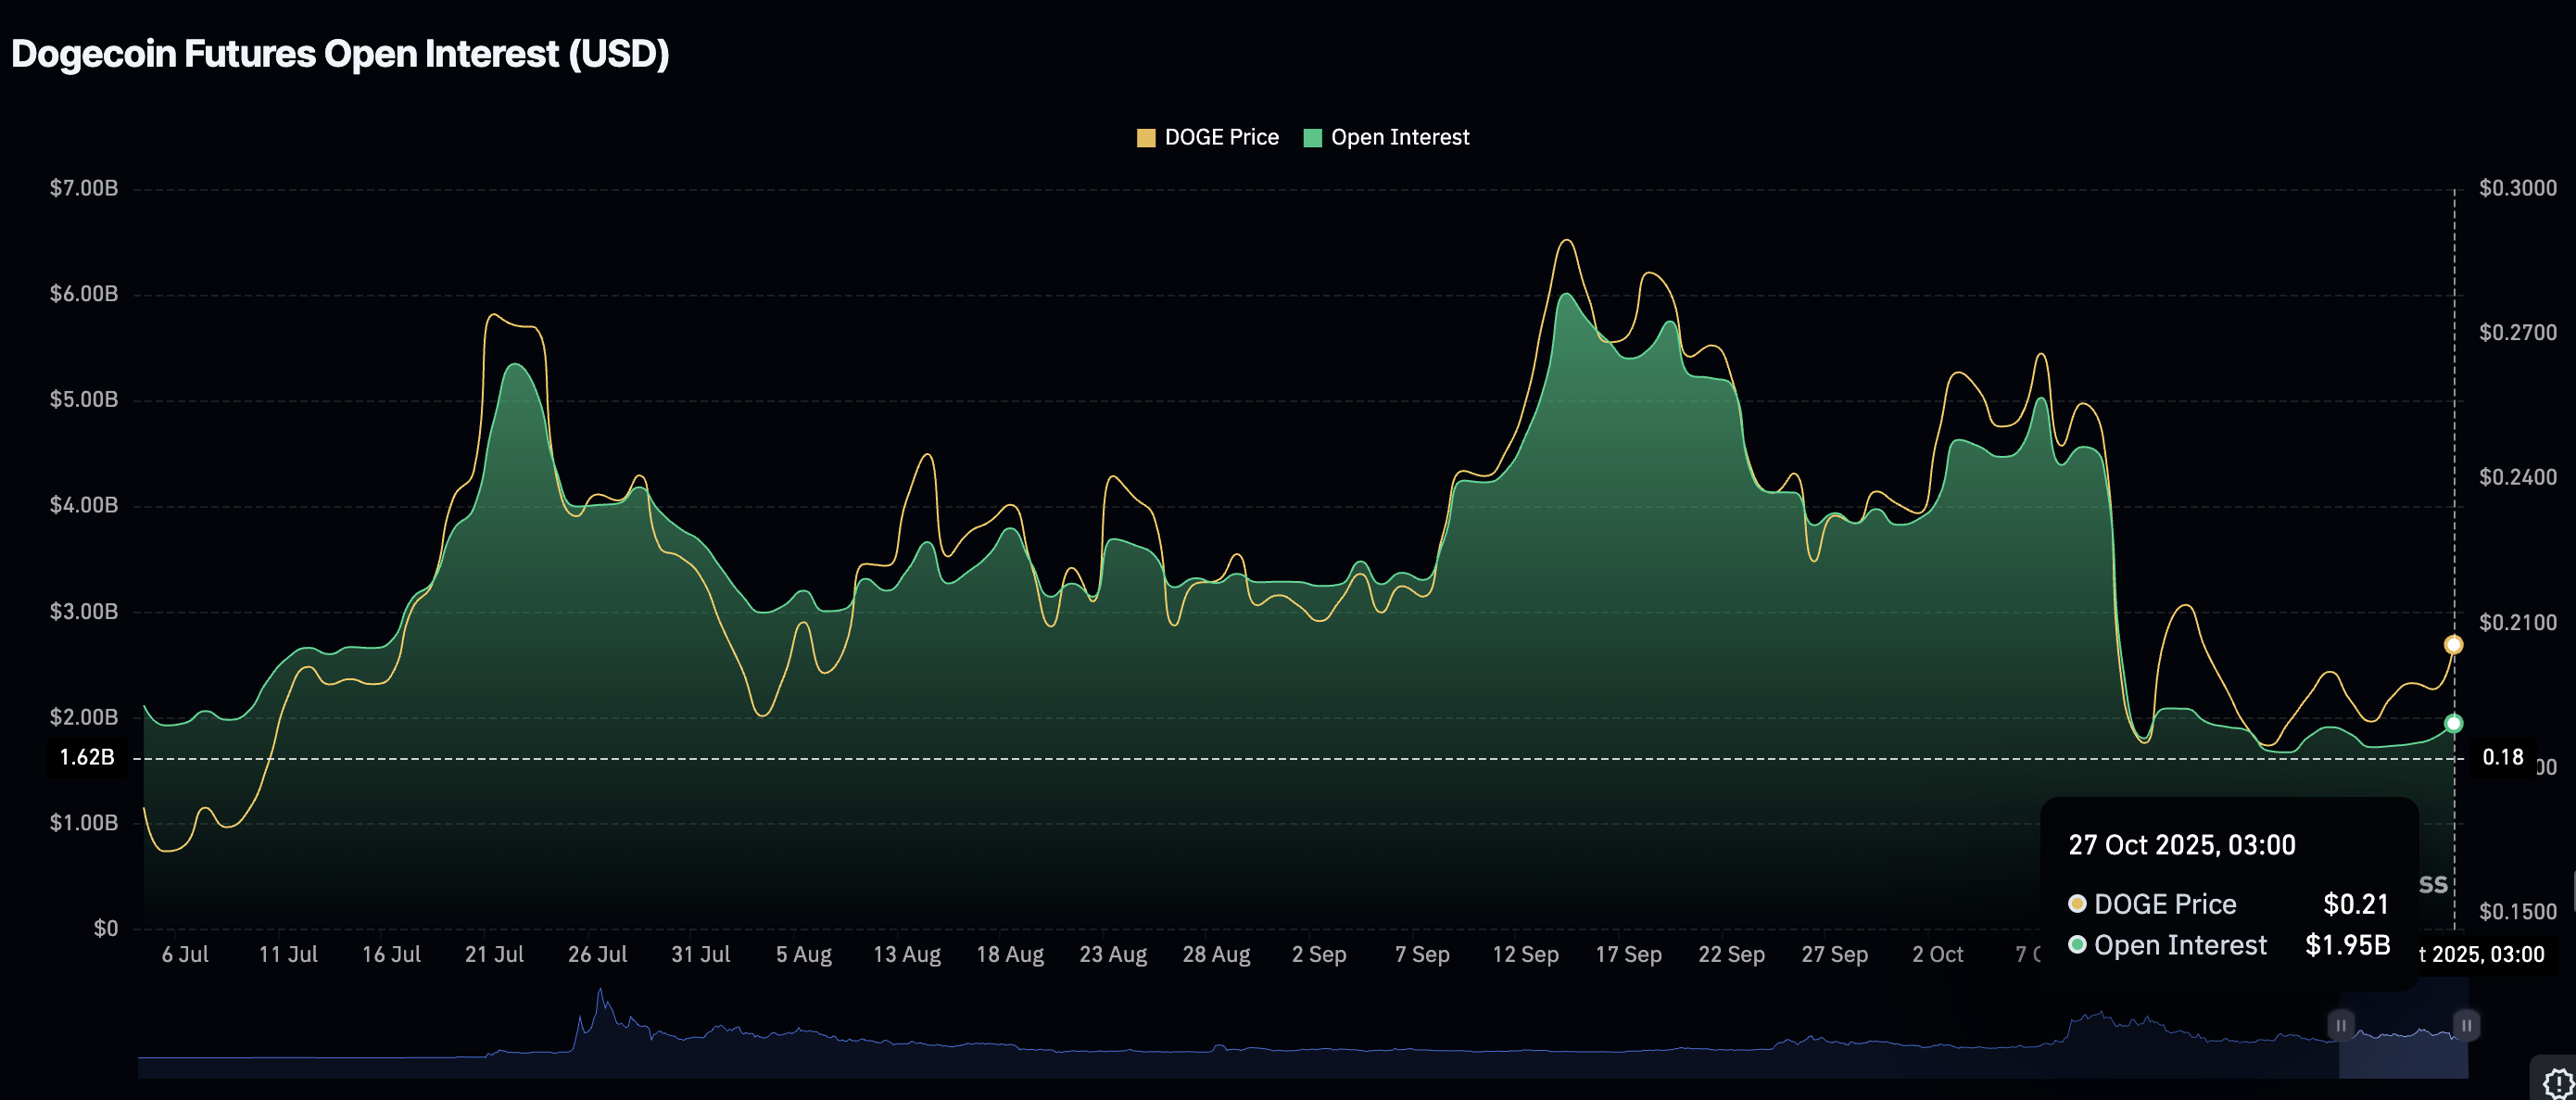
Dogecoin Futures Open Interest | Source: CoinGlass
Dogecoin’s Spent Output Profit Ratio (SOPR), an on-chain metric that gauges whether tokens are being sold at a profit or loss, has declined to 0.97, according to Glassnode.
The SOPR calculates the ratio of the price at which a spent output (transaction) was acquired compared to the price at which it was spent. An SOPR value above 1.00 implies that investor are selling their assets at a profit. On the other hand, a value below 1.00 shows that holders are selling in distress or realizing losses.
When the SOPR falls below 1.00, it signals a reset amid market capitulation. In other words, weak hands are exiting their positions at a break-even point or realizing losses. In the process, this rids the market of excessive selling pressure, signaling a bullish contraction signal.
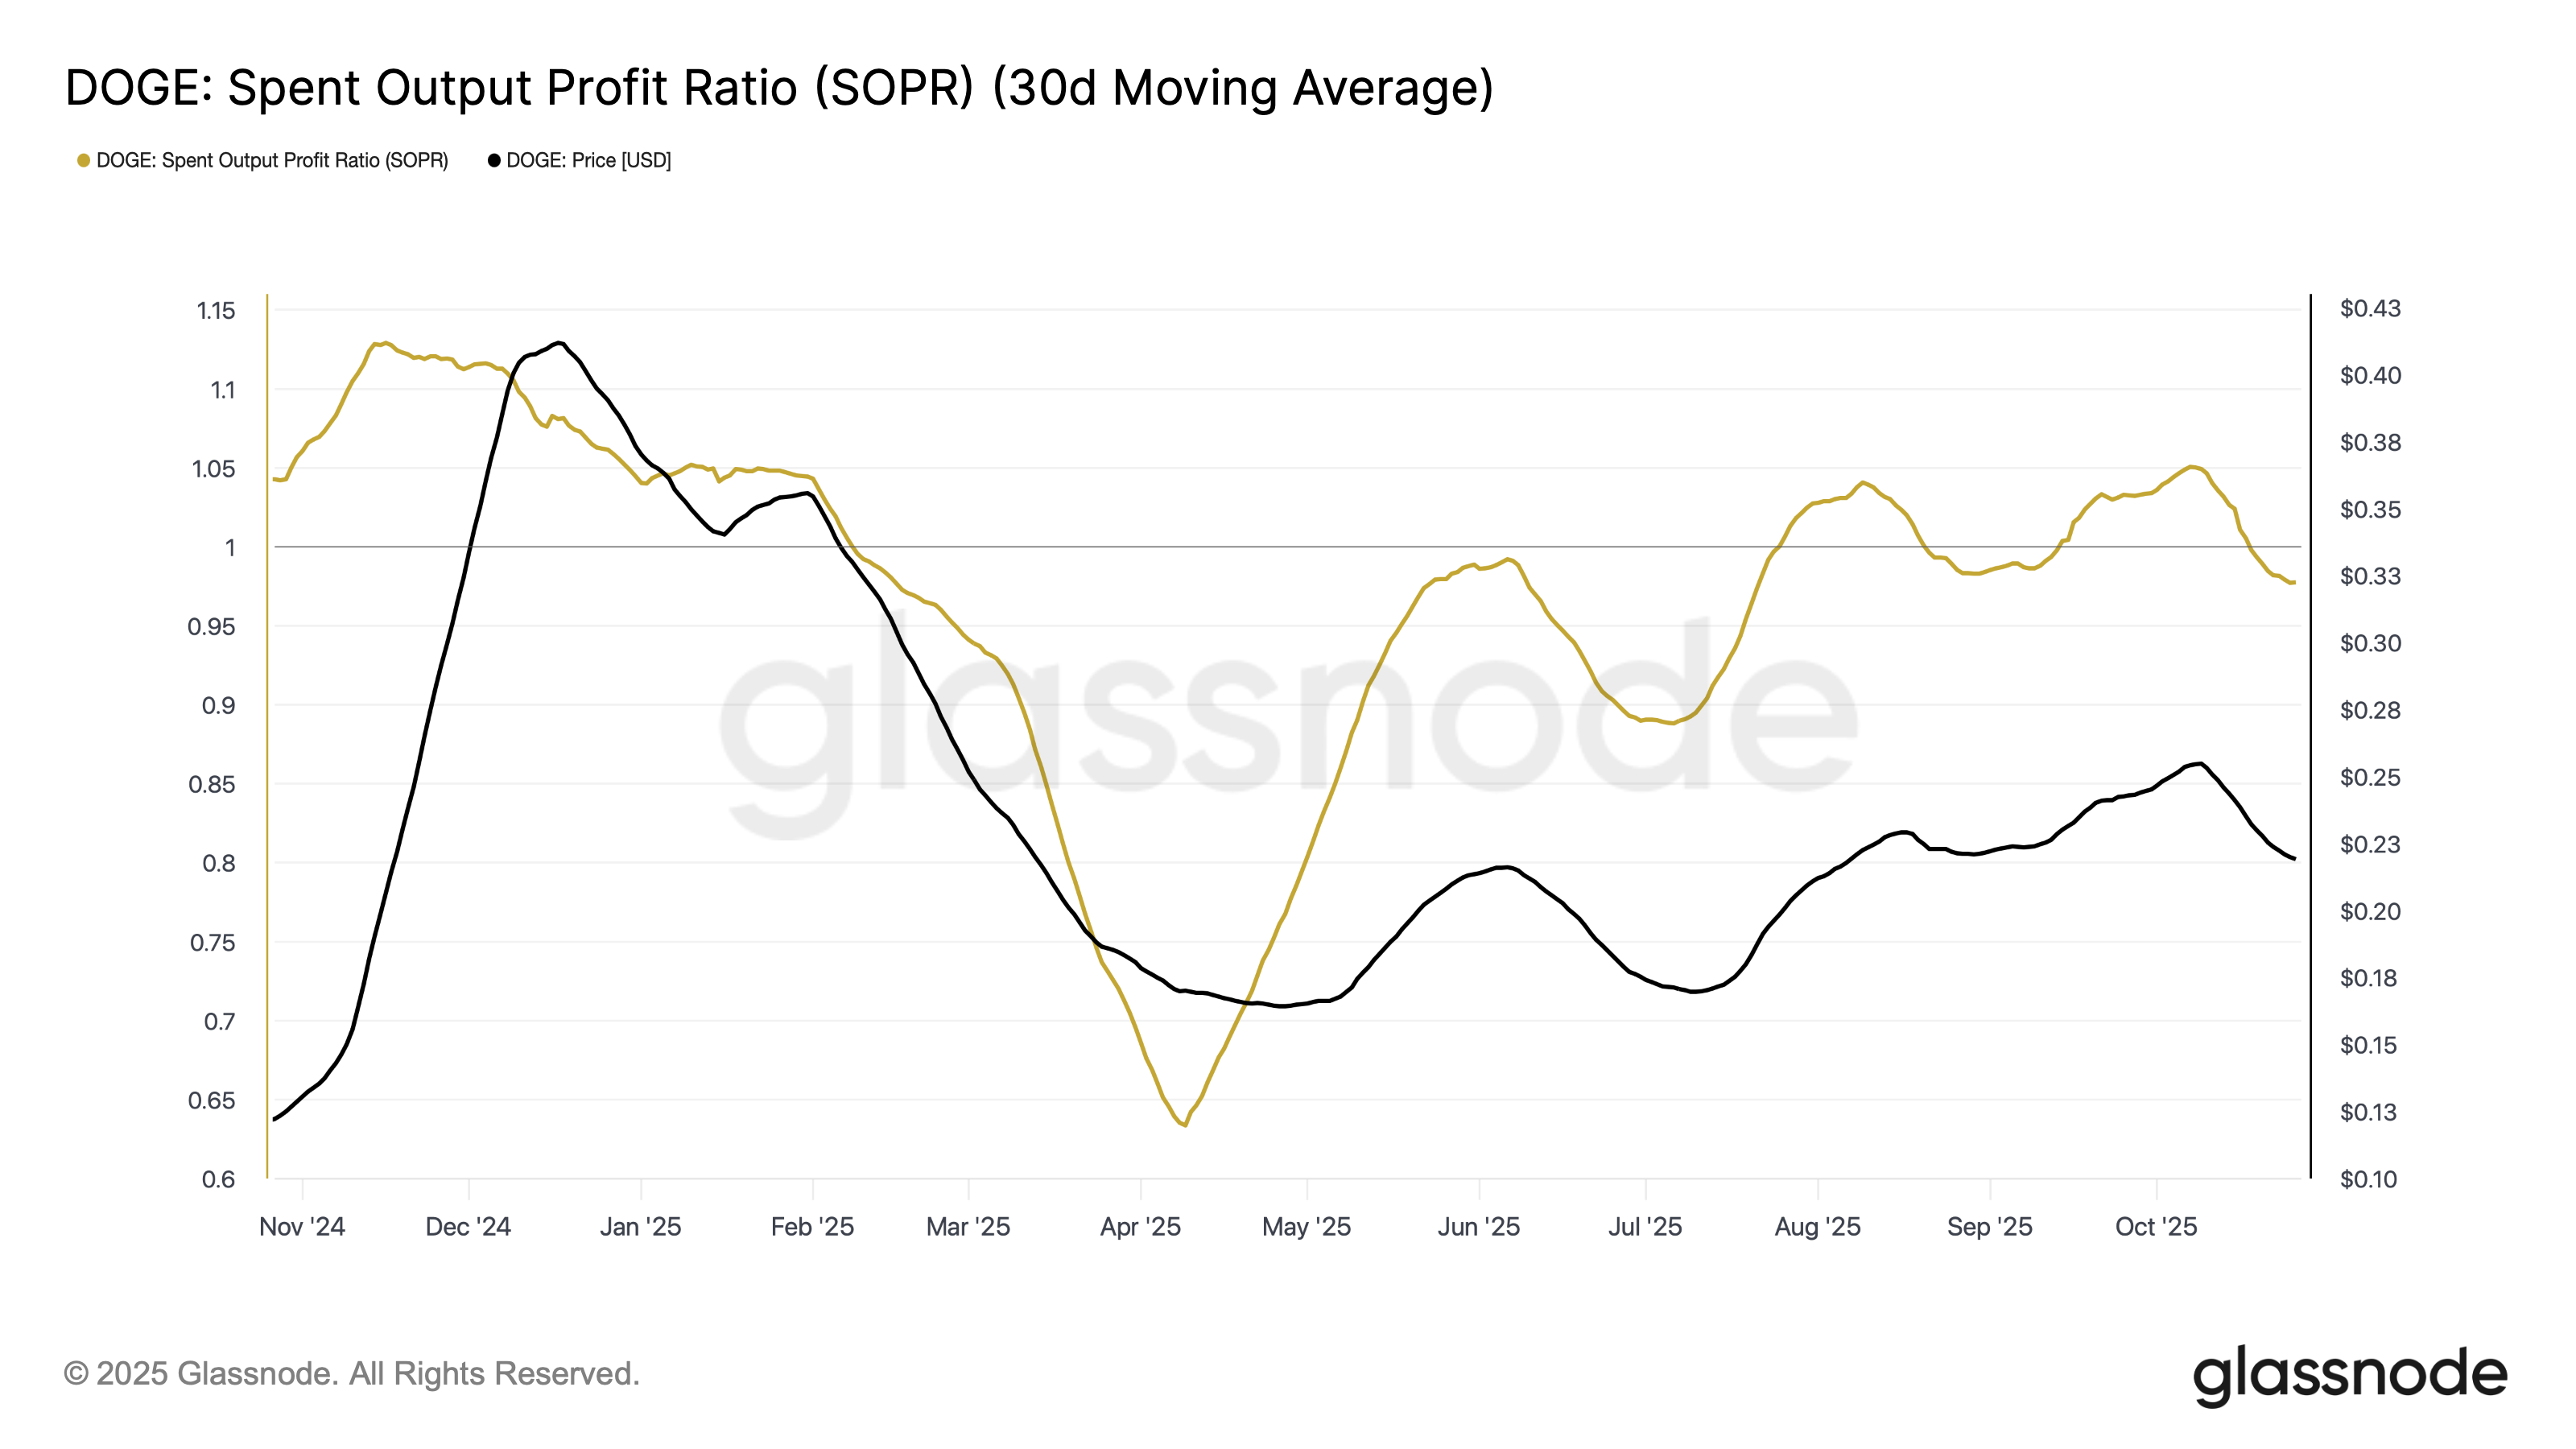
Dogecoin SOPR metric | Source: Glassnode
Technical outlook: Dogecoin bulls eye short-term recovery
Dogecoin is rebounding above its $0.2000 support at the time of writing on Monday. Bulls are targeting a daily close above the 100-day Exponential Moving Average (EMA) $0.2038, supported by a short-term bullish outlook.
The Relative Strength Index (RSI), rising at 59 on the daily chart, reinforces the bullish grip. Higher RSI readings toward overbought territory indicate bullish momentum is increasing.
Traders will also watch the Moving Average Convergence Divergence (MACD) indicator to sustain a buy signal and validate the uptrend. The blue MACD line must remain above the red signal line as the indicator generally edges higher.
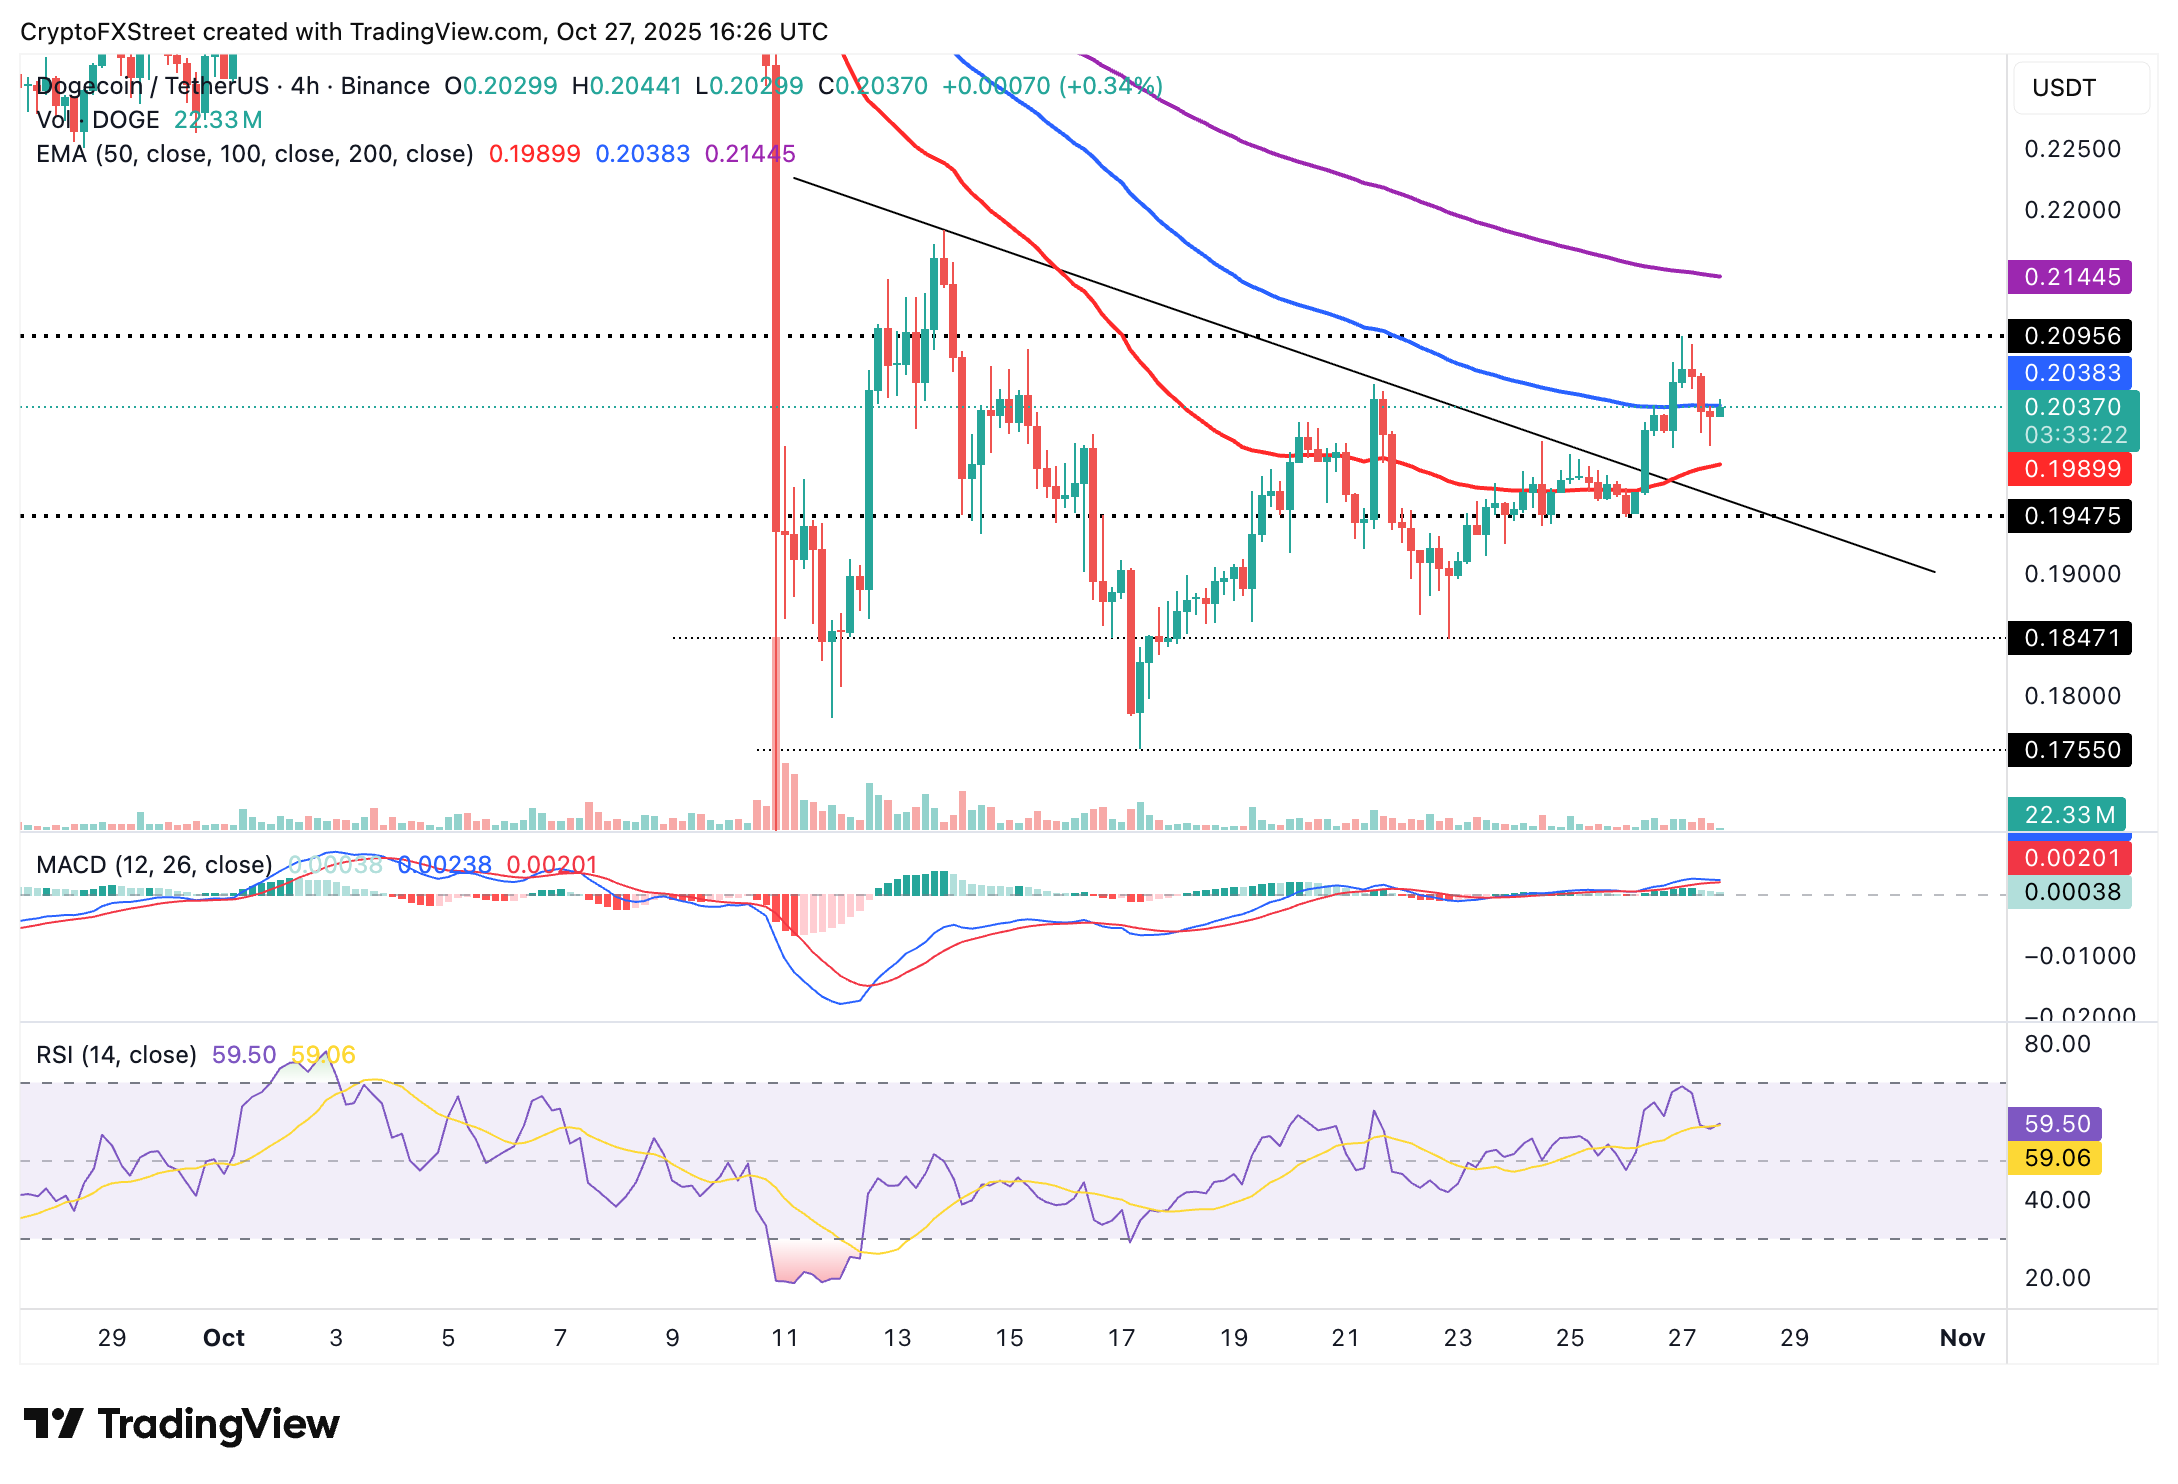
DOGE/USDT daily chart
As interest in Dogecoin increases, the odds of a stronger breakout surge. Still, traders should be cautiously optimistic amid potential profit-taking at key levels, including $0.2095, which was tested earlier in the day, and the 200-day EMA at $0.2144.
Cryptocurrency metrics FAQs
The developer or creator of each cryptocurrency decides on the total number of tokens that can be minted or issued. Only a certain number of these assets can be minted by mining, staking or other mechanisms. This is defined by the algorithm of the underlying blockchain technology. On the other hand, circulating supply can also be decreased via actions such as burning tokens, or mistakenly sending assets to addresses of other incompatible blockchains.
Market capitalization is the result of multiplying the circulating supply of a certain asset by the asset’s current market value.
Trading volume refers to the total number of tokens for a specific asset that has been transacted or exchanged between buyers and sellers within set trading hours, for example, 24 hours. It is used to gauge market sentiment, this metric combines all volumes on centralized exchanges and decentralized exchanges. Increasing trading volume often denotes the demand for a certain asset as more people are buying and selling the cryptocurrency.
Funding rates are a concept designed to encourage traders to take positions and ensure perpetual contract prices match spot markets. It defines a mechanism by exchanges to ensure that future prices and index prices periodic payments regularly converge. When the funding rate is positive, the price of the perpetual contract is higher than the mark price. This means traders who are bullish and have opened long positions pay traders who are in short positions. On the other hand, a negative funding rate means perpetual prices are below the mark price, and hence traders with short positions pay traders who have opened long positions.
บทความแนะนำ


