


US Dollar Index Price Forecast: Advances to near 99.00 after rebounding from 50-day EMA
- The US Dollar Index may find the initial barrier at ascending channel’s upper boundary around 99.30.
- Short-term price momentum is stronger as DXY remains above the nine-day EMA.
- The immediate support appears at the 50-day EMA of 98.57.
The US Dollar Index (DXY), which measures the value of the US Dollar (USD) against six major currencies, is extending its gains for the fourth consecutive session and trading around 98.80 during the European hours on Tuesday.
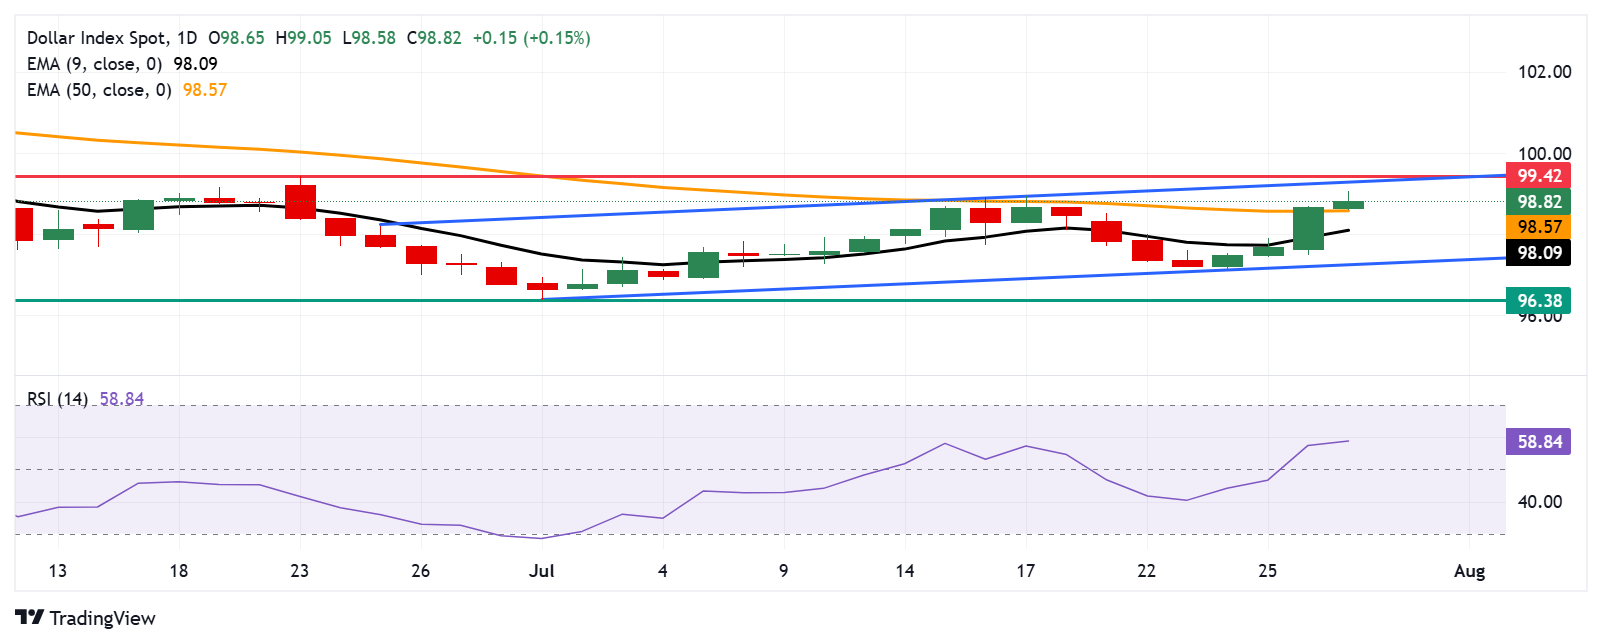
The technical analysis of the daily chart shows the US Dollar Index moving within an ascending channel pattern, suggesting an active bullish bias. Additionally, the 14-day Relative Strength Index (RSI) is remaining above the 50 level, strengthening bullish bias. The short-term price momentum is also stronger as the DXY is positioned above the nine-day Exponential Moving Average (EMA).
On the upside, the US Dollar Index may target the primary barrier at the upper boundary of the ascending channel around 99.30, followed by the two-month high at $99.42, which was reached on June 23. A break above the channel would reinforce the bullish bias and support the DXY to explore the area around the psychological level of 100.00.
The DXY could find the immediate support at the 50-day EMA of 98.57, followed by the nine-day EMA at 98.09. A break below these levels would weaken the short- and medium-term price momentum and put downward pressure on the dollar index to test the ascending channel’s lower boundary around 97.30. Further declines would prompt the US Dollar Index to target the three-year low at $96.38, recorded on July 1.
US Dollar Index: Daily Chart
US Dollar PRICE Today
The table below shows the percentage change of US Dollar (USD) against listed major currencies today. US Dollar was the strongest against the New Zealand Dollar.
| USD | EUR | GBP | JPY | CAD | AUD | NZD | CHF | |
|---|---|---|---|---|---|---|---|---|
| USD | 0.21% | 0.11% | -0.03% | 0.07% | 0.13% | 0.31% | 0.23% | |
| EUR | -0.21% | -0.12% | -0.27% | -0.15% | -0.07% | -0.01% | 0.03% | |
| GBP | -0.11% | 0.12% | -0.16% | -0.03% | 0.05% | 0.11% | 0.13% | |
| JPY | 0.03% | 0.27% | 0.16% | 0.07% | 0.15% | 0.26% | 0.36% | |
| CAD | -0.07% | 0.15% | 0.03% | -0.07% | 0.00% | 0.25% | 0.16% | |
| AUD | -0.13% | 0.07% | -0.05% | -0.15% | -0.00% | 0.08% | 0.06% | |
| NZD | -0.31% | 0.01% | -0.11% | -0.26% | -0.25% | -0.08% | 0.02% | |
| CHF | -0.23% | -0.03% | -0.13% | -0.36% | -0.16% | -0.06% | -0.02% |
The heat map shows percentage changes of major currencies against each other. The base currency is picked from the left column, while the quote currency is picked from the top row. For example, if you pick the US Dollar from the left column and move along the horizontal line to the Japanese Yen, the percentage change displayed in the box will represent USD (base)/JPY (quote).
Artigos Recomendados


