

Top 3 Price Prediction Bitcoin, Ethereum, Ripple: BTC, ETH and XRP crash, wiping $1.17 billion from the market
- Bitcoin price closes below $100,000 support level, suggesting a further decline.
- Ethereum price closes below the $3,522 weekly level, indicating a correction on the horizon.
- Ripple price retests the $2.21 daily support level; a firm close below would continue the ongoing pullback.
Bitcoin (BTC) price trades below $98,000 on Friday after declining more than 6% this week. Ethereum (ETH) and Ripple (XRP) followed BTC’s footsteps, closing below their key support and declining 12% and 4.5%, respectively, this week.
This recent price drop has triggered a wave of liquation across the crypto market. This downturn has resulted in over $1.17 billion in total liquidations in the last 24 hours and more than $238 million in BTC, $220 million in ETH, and $47 million in XRP, according to data from CoinGlass.
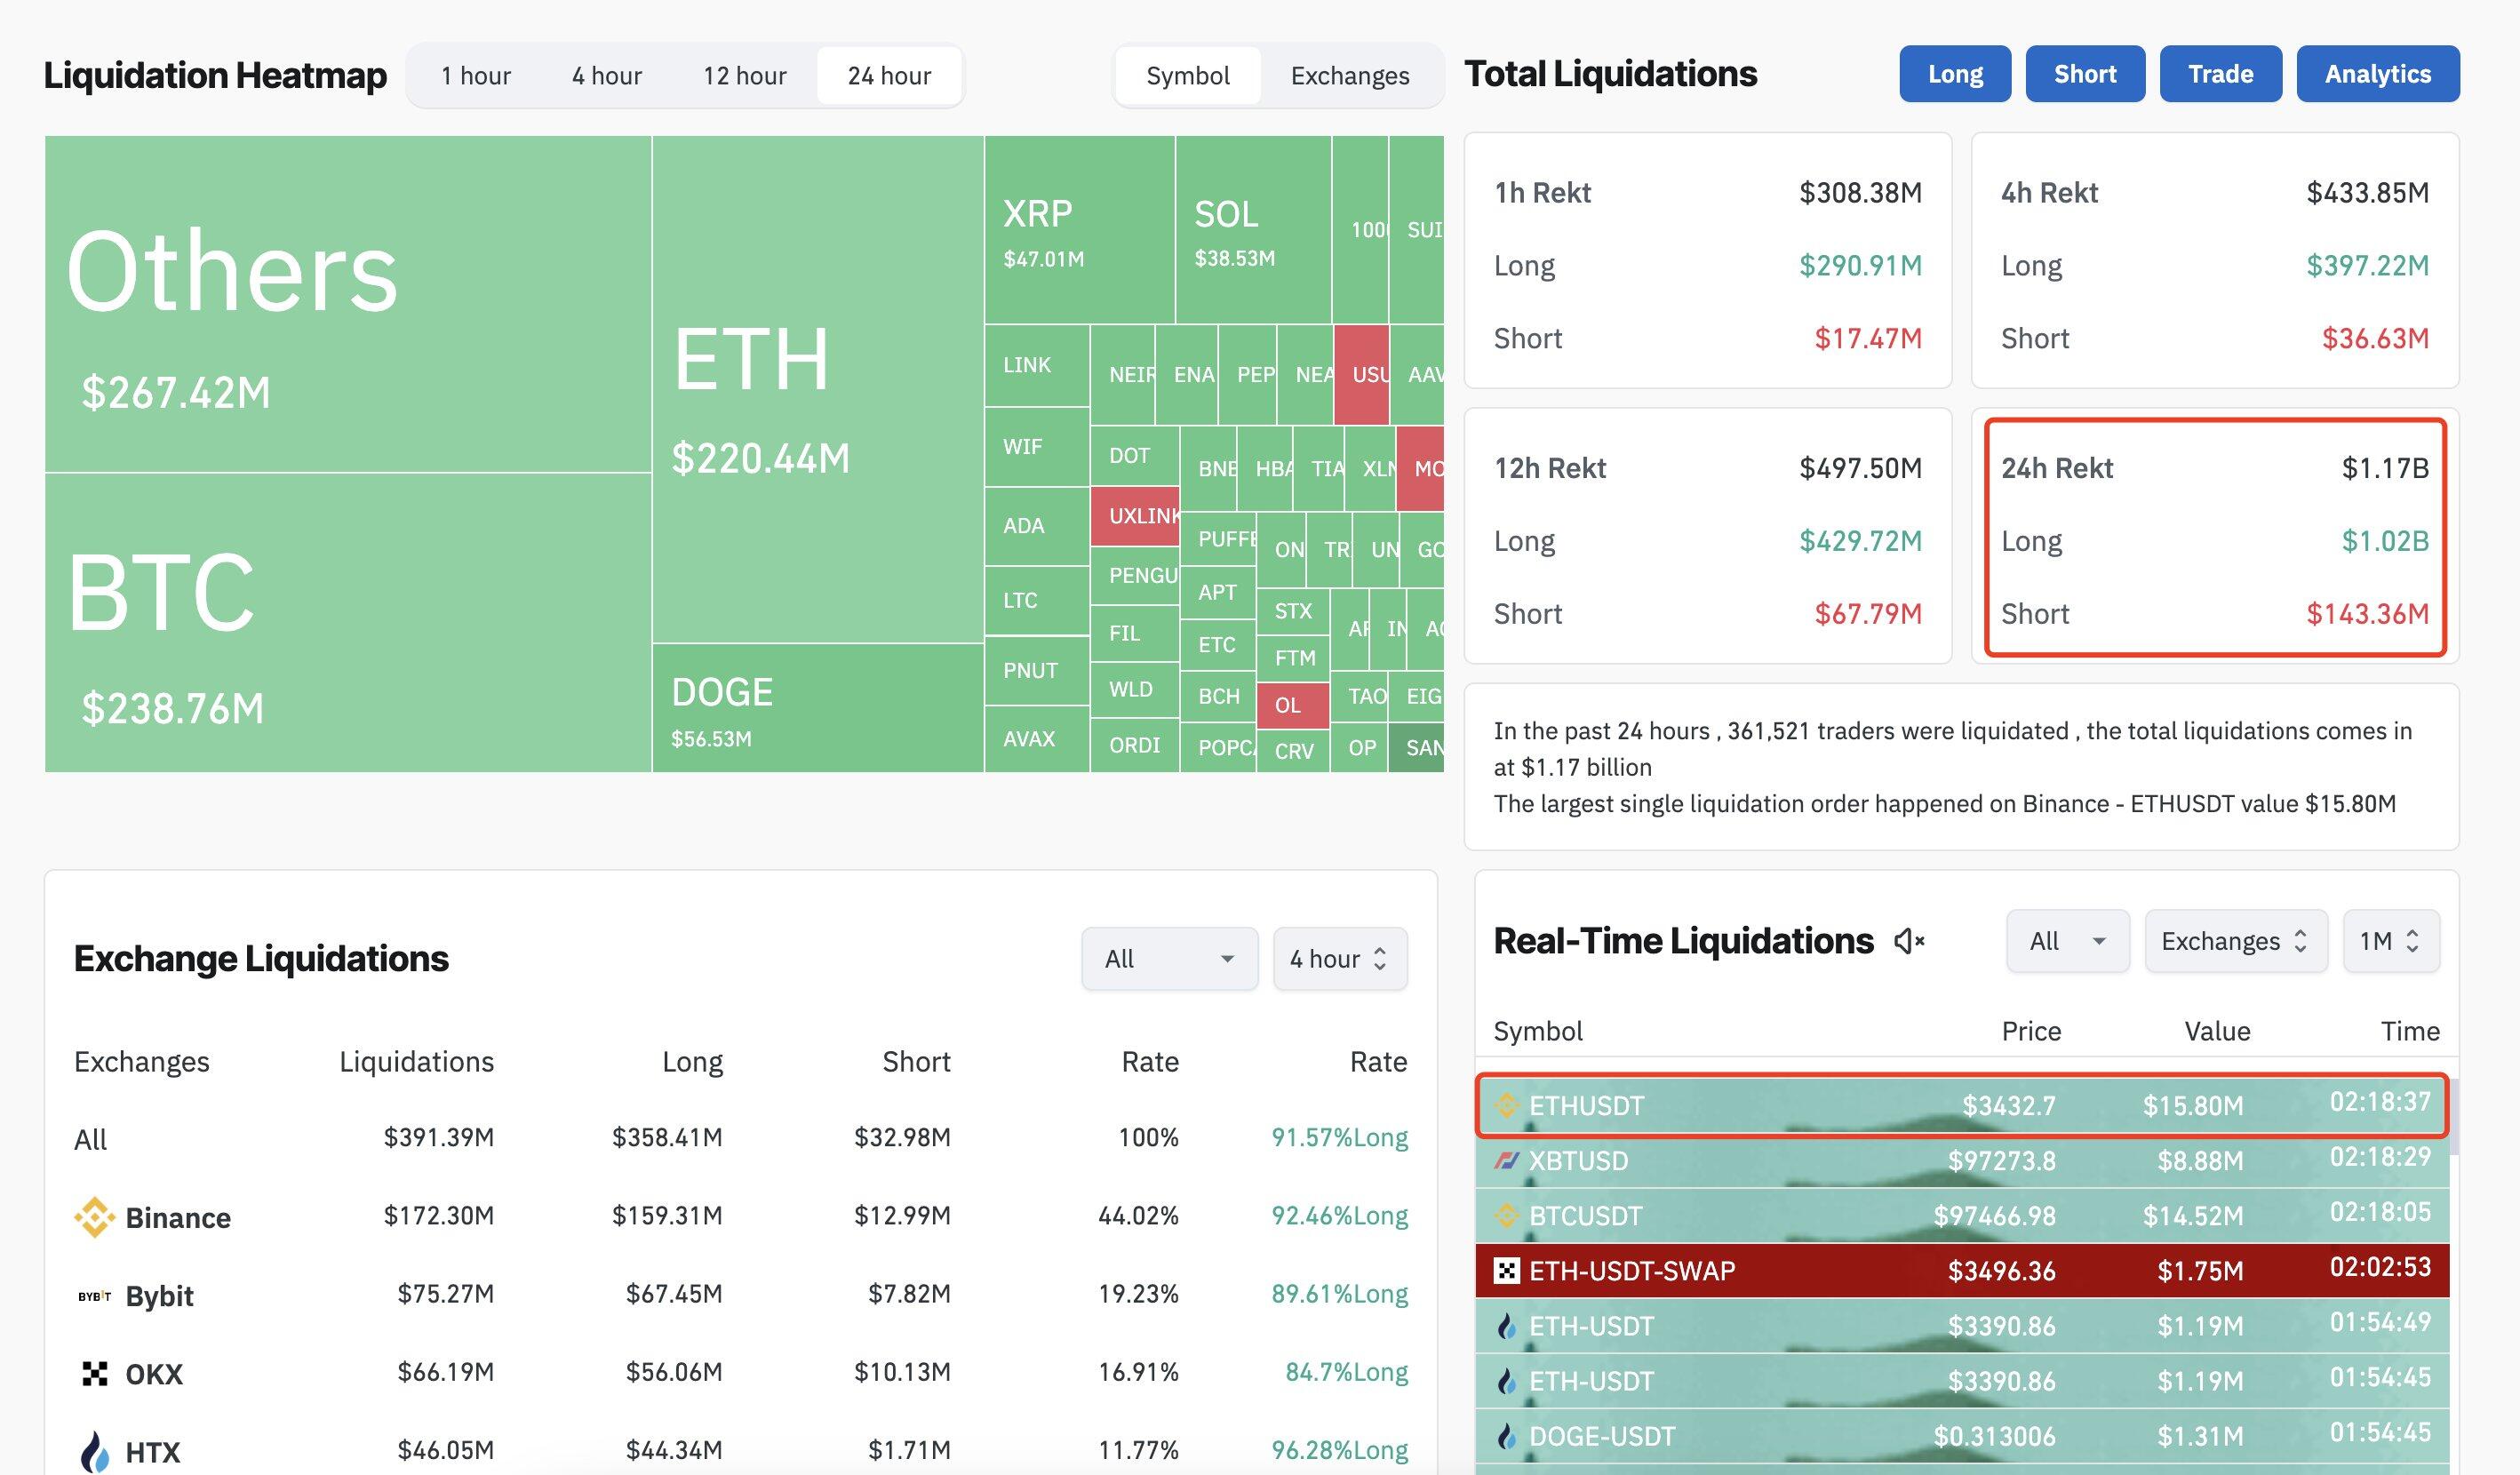
Liquidation chart. Source: Coinglass
Bitcoin price is poised for a decline as it closes below the $100K support level
Bitcoin price reached a new all-time high of $108,353 on Tuesday and declined 7.8% in the next two days, closing below the $100K support level. At the time of writing on Friday, it hovers around $97,500.
If BTC continues its correction, it could extend the decline to retest the $90,000 support level.
The Relative Strength Index (RSI) on the daily chart reads 49 below its neutral level of 50 and points downwards, indicating bearish momentum. The Moving Average Convergence Divergence (MACD) indicator also showed a bearish crossover on Wednesday, suggesting a downward trend.
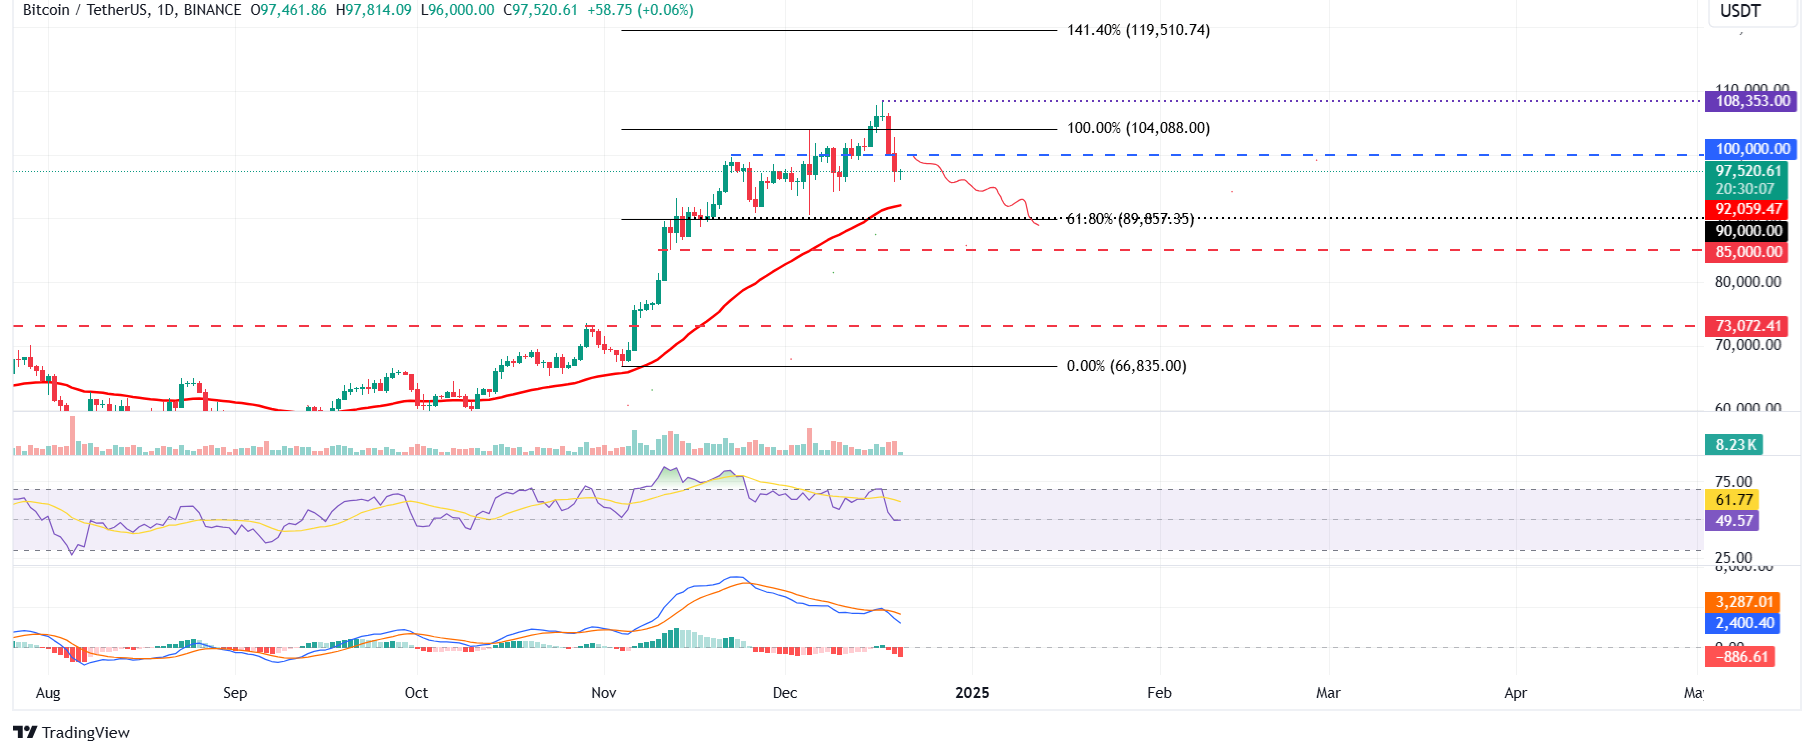
BTC/USDT daily chart
However, If BTC recovers and closes above $100,000, it could extend the rally to retest its all-time high (ATH) of $108,353.
Ethereum bears gain momentum
Ethereum price faced rejection around the $4,000 level on Monday and declined 14% over the next three days, closing below the $3,522 weekly level. At the time of writing on Friday, it trades at around $3,450.
If the $3,522 level holds as resistance and ETH closes below $3,335, it would extend the pullback to retest its next daily support at $3,029.
The RSI on the daily chart reads 42 below its neutral level of 50 and points downwards, indicating strong bearish momentum.
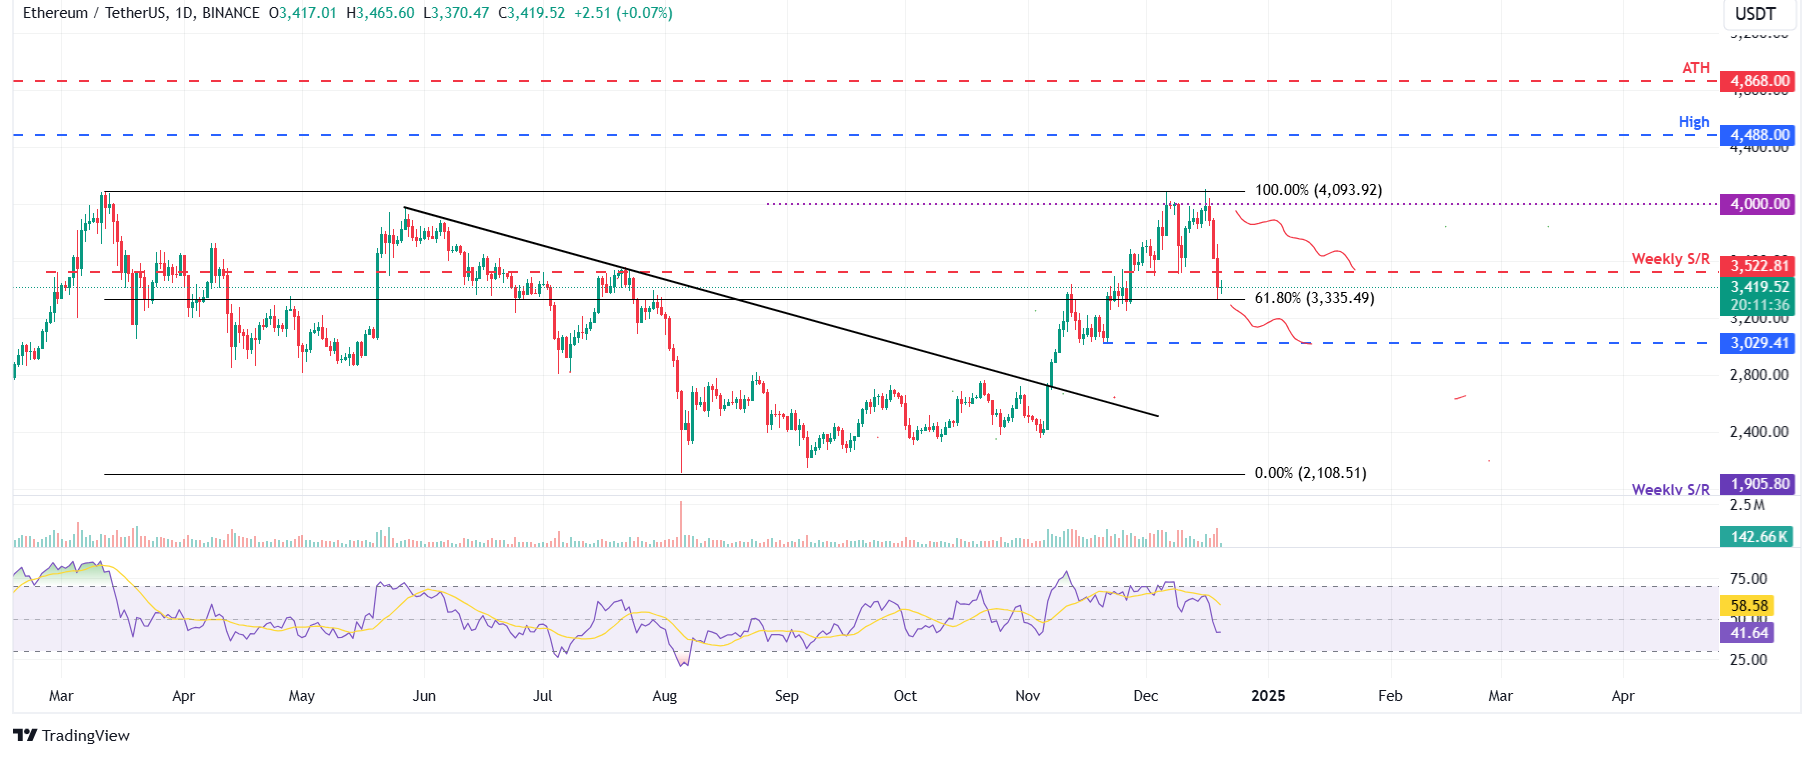
ETH/USDT daily chart
If ETH breaks and closes above the $3,522 level, it could extend the recovery to retest its $4,000 level.
Ripple bulls show signs of exhaustion
Ripple price faced rejection around the $2.66 level on Tuesday and declined 12.78% in the next two days. At the time of writing on Friday, it bounces off the $2.21 daily support level and trades around $2.33.
If XRP closes below the $2.21 support level, it could extend the decline to retest its next support level at $1.96.
The RSI on the daily chart reads 57 after rejecting the overbought level of 70 on Tuesday, suggesting signs of weakness in bullish momentum. If the RSI slips below the neutral level of 50, it could signal a sharp decline in Ripple price.
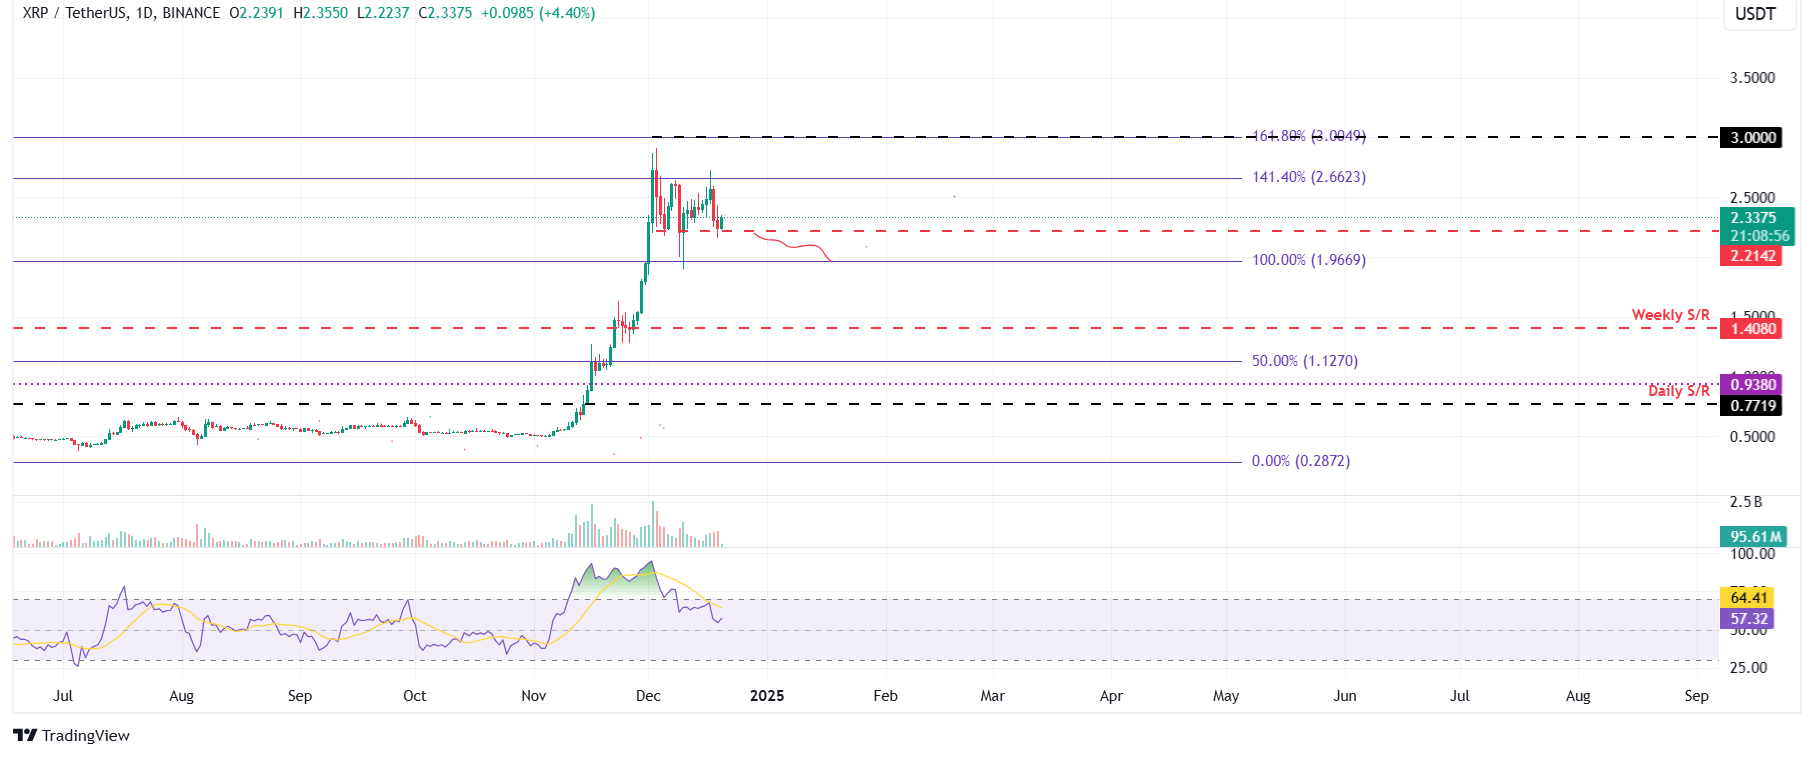
XRP/USDT daily chart
If XRP rises and closes above $2.66, it could extend the rally to retest the psychologically important level of $3.00.
Bitcoin, altcoins, stablecoins FAQs
Bitcoin is the largest cryptocurrency by market capitalization, a virtual currency designed to serve as money. This form of payment cannot be controlled by any one person, group, or entity, which eliminates the need for third-party participation during financial transactions.
Altcoins are any cryptocurrency apart from Bitcoin, but some also regard Ethereum as a non-altcoin because it is from these two cryptocurrencies that forking happens. If this is true, then Litecoin is the first altcoin, forked from the Bitcoin protocol and, therefore, an “improved” version of it.
Stablecoins are cryptocurrencies designed to have a stable price, with their value backed by a reserve of the asset it represents. To achieve this, the value of any one stablecoin is pegged to a commodity or financial instrument, such as the US Dollar (USD), with its supply regulated by an algorithm or demand. The main goal of stablecoins is to provide an on/off-ramp for investors willing to trade and invest in cryptocurrencies. Stablecoins also allow investors to store value since cryptocurrencies, in general, are subject to volatility.
Bitcoin dominance is the ratio of Bitcoin's market capitalization to the total market capitalization of all cryptocurrencies combined. It provides a clear picture of Bitcoin’s interest among investors. A high BTC dominance typically happens before and during a bull run, in which investors resort to investing in relatively stable and high market capitalization cryptocurrency like Bitcoin. A drop in BTC dominance usually means that investors are moving their capital and/or profits to altcoins in a quest for higher returns, which usually triggers an explosion of altcoin rallies.
Artigos Recomendados


