

Solana Price Forecast: Bearish grip tightens on SOL amid broader market sell-off

Fonte Fxstreet
  • Solana extends losses below $80 on Friday, continuing a corrective phase over the last six weeks, down 35%.
  • A broader market correction, with over $1 billion in total liquidations over the last 24 hours, weighs on SOL.
  • Derivatives data points to a sell-side dominance with heavy outflows and a declining taker buy-to-sell ratio.

Solana (SOL) is down 4% on Friday, extending losses below $80 and marking a nearly 10% decline so far this week. The broader cryptocurrency market is seeing heavy selling, with Bitcoin (BTC) diving below $70,000 and wiping out more than $1 billion in the derivatives market. This adds to the sell-side dominance in SOL futures amid persistent outflows. The technical outlook for SOL is bearish as downside momentum remains firm despite the asset entering oversold territory.

Crypto market liquidations cross $1 billion in 24 hours

Bitcoin’s slip below $70,000 on Friday mirrors Nvidia's decline, as CEO Jensen Huang resigns amid public and board scrutiny over personal relationships. CoinGlass data shows that the pullback wiped out $1.41 billion over the last 24 hours, with $1.26 billion in longs, reflecting a clear selling bias. 
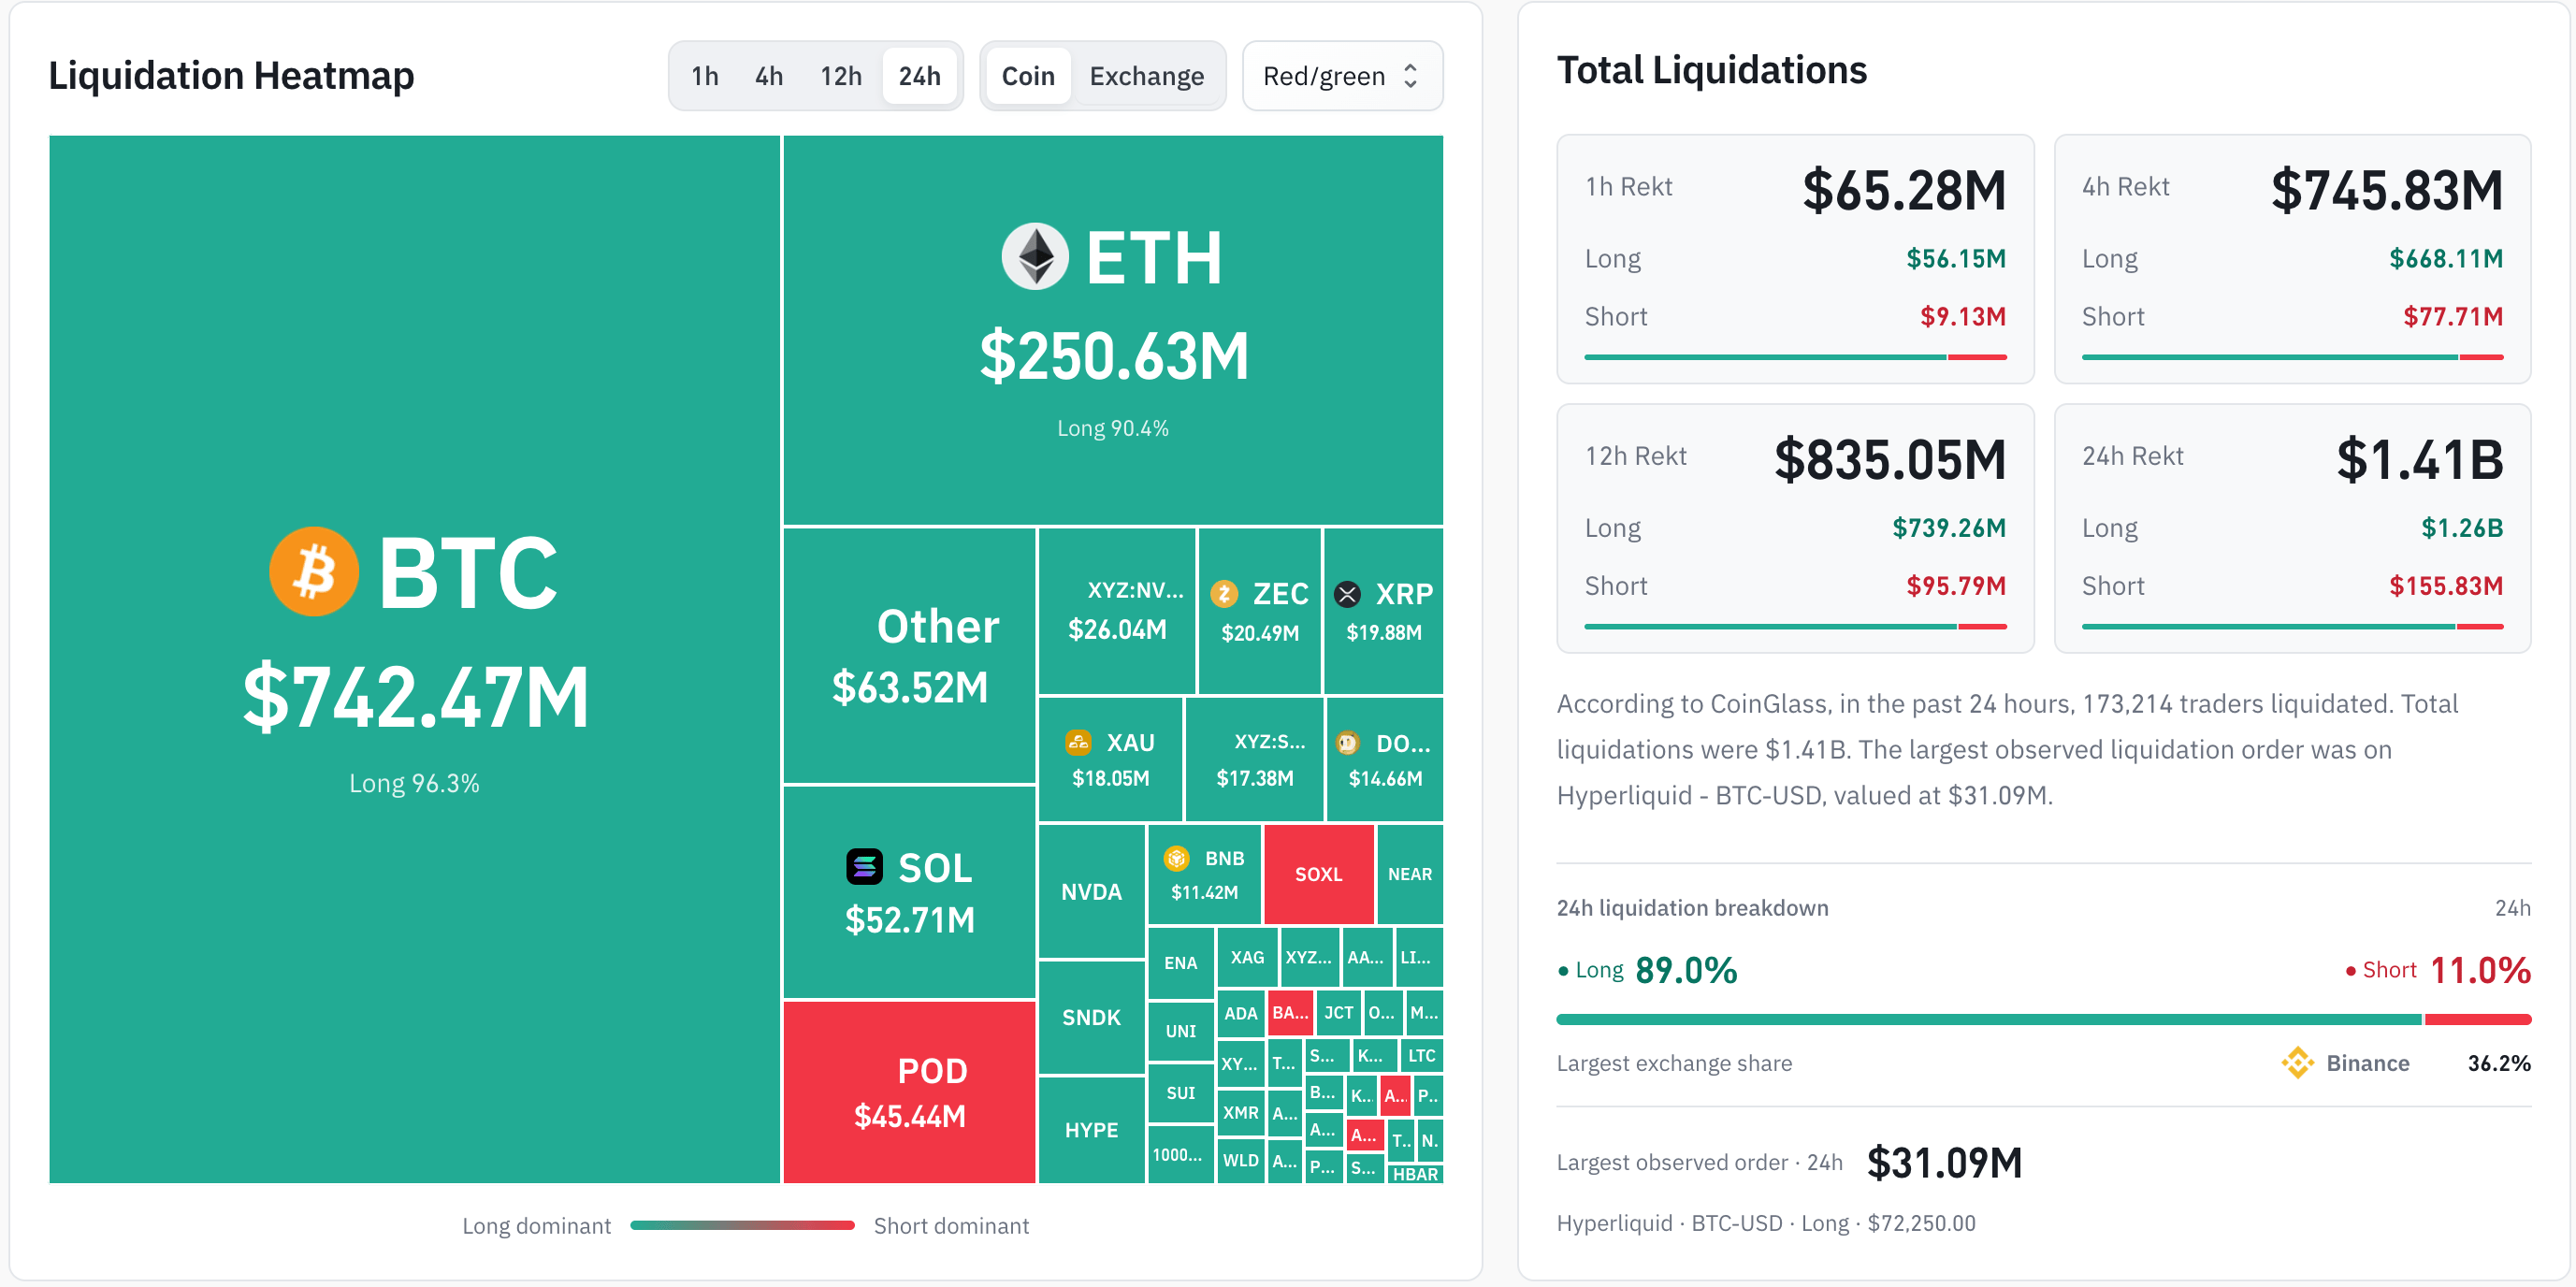
Crypto liquidation data. Source: CoinGlass

In the case of Solana, futures have seen $191 million in outflows so far on Friday, while spot market outflows have reached $8.80 million. In addition, the SOL taker buy-to-sell ratio around 0.90 has remained below 1 since late July, indicating a firm bearish bias among traders.

Taken together, the risk-off sentiment in the derivatives market strengthens amid uncertain broader market and macroeconomic conditions.
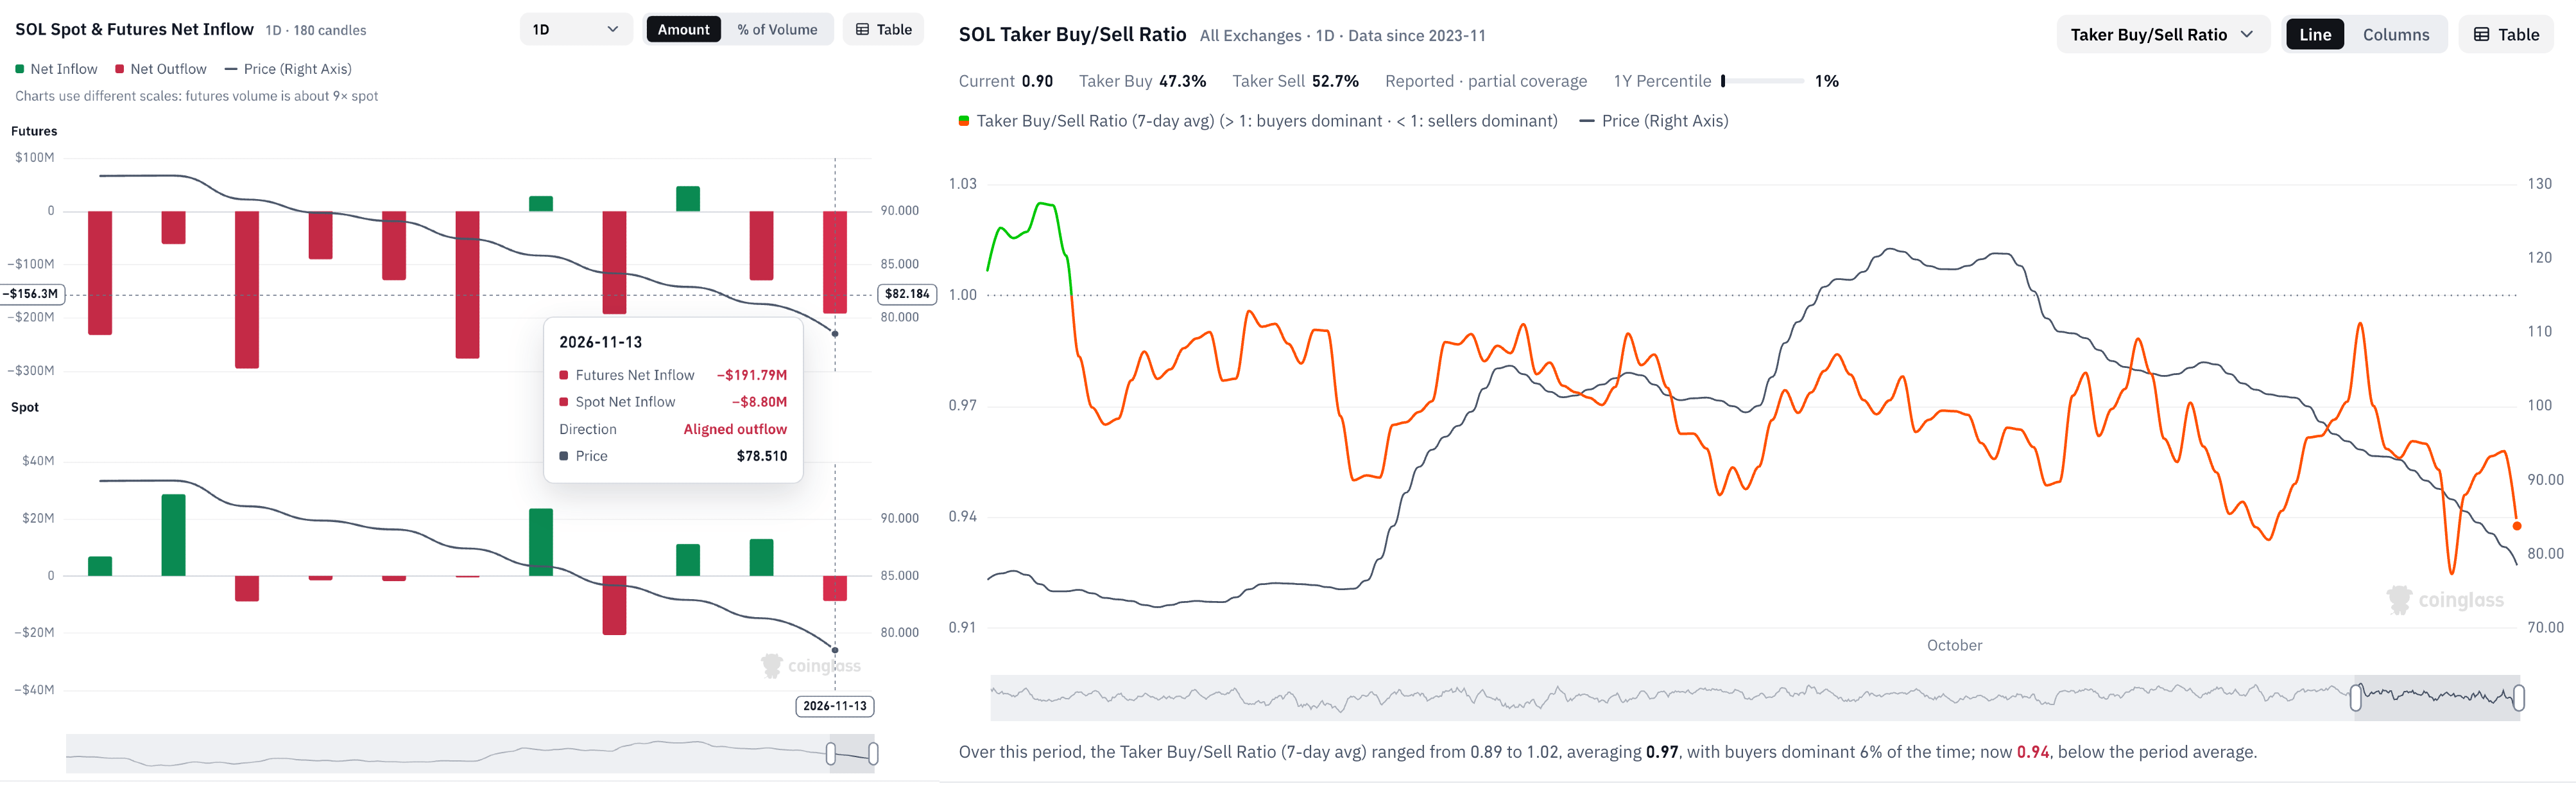
SOL derivatives data. Source: CoinGlass

Technical outlook: Will SOL crash to $70?

Solana hovers around $78.33 on Friday, continuing its steady decline after peaking above $120 in early October. The 50-day Exponential Moving Average (EMA) at $97.55 has fallen below the 200-day EMA at $98.62, forming a Death Cross pattern that indicates a bearish trend reversal.

The pair has also slipped beneath a previously supporting ascending trendline, now a broken barrier near $91.20, reinforcing the notion of a completed upswing. The immediate support for SOL stands at the $77.60 horizontal level, where a confirmed breakout could extend downside risk to $67.50.

Momentum conditions remain heavy, with the Relative Strength Index (RSI) pressed into oversold territory around 19 and the Moving Average Convergence Divergence (MACD) staying below zero, with the signal line at -0.96, hinting that selling pressure is gaining traction.

Chart Analysis SOL/USDT (Binance)
SOL/USDT daily price chart.

On the topside, initial resistance emerges at $87.46, followed by the horizontal cap at $95.82, before the more congested band of the 50-day and 200-day EMAs at $97.55 and $98.62 steps in as trend-defining supply.

(The technical analysis of this story was written with the help of an AI tool. Know more.)

Isenção de responsabilidade: Apenas para fins informativos. O desempenho passado não é indicativo de resultados futuros.
placeholder
Kospi apaga ganhos e cai abaixo de 5,300 enquanto SK Hynix cai 3%, SoftBank despenca 5%TradingKey - As ações do Japão e da Coreia do Sul divergiram à tarde, com o KOSPI virando para o campo negativo e fechando em baixa de 0,98%, enquanto o Nikkei subiu 0,53% e reconquistou a marca dos 6
Autor  TradingKey
Ontem 09: 19
TradingKey - As ações do Japão e da Coreia do Sul divergiram à tarde, com o KOSPI virando para o campo negativo e fechando em baixa de 0,98%, enquanto o Nikkei subiu 0,53% e reconquistou a marca dos 6
placeholder
Ethereum cai abaixo de US$ 2.000 após despencar mais de 20% em um mês, enquanto chances de reteste de US$ 1.500 disparamTradingKey - Ethereum despenca mais de 20% em um mês e corre o risco de retestar US$ 1.500 após perder a linha de defesa de US$ 2.000.Em 13 de novembro, o Ethereum (ETH) despencou mais de 5%, caindo o
Autor  TradingKey
Ontem 09: 18
TradingKey - Ethereum despenca mais de 20% em um mês e corre o risco de retestar US$ 1.500 após perder a linha de defesa de US$ 2.000.Em 13 de novembro, o Ethereum (ETH) despencou mais de 5%, caindo o
placeholder
Ouro retoma US$ 3.900 após mínima no ano, mas Fed e dólar alto limitam ganhosO ouro (XAU/USD) ganha certa tração positiva durante a sessão asiática desta sexta-feira, voltando a subir acima da marca de US$ 3.900 e interrompendo uma sequência de três dias de perdas que o levou ao seu menor nível desde o final de setembro, atingido na véspera.
Autor  FXStreet
Ontem 06: 02
O ouro (XAU/USD) ganha certa tração positiva durante a sessão asiática desta sexta-feira, voltando a subir acima da marca de US$ 3.900 e interrompendo uma sequência de três dias de perdas que o levou ao seu menor nível desde o final de setembro, atingido na véspera.
placeholder
Previsão de Preço do Bitcoin: Inflação Acima do Esperado nos EUA Derruba o BTC Abaixo de US$ 74.000 Enquanto Touros Miram Suporte de US$ 73.000TradingKey - Na quinta-feira (12 de novembro), o Bitcoin (BTC) deu continuidade à sua recente tendência de baixa. Durante a sessão europeia de hoje, o Bitcoin caiu abaixo de US$ 74.000 no intradiário,
Autor  TradingKey
11 Mês 12 Dia Qui
TradingKey - Na quinta-feira (12 de novembro), o Bitcoin (BTC) deu continuidade à sua recente tendência de baixa. Durante a sessão europeia de hoje, o Bitcoin caiu abaixo de US$ 74.000 no intradiário,
placeholder
Índice do Dólar atinge máxima de quase 19 meses acima de 103 com avanço das apostas em alta de juros pelo Fed, USD/JPY se aproxima de 160TradingKey - Em 12 de novembro, o Índice Dólar ampliou sua recente trajetória de alta durante o pregão asiático, rompendo brevemente a marca de 103 no intradia para atingir a máxima de 103,08, alcança
Autor  TradingKey
11 Mês 12 Dia Qui
TradingKey - Em 12 de novembro, o Índice Dólar ampliou sua recente trajetória de alta durante o pregão asiático, rompendo brevemente a marca de 103 no intradia para atingir a máxima de 103,08, alcança
Produtos relacionados
goTop
quote