


Bitcoin vs Gold Outlook: BTC downtrend gains momentum, XAU pares losses as US PPI rises
- Bitcoin sellers strengthen their grip as BTC struggles to reclaim the $70,000 level on Friday.
- Gold ticks up above $3,900 after three straight days of declines, but its recovery could lag under key technical indicators.
- US PPI shows that headline producer inflation rose 0.3% in October and 6.5% YoY, the highest annual rate since November 2022.
Bitcoin (BTC) trades under pressure, reflecting weak sentiment in the broader cryptocurrency market on Friday. The Crypto King hovers around $69,000 as bulls struggle to calm the situation after a sharp correction, largely driven by risk-off sentiment after Jensen Huang, Nvidia Co-founder and CEO, resigned.
Gold (XAU/USD), meanwhile, hovers marginally above $3,900 after weathering a three-day correction to lows around $3,852. The metal is currently paring losses and may build recovery momentum toward the pivotal $4,000 level.
US PPI rises in October
The United States (US) producer inflation, as measured by the change in the Producer Price Index (PPI), rose 0.3% in October, seasonally adjusted, according to the Bureau of Labor Statistics (BLS) report released on Friday. This print followed the final 1.4% (revised from 1.3%) increase recorded in September.
On an annual basis, producer inflation rose 6.5% in October, from 6.3% in September. This is the highest rate since November 2022 and came in below market expectations of 6.6%.
PPI, excluding volatile food and energy prices, rose 0.3% and 5% on a monthly and annual basis, respectively, matching analysts' estimates.
Gold continues its gradual increase after the PPI data, while Bitcoin struggles to gain momentum above $69,000. Gold's return above $4,000 and Bitcoin’s potential comeback above $70,000 could boost the short-term recovery outlook for both assets.
However, appetite for digital assets remains significantly subdued, as reflected in the Fear & Greed Index, which sits at 20 in the Extreme Fear territory on Friday, down from 28 in the Fear region the day before.
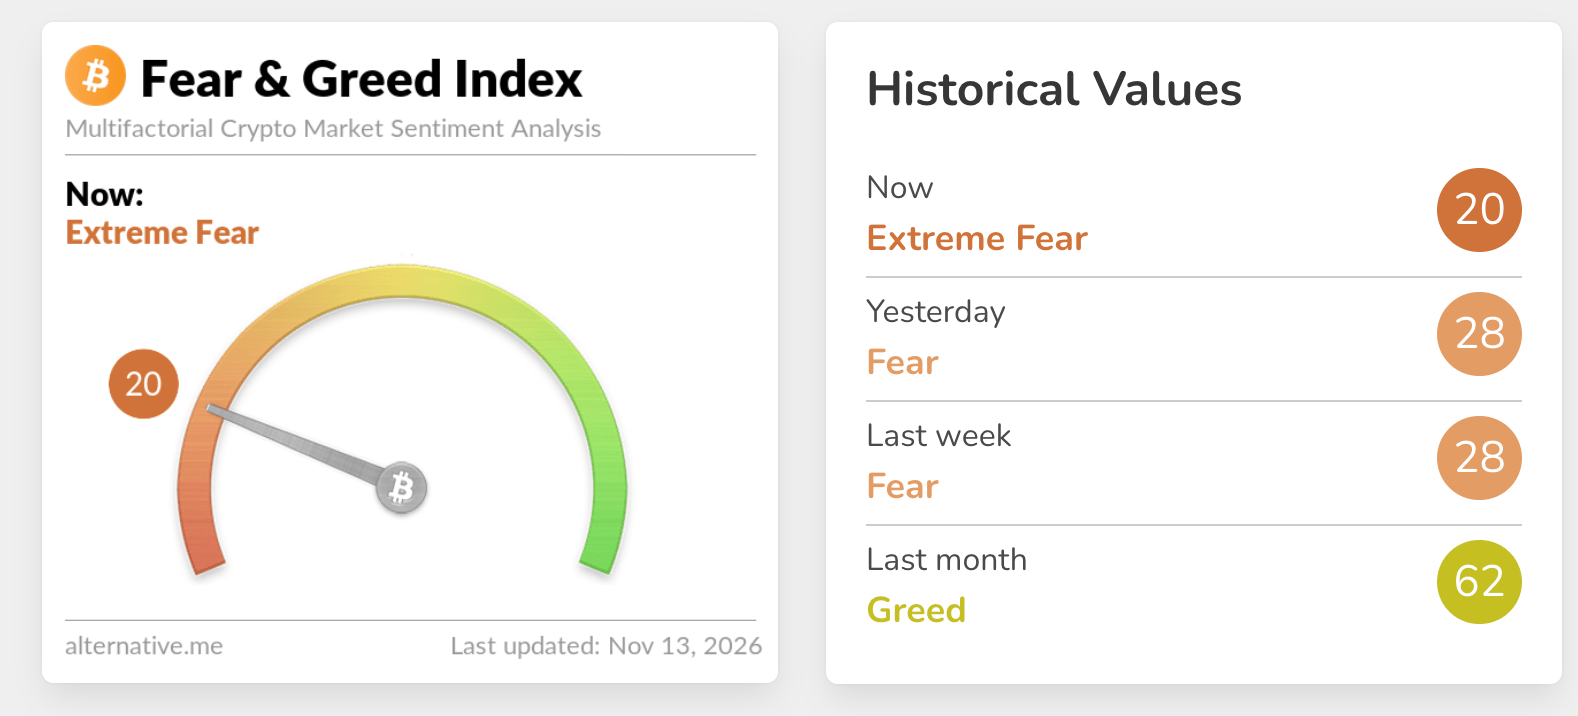
In perspective, investors appear to be retreating to the sidelines, repositioning their portfolios ahead of the Federal Reserve (Fed) meeting in December. Market participants widely expect the Fed to raise interest rates in the 4.00-4.25% range after holding in October, a factor that could continue to weigh on market sentiment.
Technical analysis: Bitcoin struggles to find a floor
Bitcoin trades at $69,232, extending a bearish phase as it holds well below all key Exponential Moving Averages and the SuperTrend line. The 50-day EMA at $78,245, the 100-day EMA at $77,208, and the 200-day EMA at $76,6417 all sit overhead, suggesting that the broader trend remains under downside pressure while the SuperTrend at $77,026 reinforces a capped tone.
Momentum is weak, with the Moving Average Convergence Divergence (MACD) below zero and the Relative Strength Index (RSI) near 26 in oversold territory, suggesting sellers are in control.
Initial resistance lies at the 200-day EMA near $76,641, followed by the SuperTrend barrier at $77,026 and the 100-day EMA at $77,208, with the 50-day EMA at $78,245 acting as a higher resistance threshold. A daily close above this stacked cluster of moving averages would be needed to ease the current bearish bias and open the way to a more constructive tone.
On the downside, the chart shows no nearby mapped support levels, leaving price action exposed to further declines until new demand emerges.
Technical analysis: Gold eyes return above $4,000
Gold trades at $3,905 as bulls push to regain control. Despite the mild recovery, the metal remains bearish in the near term as price holds below the 50-day, 100-day, and 200-day EMAs at $4,123, $4,211, and $4,246, respectively. The SuperTrend line at $4,163 reinforces persistent overhead supply, while momentum remains fragile, with the MACD below its zero line and the RSI hovering near 40, hinting at weak but not yet oversold downside pressure.
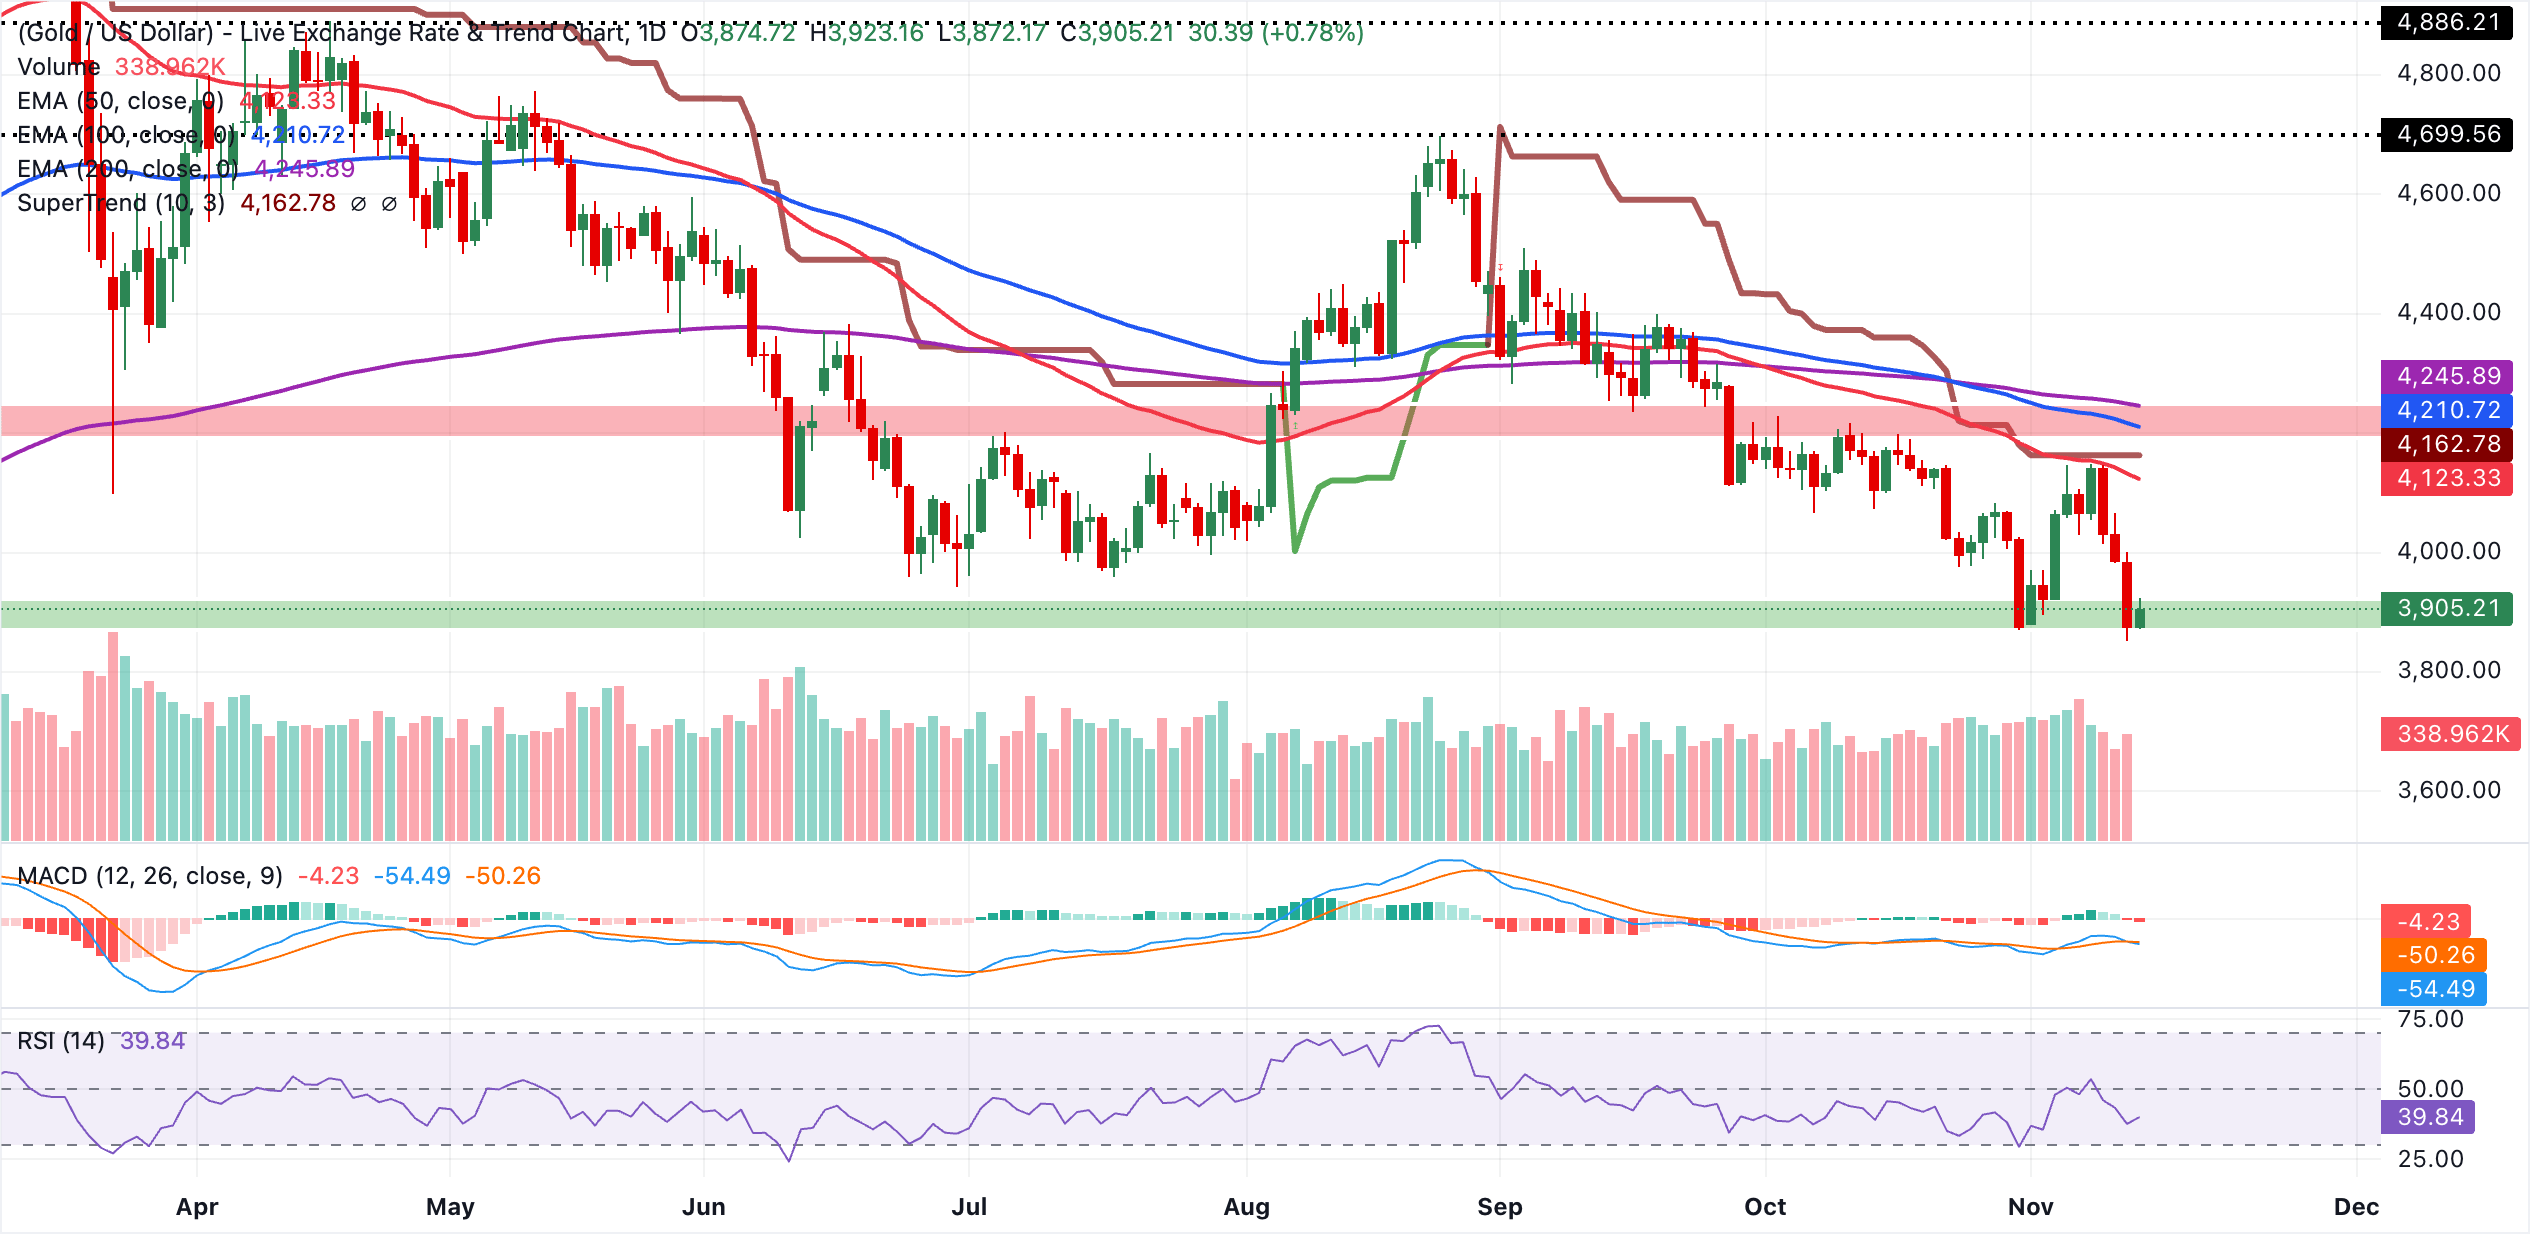
Initial resistance aligns with the 50-day EMA at $4,123, ahead of a stronger barrier at the SuperTrend level near $4,163. Further up, the 100-day EMA at $4,211 and the 200-day EMA at $4,246 cap the broader recovery scope, and the bearish bias is likely to persist while XAU/USD remains entrenched beneath this stacked resistance cluster.
(The technical analysis of this story was written with the help of an AI tool. Know more.)
Bitcoin, altcoins, stablecoins FAQs
Bitcoin is the largest cryptocurrency by market capitalization, a virtual currency designed to serve as money. This form of payment cannot be controlled by any one person, group, or entity, which eliminates the need for third-party participation during financial transactions.
Altcoins are any cryptocurrency apart from Bitcoin, but some also regard Ethereum as a non-altcoin because it is from these two cryptocurrencies that forking happens. If this is true, then Litecoin is the first altcoin, forked from the Bitcoin protocol and, therefore, an “improved” version of it.
Stablecoins are cryptocurrencies designed to have a stable price, with their value backed by a reserve of the asset it represents. To achieve this, the value of any one stablecoin is pegged to a commodity or financial instrument, such as the US Dollar (USD), with its supply regulated by an algorithm or demand. The main goal of stablecoins is to provide an on/off-ramp for investors willing to trade and invest in cryptocurrencies. Stablecoins also allow investors to store value since cryptocurrencies, in general, are subject to volatility.
Bitcoin dominance is the ratio of Bitcoin's market capitalization to the total market capitalization of all cryptocurrencies combined. It provides a clear picture of Bitcoin’s interest among investors. A high BTC dominance typically happens before and during a bull run, in which investors resort to investing in relatively stable and high market capitalization cryptocurrency like Bitcoin. A drop in BTC dominance usually means that investors are moving their capital and/or profits to altcoins in a quest for higher returns, which usually triggers an explosion of altcoin rallies.
Artigos Recomendados


