


Silver Price Forecast: XAG/USD remains trapped in descending channel
- Silver heads for a weekly loss of over 5% as Fed rate hike bets support the US Dollar.
- XAG/USD remains trapped in a descending channel on the daily chart, trading below major moving averages.
- RSI near 33 and fading MACD histogram bars point to weak momentum.
Silver (XAG/USD) slides back below $50 on Friday and is on track for a weekly loss of more than 5% as traders bet on more aggressive Federal Reserve (Fed) tightening in the months ahead. At the time of writing, Silver trades around $49, just above its year-to-date low of $48.87 touched on October 30.
This week’s US consumer and producer inflation reports and hawkish Fed remarks prompted traders to fully price in a rate hike in December, according to the CME FedWatch Tool. A quarter-point move is favoured, with a small chance of a half-point increase. The US Dollar Index (DXY) trades near 103.40, its highest level since April 2025, while the 10-year US Treasury yield is back above 5%, up about 30 basis points this week.
A stronger US Dollar makes Silver more expensive for buyers using other currencies, while higher Treasury yields raise the opportunity cost of holding the non-yielding metal. With buyers largely on the sidelines, the technical indicators also point to weak momentum.
Technical analysis
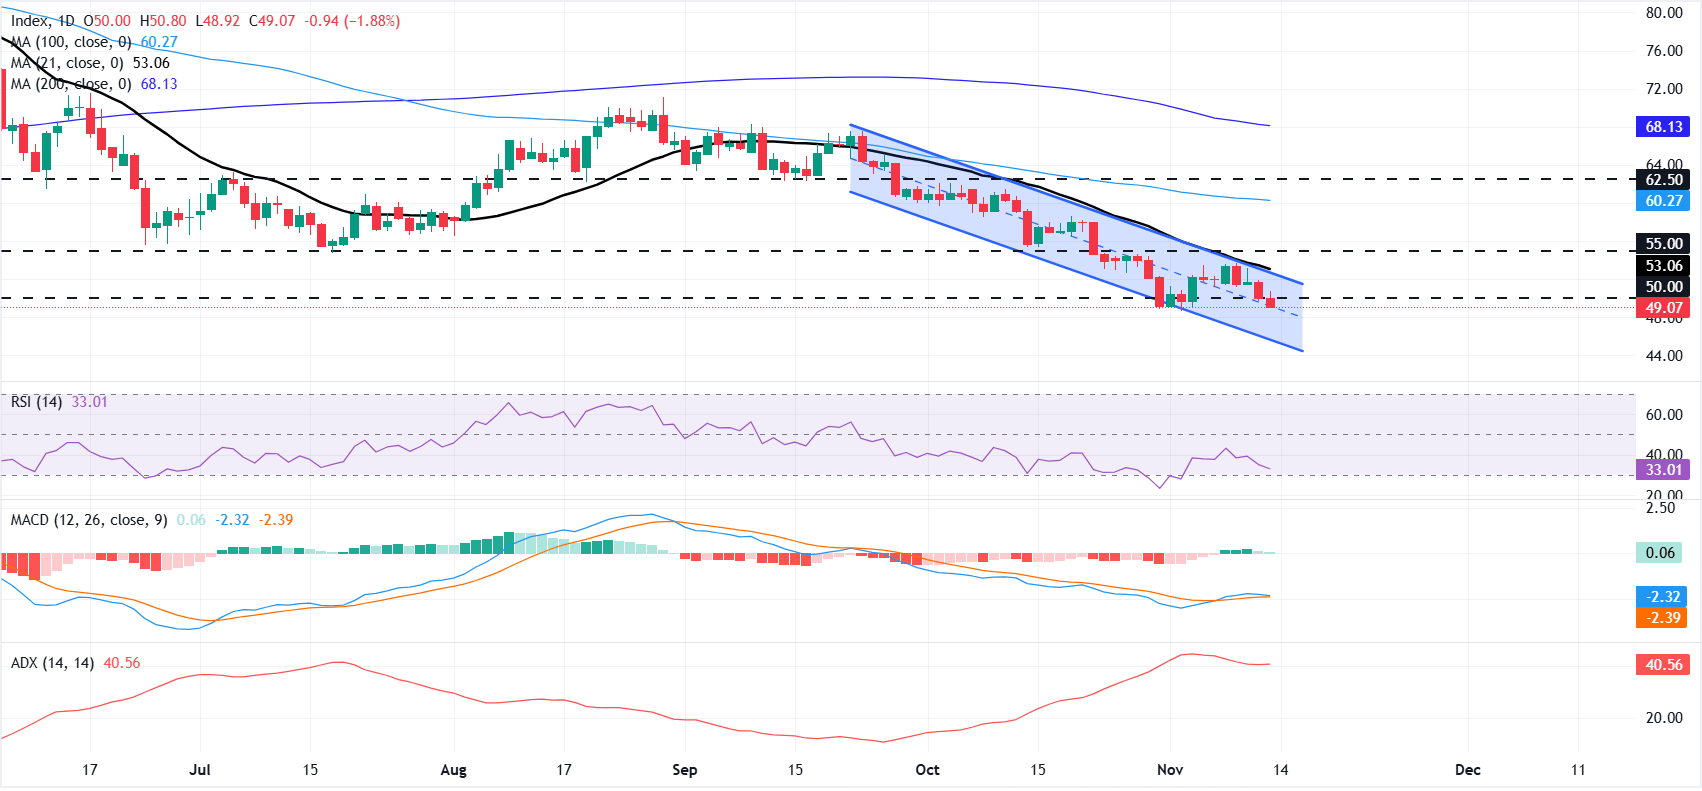
On the daily chart, XAG/USD extends its slide within a well-defined downward parallel channel and is holding below all major moving averages. The 21-day simple moving average (SMA, the 100-day SMA, and the 200-day SMA all sit overhead, reinforcing a bearish near-term bias while price remains capped beneath this layered resistance.
Momentum remains weak, with the 14-day Relative Strength Index (RSI) near 33, just above oversold territory. Meanwhile, the Moving Average Convergence Divergence (MACD) remains marginally positive, but fading green histogram bars suggest that the recent recovery in momentum is losing steam.
On the topside, initial resistance emerges at the psychological $50.00 mark, followed by the upper boundary of the descending channel near $52.17 and the 21-day SMA at $53.06, forming a dense supply zone before the next hurdle at $55.00. Higher up, the 100-day SMA at $60.27 and a horizontal barrier at $62.50 precede the long-term cap from the 200-day SMA at $68.13, which anchors the broader bearish structure.
On the downside, the channel floor around $45 offers the next notable support, and a clear break beneath this level would open the way for an extension of the prevailing downtrend.
(The technical analysis of this story was written with the help of an AI tool. Know more.)
Silver FAQs
Silver is a precious metal highly traded among investors. It has been historically used as a store of value and a medium of exchange. Although less popular than Gold, traders may turn to Silver to diversify their investment portfolio, for its intrinsic value or as a potential hedge during high-inflation periods. Investors can buy physical Silver, in coins or in bars, or trade it through vehicles such as Exchange Traded Funds, which track its price on international markets.
Silver prices can move due to a wide range of factors. Geopolitical instability or fears of a deep recession can make Silver price escalate due to its safe-haven status, although to a lesser extent than Gold's. As a yieldless asset, Silver tends to rise with lower interest rates. Its moves also depend on how the US Dollar (USD) behaves as the asset is priced in dollars (XAG/USD). A strong Dollar tends to keep the price of Silver at bay, whereas a weaker Dollar is likely to propel prices up. Other factors such as investment demand, mining supply – Silver is much more abundant than Gold – and recycling rates can also affect prices.
Silver is widely used in industry, particularly in sectors such as electronics or solar energy, as it has one of the highest electric conductivity of all metals – more than Copper and Gold. A surge in demand can increase prices, while a decline tends to lower them. Dynamics in the US, Chinese and Indian economies can also contribute to price swings: for the US and particularly China, their big industrial sectors use Silver in various processes; in India, consumers’ demand for the precious metal for jewellery also plays a key role in setting prices.
Silver prices tend to follow Gold's moves. When Gold prices rise, Silver typically follows suit, as their status as safe-haven assets is similar. The Gold/Silver ratio, which shows the number of ounces of Silver needed to equal the value of one ounce of Gold, may help to determine the relative valuation between both metals. Some investors may consider a high ratio as an indicator that Silver is undervalued, or Gold is overvalued. On the contrary, a low ratio might suggest that Gold is undervalued relative to Silver.
Artigos Recomendados


