


Top Altcoins Price Forecast: Ripple, Cardano and Solana halt decline amid signs of exhaustion
- Ripple hovers around $1.05 on Thursday after roughly a 20% decline over the last seven days.
- Cardano continues to defend a crucial support floor around $0.1712 as selling pressure moderates.
- Solana takes a breather above $83, with bears eyeing the next support level near $77.60.
Top altcoins, Ripple (XRP), Cardano (ADA), and Solana (SOL), hold steady on Thursday, halting the prevailing decline linked to hot US inflation data and the post-US midterms period. The brief pause suggests that the markets have priced in October’s hot CPI of 0.4%, beating the 0.3% market expectation.
However, the market focus is now shifting to the upcoming October US Producer Price Index (PPI) on Friday. US commodity inflation is forecast to rise by 0.4% month-on-month, and any upside surprise could further weigh on November’s Consumer Price Index (CPI).
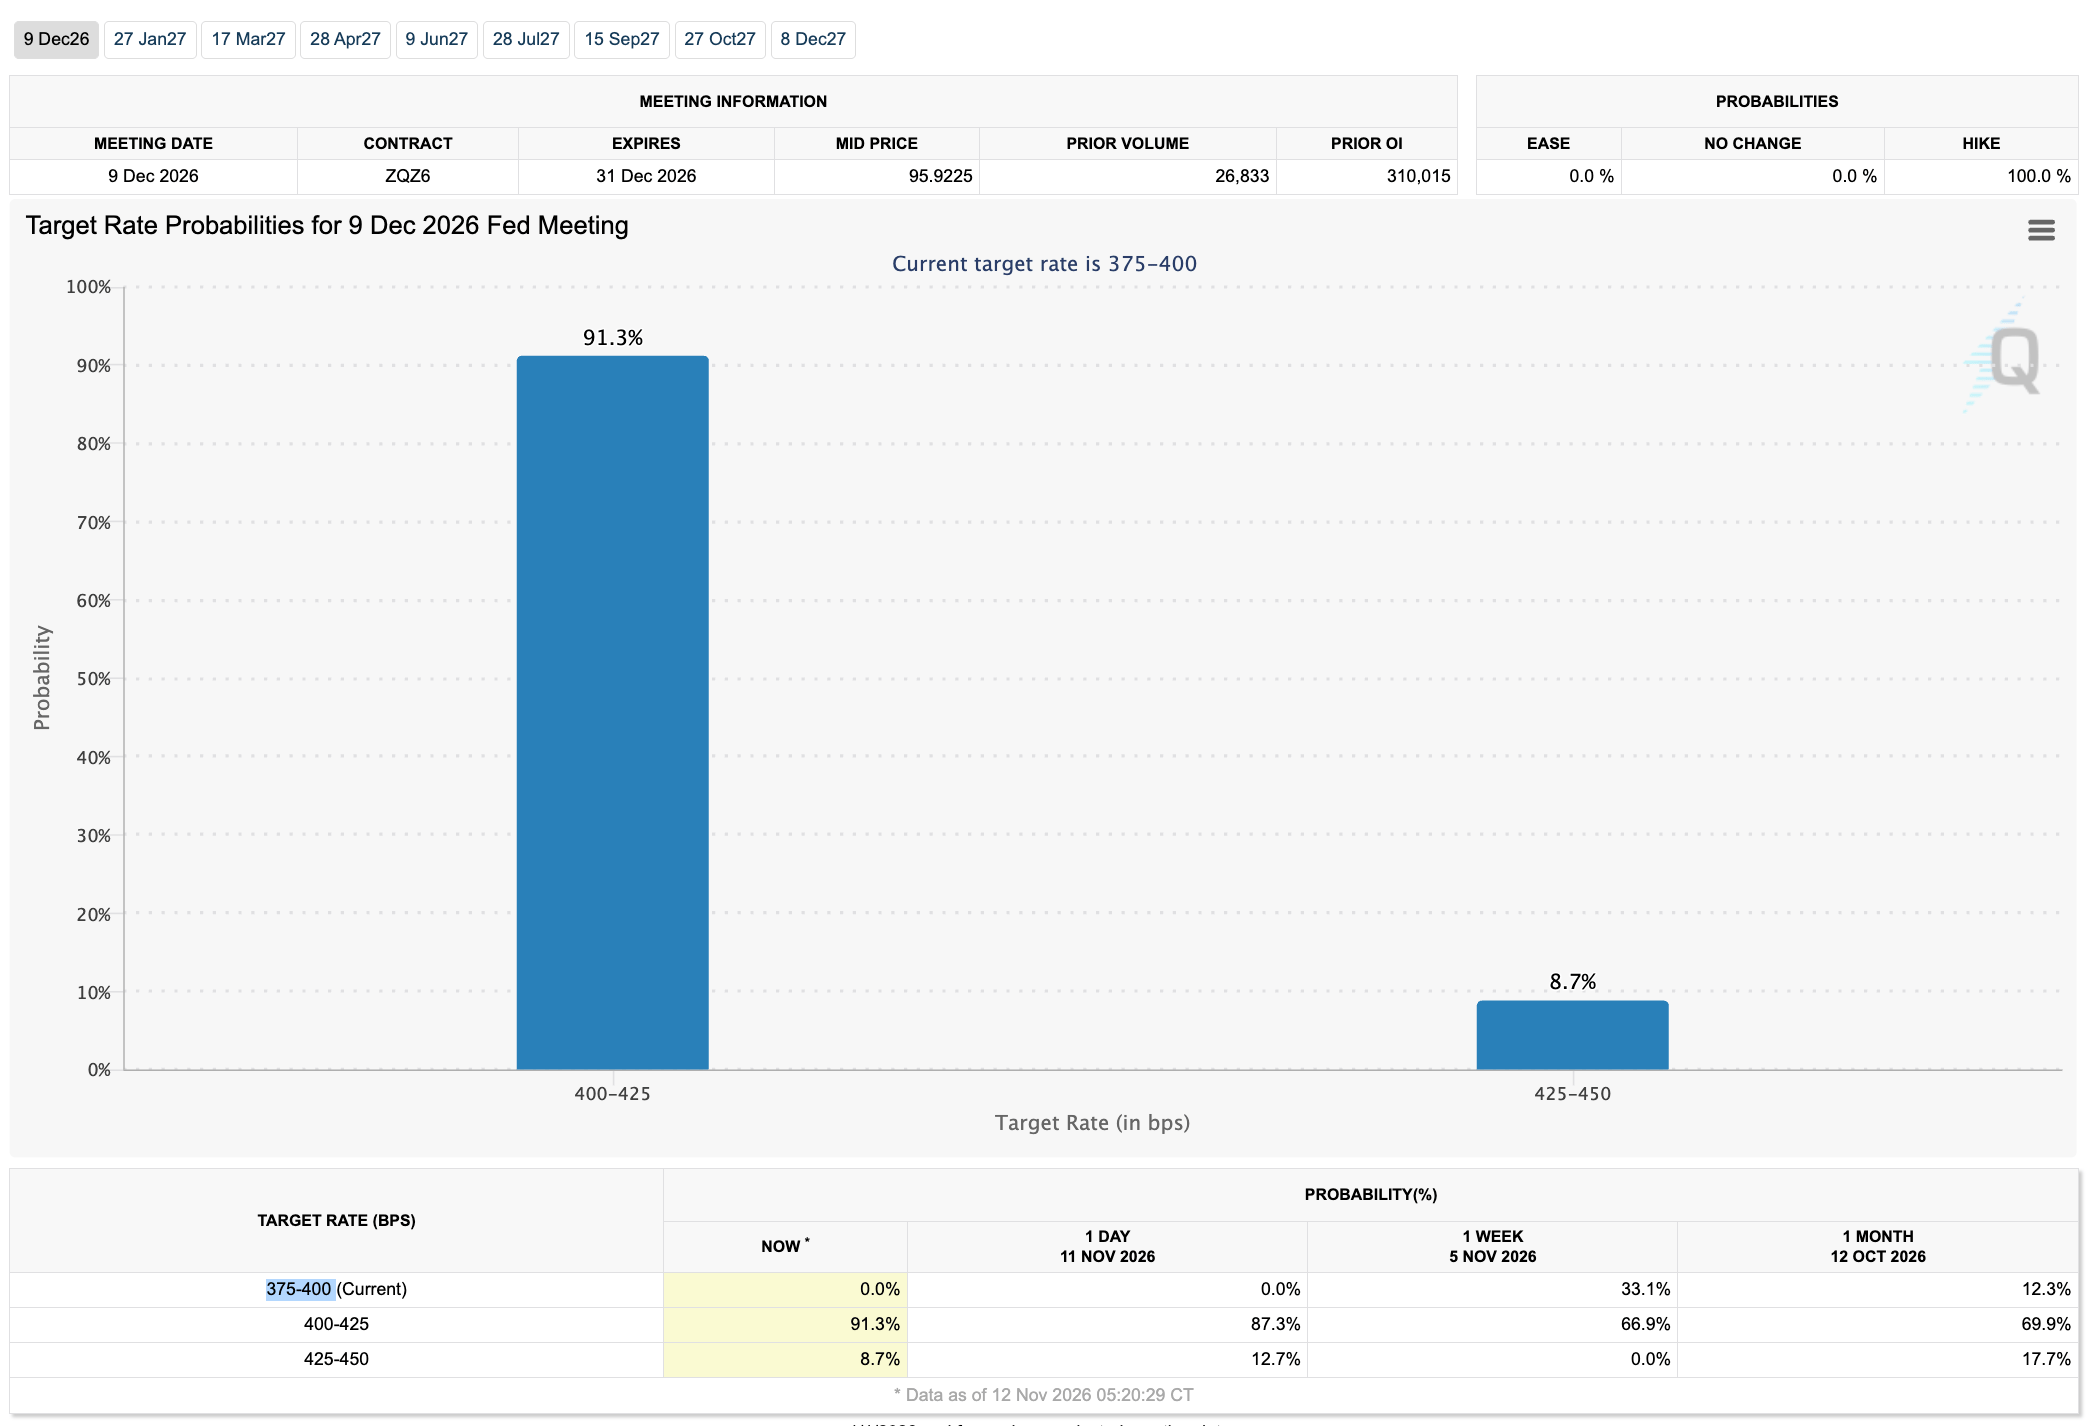
A hot October PPI report, similar to the US CPI, could further boost the selling pressure in the crypto market and raise concerns about a 50-basis-point (bps) rate hike. The CME FedWatch Tool shows a 91% probability of a 25-basis-point rate hike from the current range of 3.75%-4.00%.
Still, the current technical outlook for XRP, ADA, and SOL shows signs of consolidation, which could provide a rebound floor if the broader market uncertainty eases.
XRP Technical Analysis: Can bulls defend the $1 mark?
Ripple hovers above the $1.0000 psychological threshold, taking a breather after a roughly 20% decline over the last seven days. The 50-day and 200-day Exponential Moving Averages (EMAs) at $1.2746 and $1.3421, respectively, are sloping downward, reaffirming the bearish trend.
The pair also remains under a descending trendline around $1.3313, keeping the broader structure capped, while immediate topside pressure is reinforced by horizontal resistance at $1.0692. To reinstate an upward trend, XRP must reclaim these barriers.
Momentum remains weak as the Relative Strength Index (RSI) hovers near 24 in oversold territory, and the Moving Average Convergence Divergence (MACD) line declines into negative territory, suggesting a persistent downside bias.
The path of least resistance for XRP points below $1.0000, targeting the $0.9862 support level, set by the annual low on August 14.
Cardano technical outlook: Near-term support in focus as selling pressure wanes
Cardano hovers above the $0.1712 support level on Thursday, reflecting a near-term pause after roughly 35% losses over the last six weeks. ADA extends its decline well below both the 50-day and 200-day EMA at $0.2054 and $0.2245, respectively, and the former rising trendline support, now a barrier near $0.2069.
A sustained breakout below $0.1712 could extend the ADA decline toward the $0.1537 horizontal support set by the July 27 low.
Momentum shows signs of exhaustion, with the RSI flatlining just above the oversold band at around 31, and the MACD converging with the signal line as the histogram wanes toward zero, hinting at moderating downside pressure.
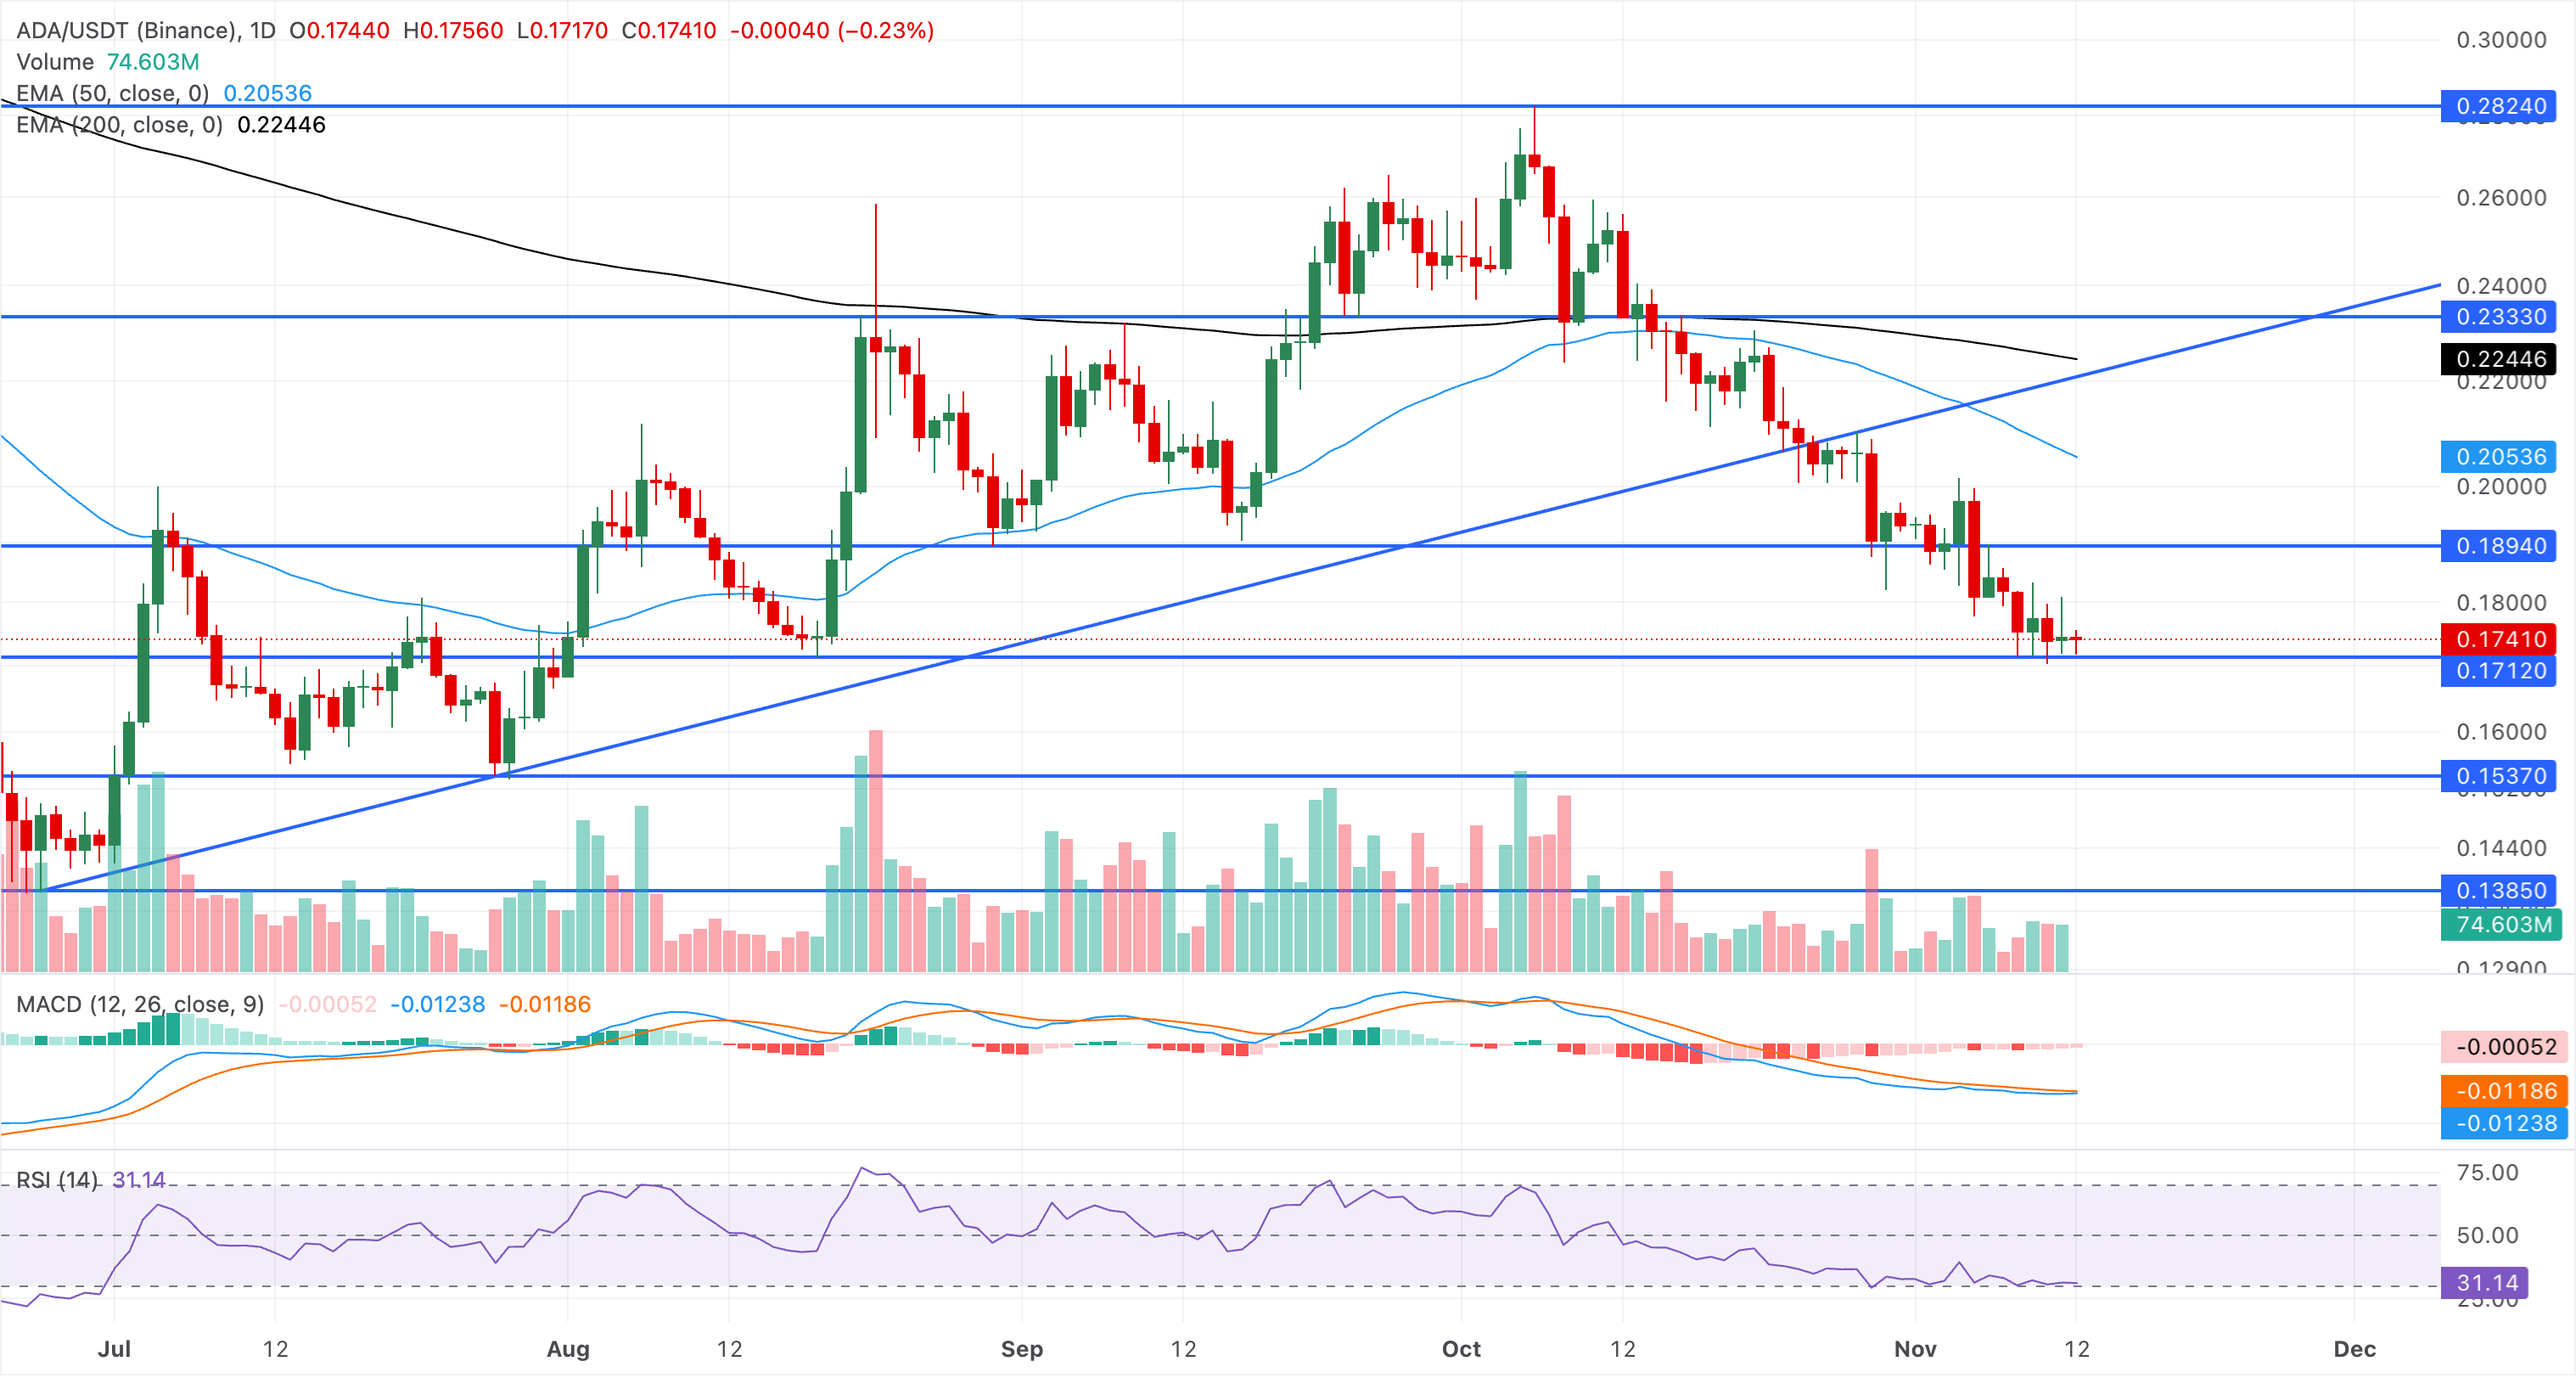
Looking up, initial resistance is seen at the horizontal level of $0.1894, ahead of a denser supply zone formed by the 50-day EMA at $0.2054 and the broken rising trendline near $0.2069.
Technical analysis: Solana
Solana trades at $83.31 at press time on Thursday, extending a bearish phase below the 50-day and 200-day EMAs, which are near $98.40 and $98.74, respectively, acting as a dense overhead cap. In addition, the 50-day EMA is on the verge of crossing below the longer-term EMA, a pattern commonly referred to as a Death Cross, which could confirm a bearish trend reversal.
The RSI at 23 indicates oversold conditions, while the MACD remains below the zero line, suggesting that downside momentum remains dominant despite the downtrend being overextended.
The initial support for SOL is seen at the horizontal floor around $77.60, where a confirmed breakout could extend the decline toward deeper cushions at $67.50 and $60.13.
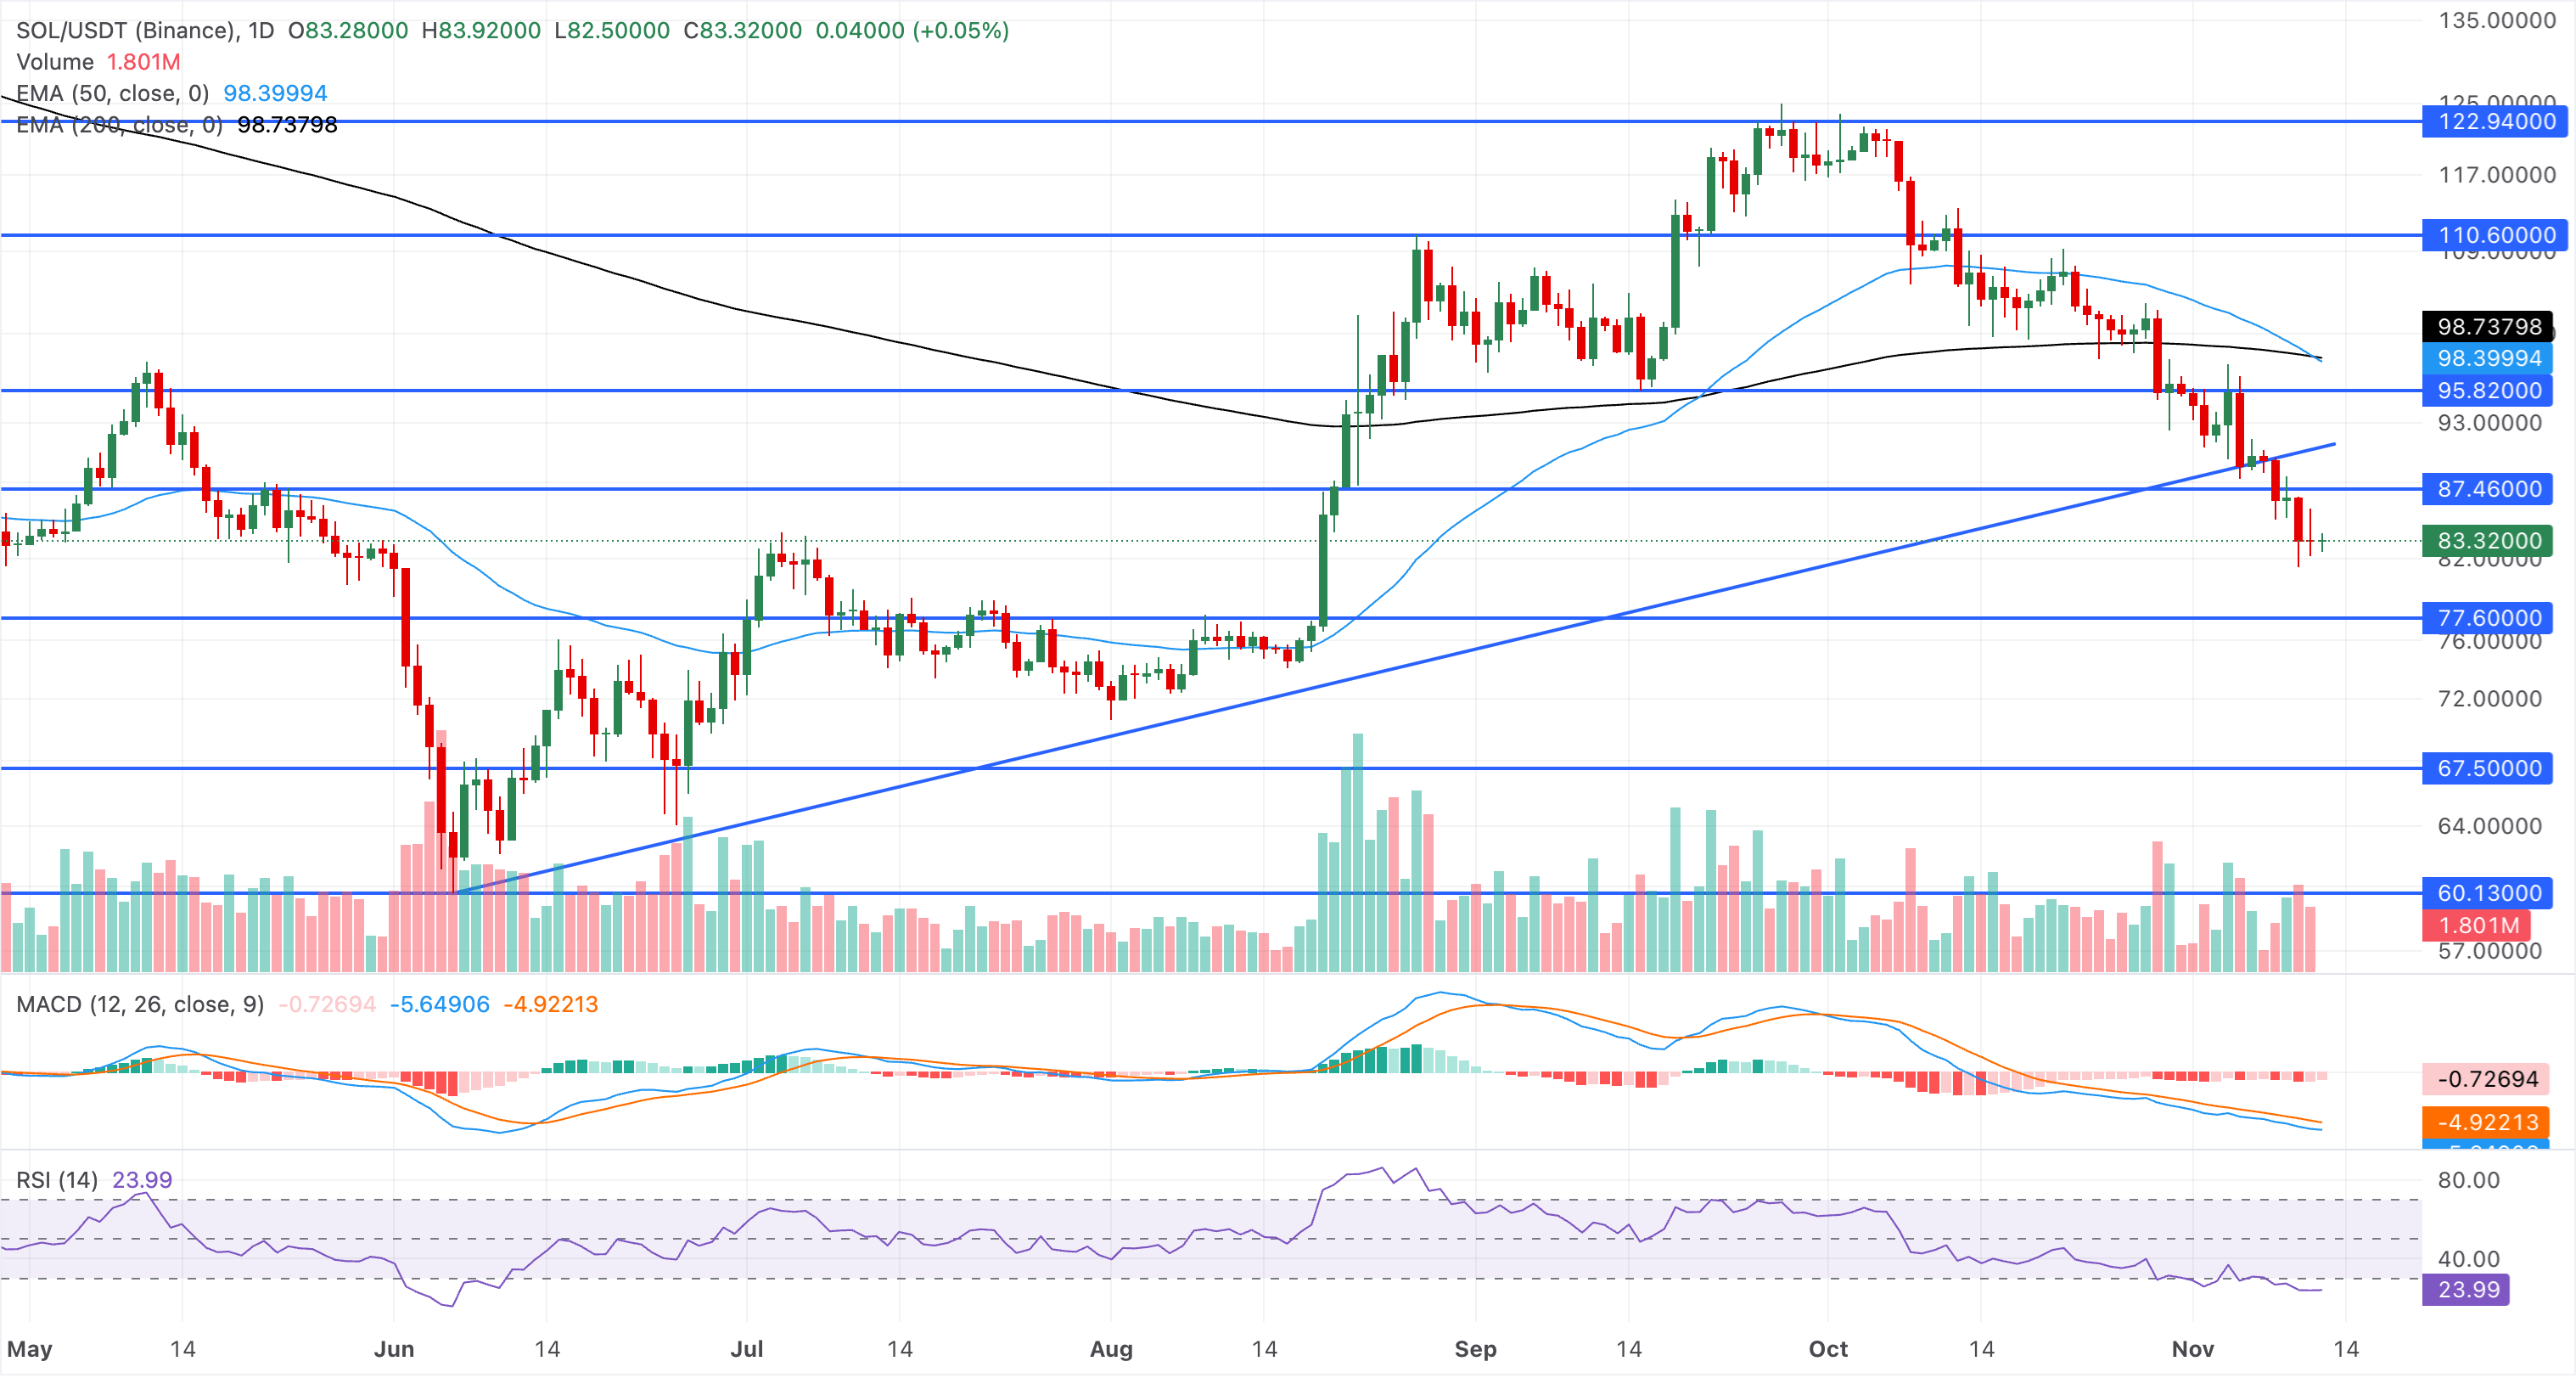
On the topside, the first hurdle appears at $87.46, with further resistance at the broken trendline near $91.05 and at the $95.82 horizontal barrier.
(The technical analysis of this story was written with the help of an AI tool. Know more.)
Artigos Recomendados


