


Crypto Today: Bitcoin, Ethereum, and Ripple extend downtrend as selling pressure mounts
- Bitcoin hovers below $75,000 on Monday, after falling more than 4% last week, marking its fifth straight weekly decline.
- Ethereum holds steady above $2,100, taking a breather after a 5% drop the previous day.
- Ripple edges lower for the fifth consecutive day, inching closer to the $1.00 psychological level.
Major cryptocurrencies, including Bitcoin (BTC), Ethereum (ETH), and Ripple (XRP), maintain a broadly corrective tone, extending losses from the previous week. Risk-off sentiment builds in the crypto market following last week’s correction linked to Democrats sweeping the US midterms, raising concerns about crypto regulation and Artificial Intelligence (AI) advancement.
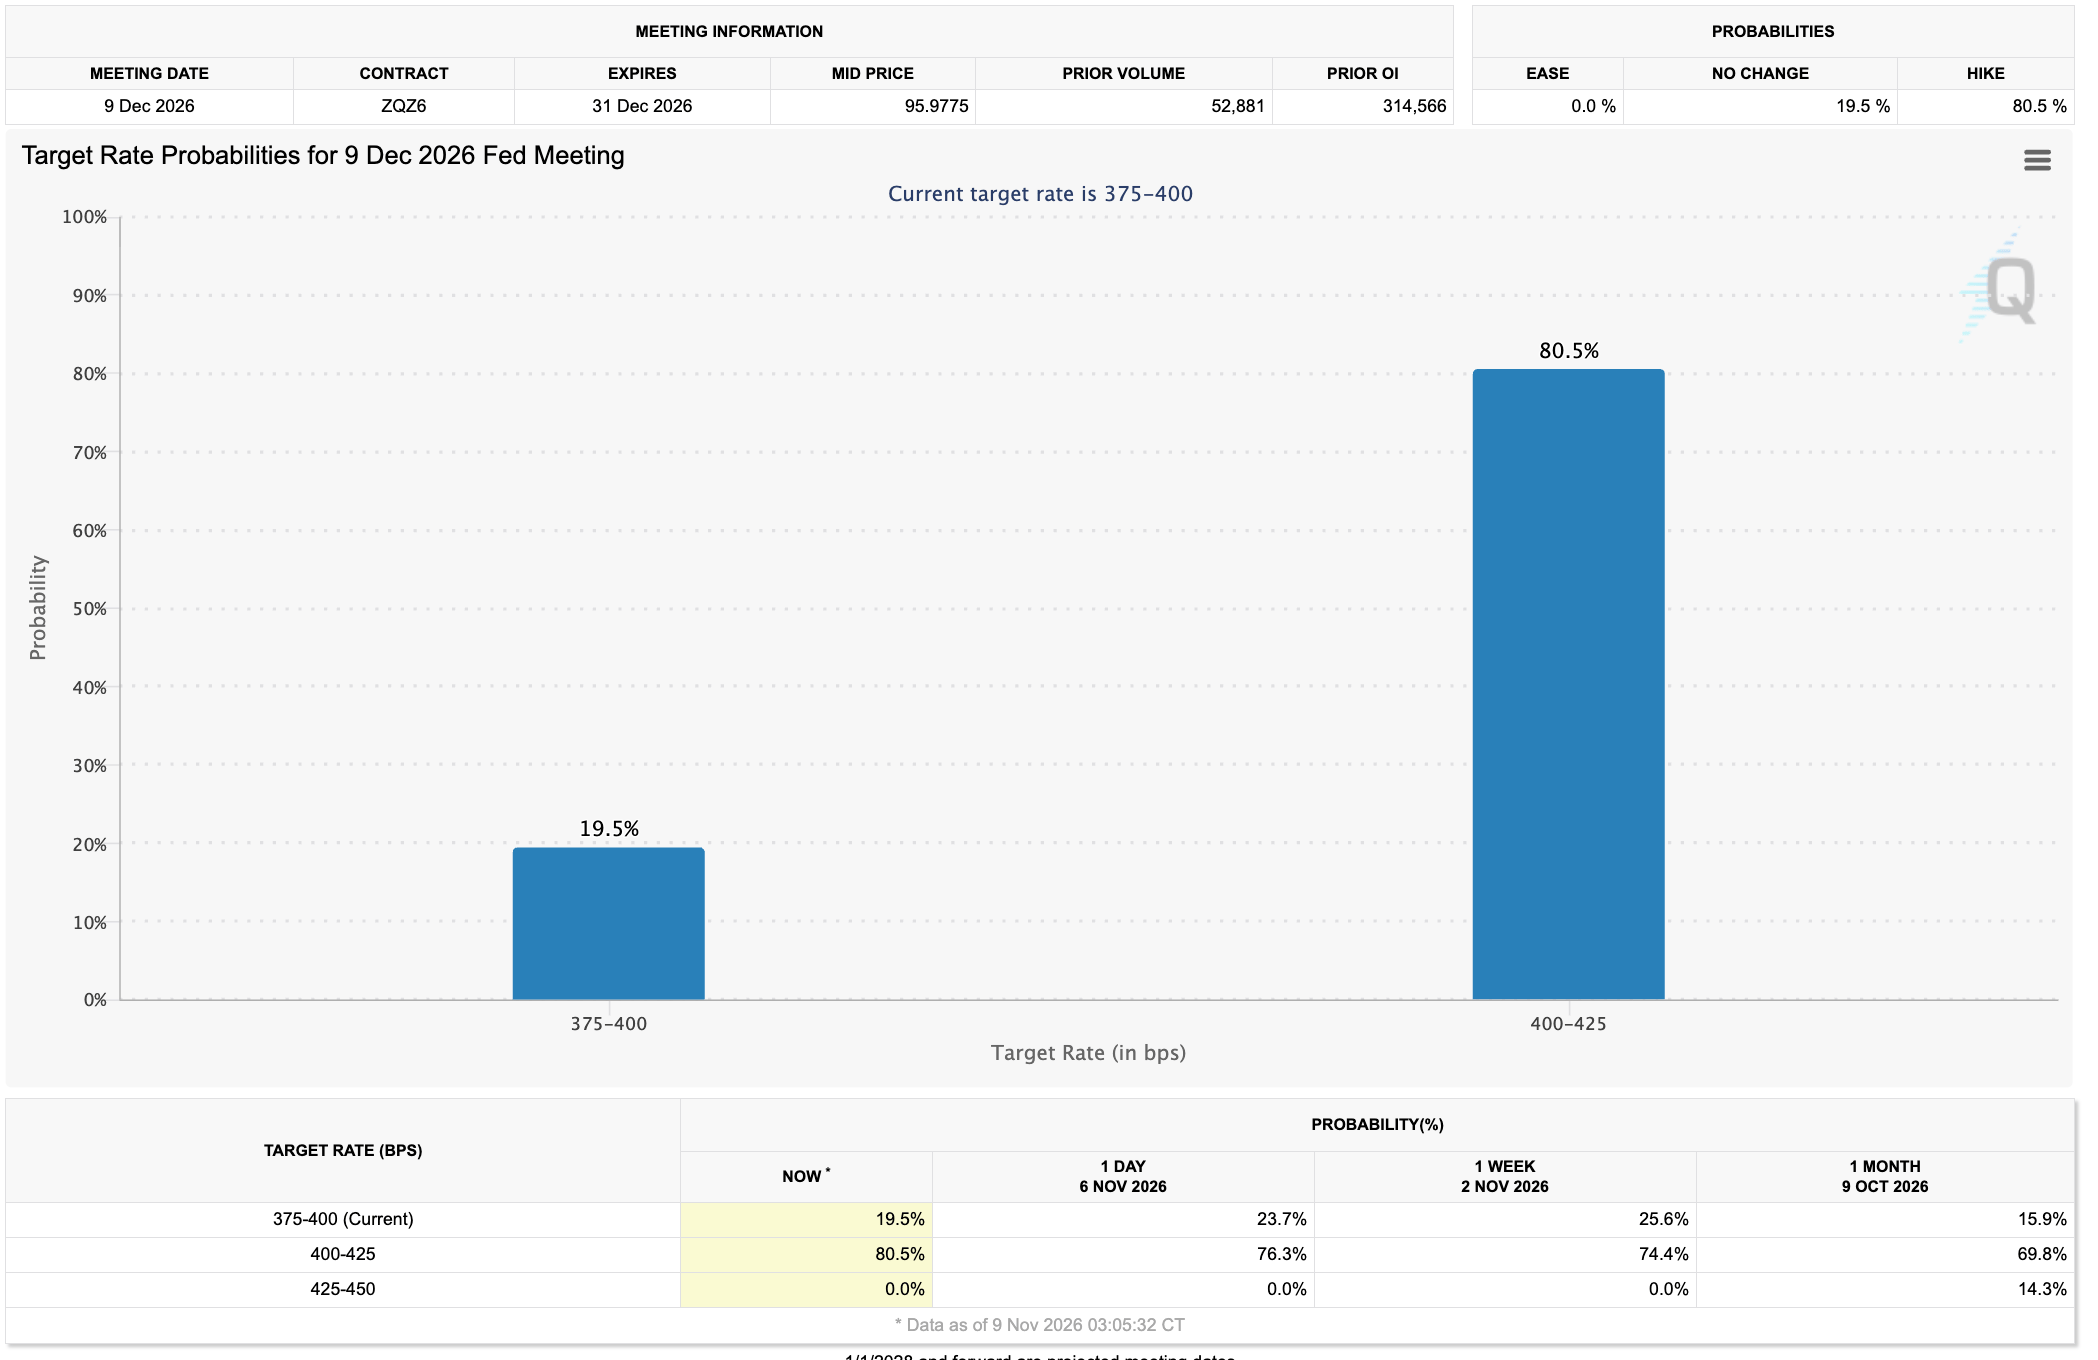
In addition to concerns about Democrats holding majorities in both the House of Representatives and the Senate, inflation remains a lingering issue. The US Federal Reserve (Fed) is expected to raise interest rates at its next meeting scheduled for December 9.
A strong labor market gives room for the Fed to tighten policy, with the October US Nonfarm Payrolls (NFP) report showing a 4.1% decline in unemployment and 165,000 jobs added, as previously reported by FXStreet. The FedWatch tool suggests an 80% market expectation that the Fed could raise rates by 25 basis points (bps), to the 400-425 bps range.
Amid the macroeconomic concerns, institutional investors are limiting their exposure to high-risk assets, such as crypto. The US Bitcoin spot Exchange Traded Funds (ETFs) recorded $1.28 billion in outflows last week, the largest since early July, while the Ethereum ETFs recorded $365.28 million in withdrawals, marking their sixth consecutive week of outflows. Similarly, the XRP-focused ETFs saw a mild outflow of $529,510 last week.
Persistent outflows from major crypto ETFs weigh on retail speculation and market sentiment, raising downside risks in the spot market.

Bitcoin technical analysis: Bearish momentum regains strength
Bitcoin trades at $74,650 at press time on Monday, extending a corrective phase below its 50-day Exponential Moving Average (EMA) at $79,292 and the 200-day EMA at $76,927.
Momentum reinforces this bearish tone, with the Relative Strength Index (RSI) slipping toward 35 and the Moving Average Convergence Divergence (MACD) holding in negative territory, hinting that sellers retain control.
On the downside, immediate support emerges at $70,505, followed by $67,292. Deeper pullbacks would expose the $62,345 level, with $60,000 and $57,800 acting as longer-term floors.
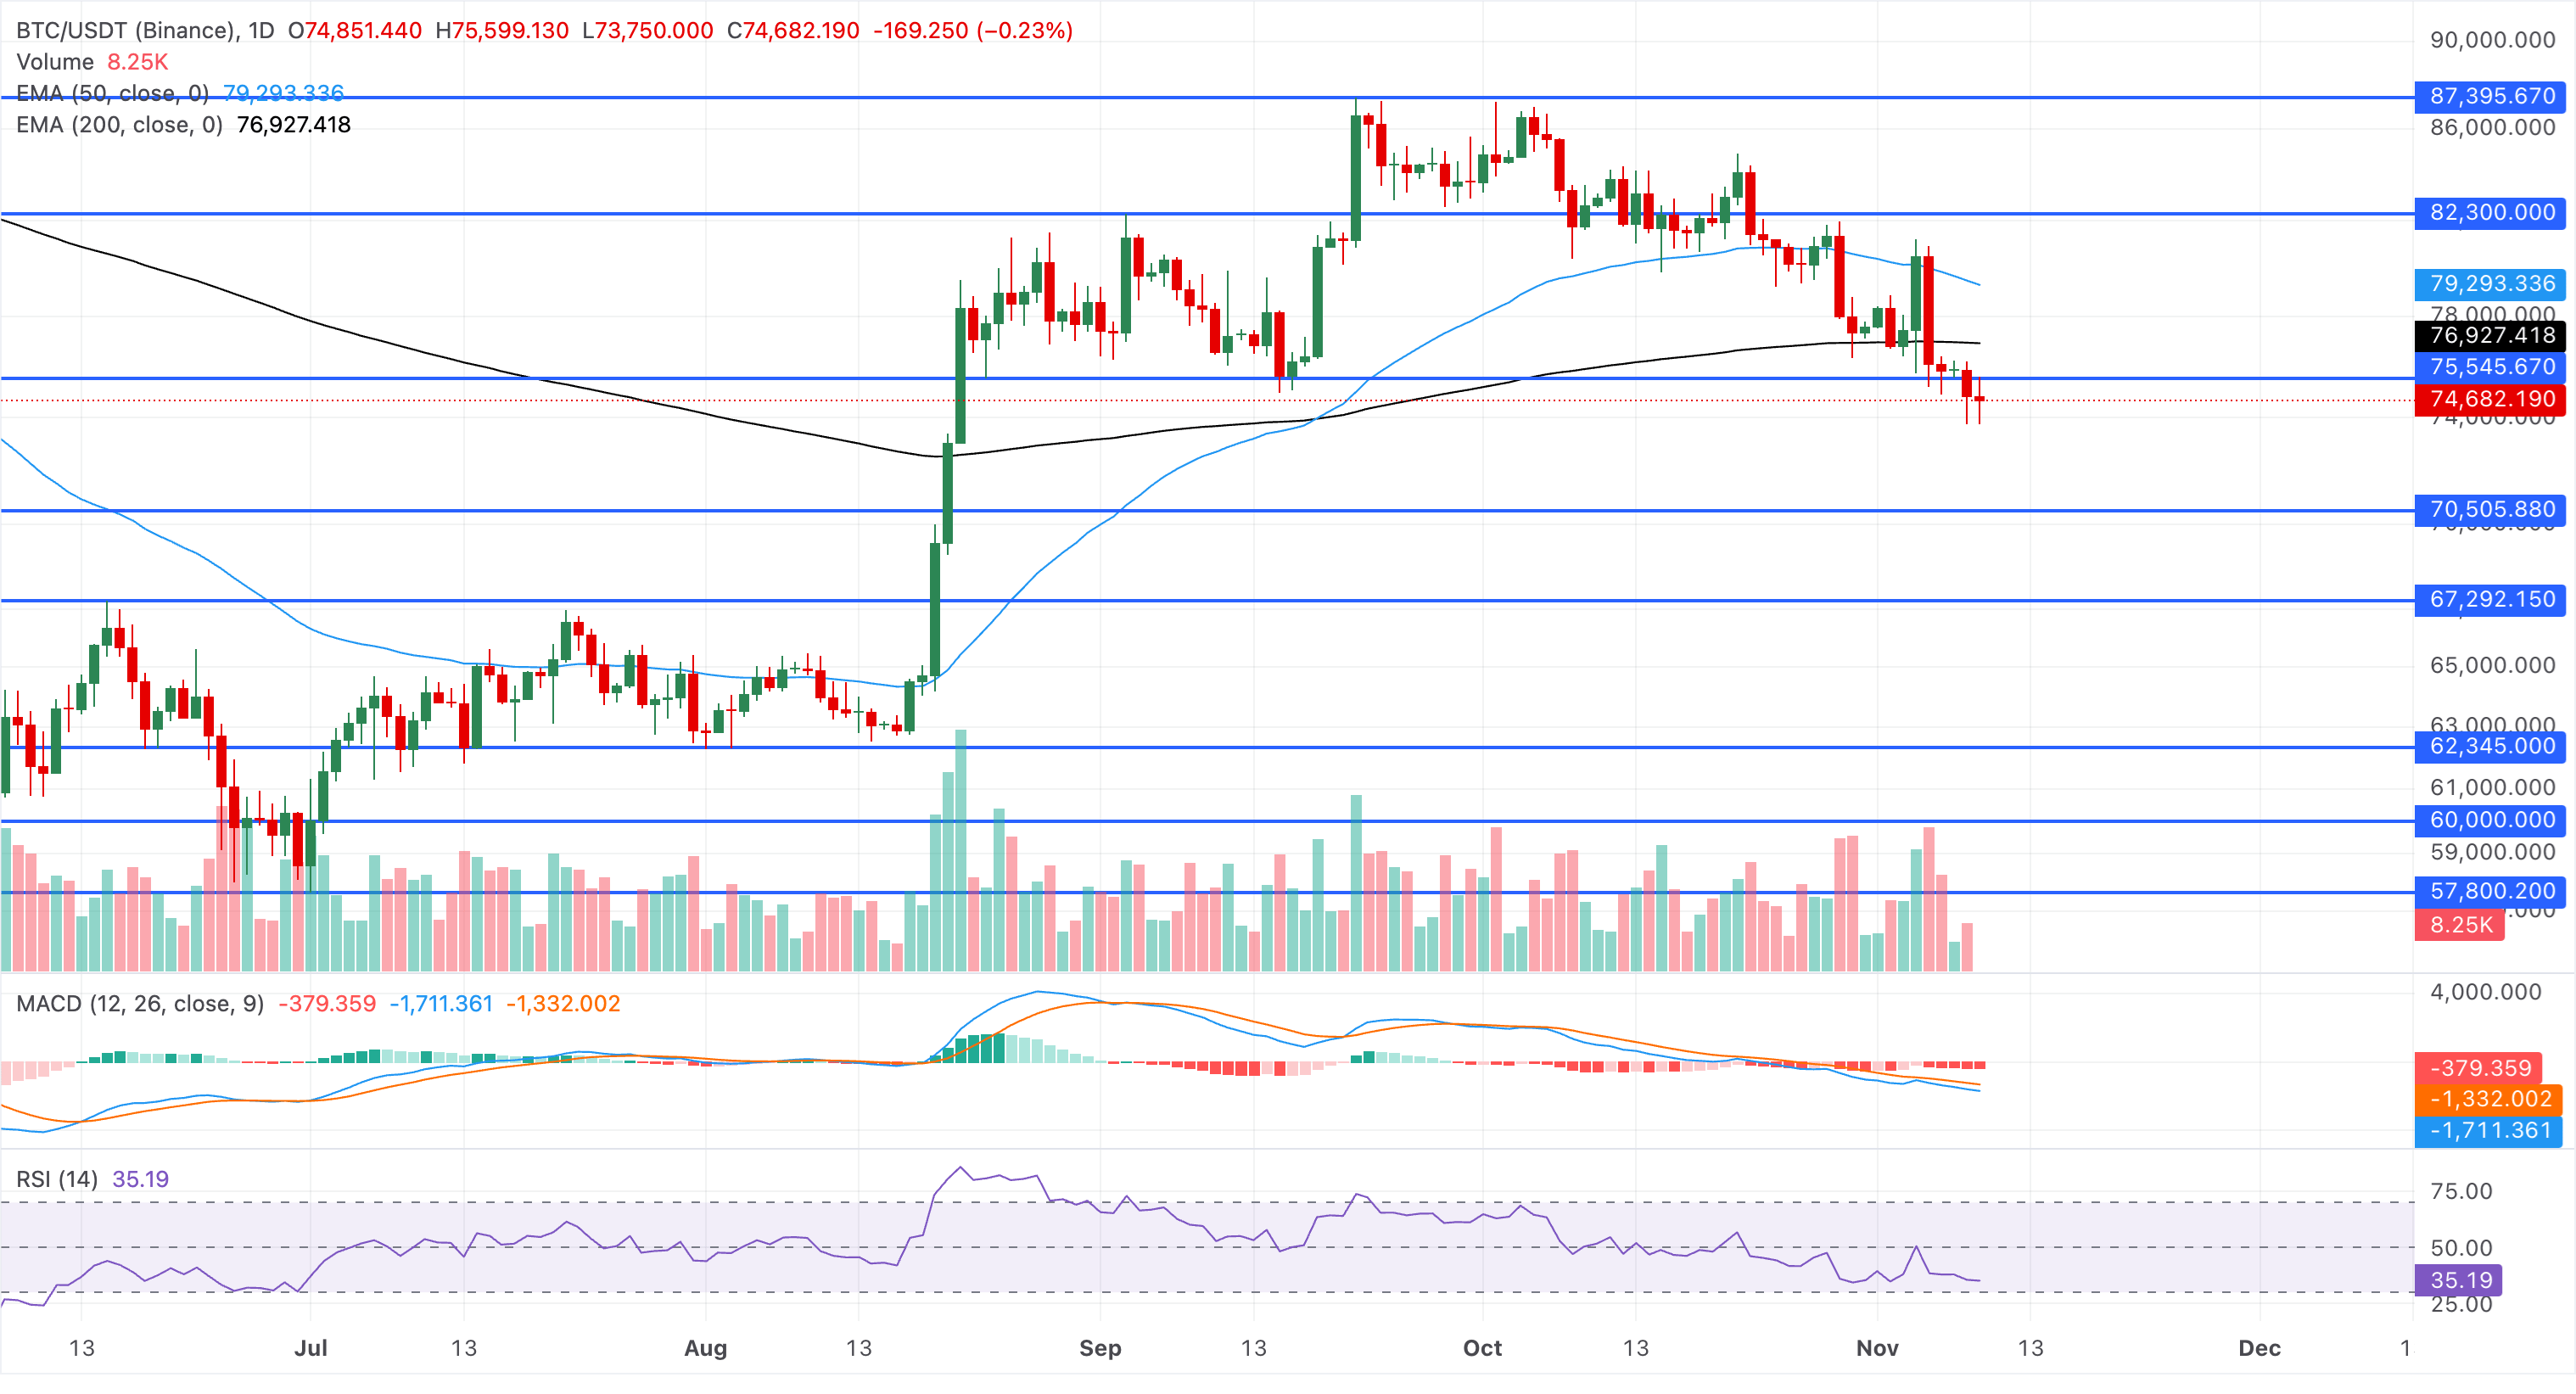
Looking up, initial resistance is seen at the horizontal barrier around $75,545, ahead of the 200-day EMA at $76,927 and the 50-day EMA at $79,292.
Technical analysis: Ethereum risks a drop below $2,000
Ethereum hovers above $2,100 so far on Monday, following a 6.50% decline last week. The price has slipped below the 200-day EMA at $2,318 and the 50-day EMA at $2,370, suggesting a capped near-term tone.
Momentum remains weak, with the RSI hovering around 32, near oversold territory, and the MACD declining deeper into negative territory, reinforcing prevailing bearish pressure.
The immediate support for ETH aligns with the $2,000 psychological threshold, reinforced by the May 28 high around $1,967.
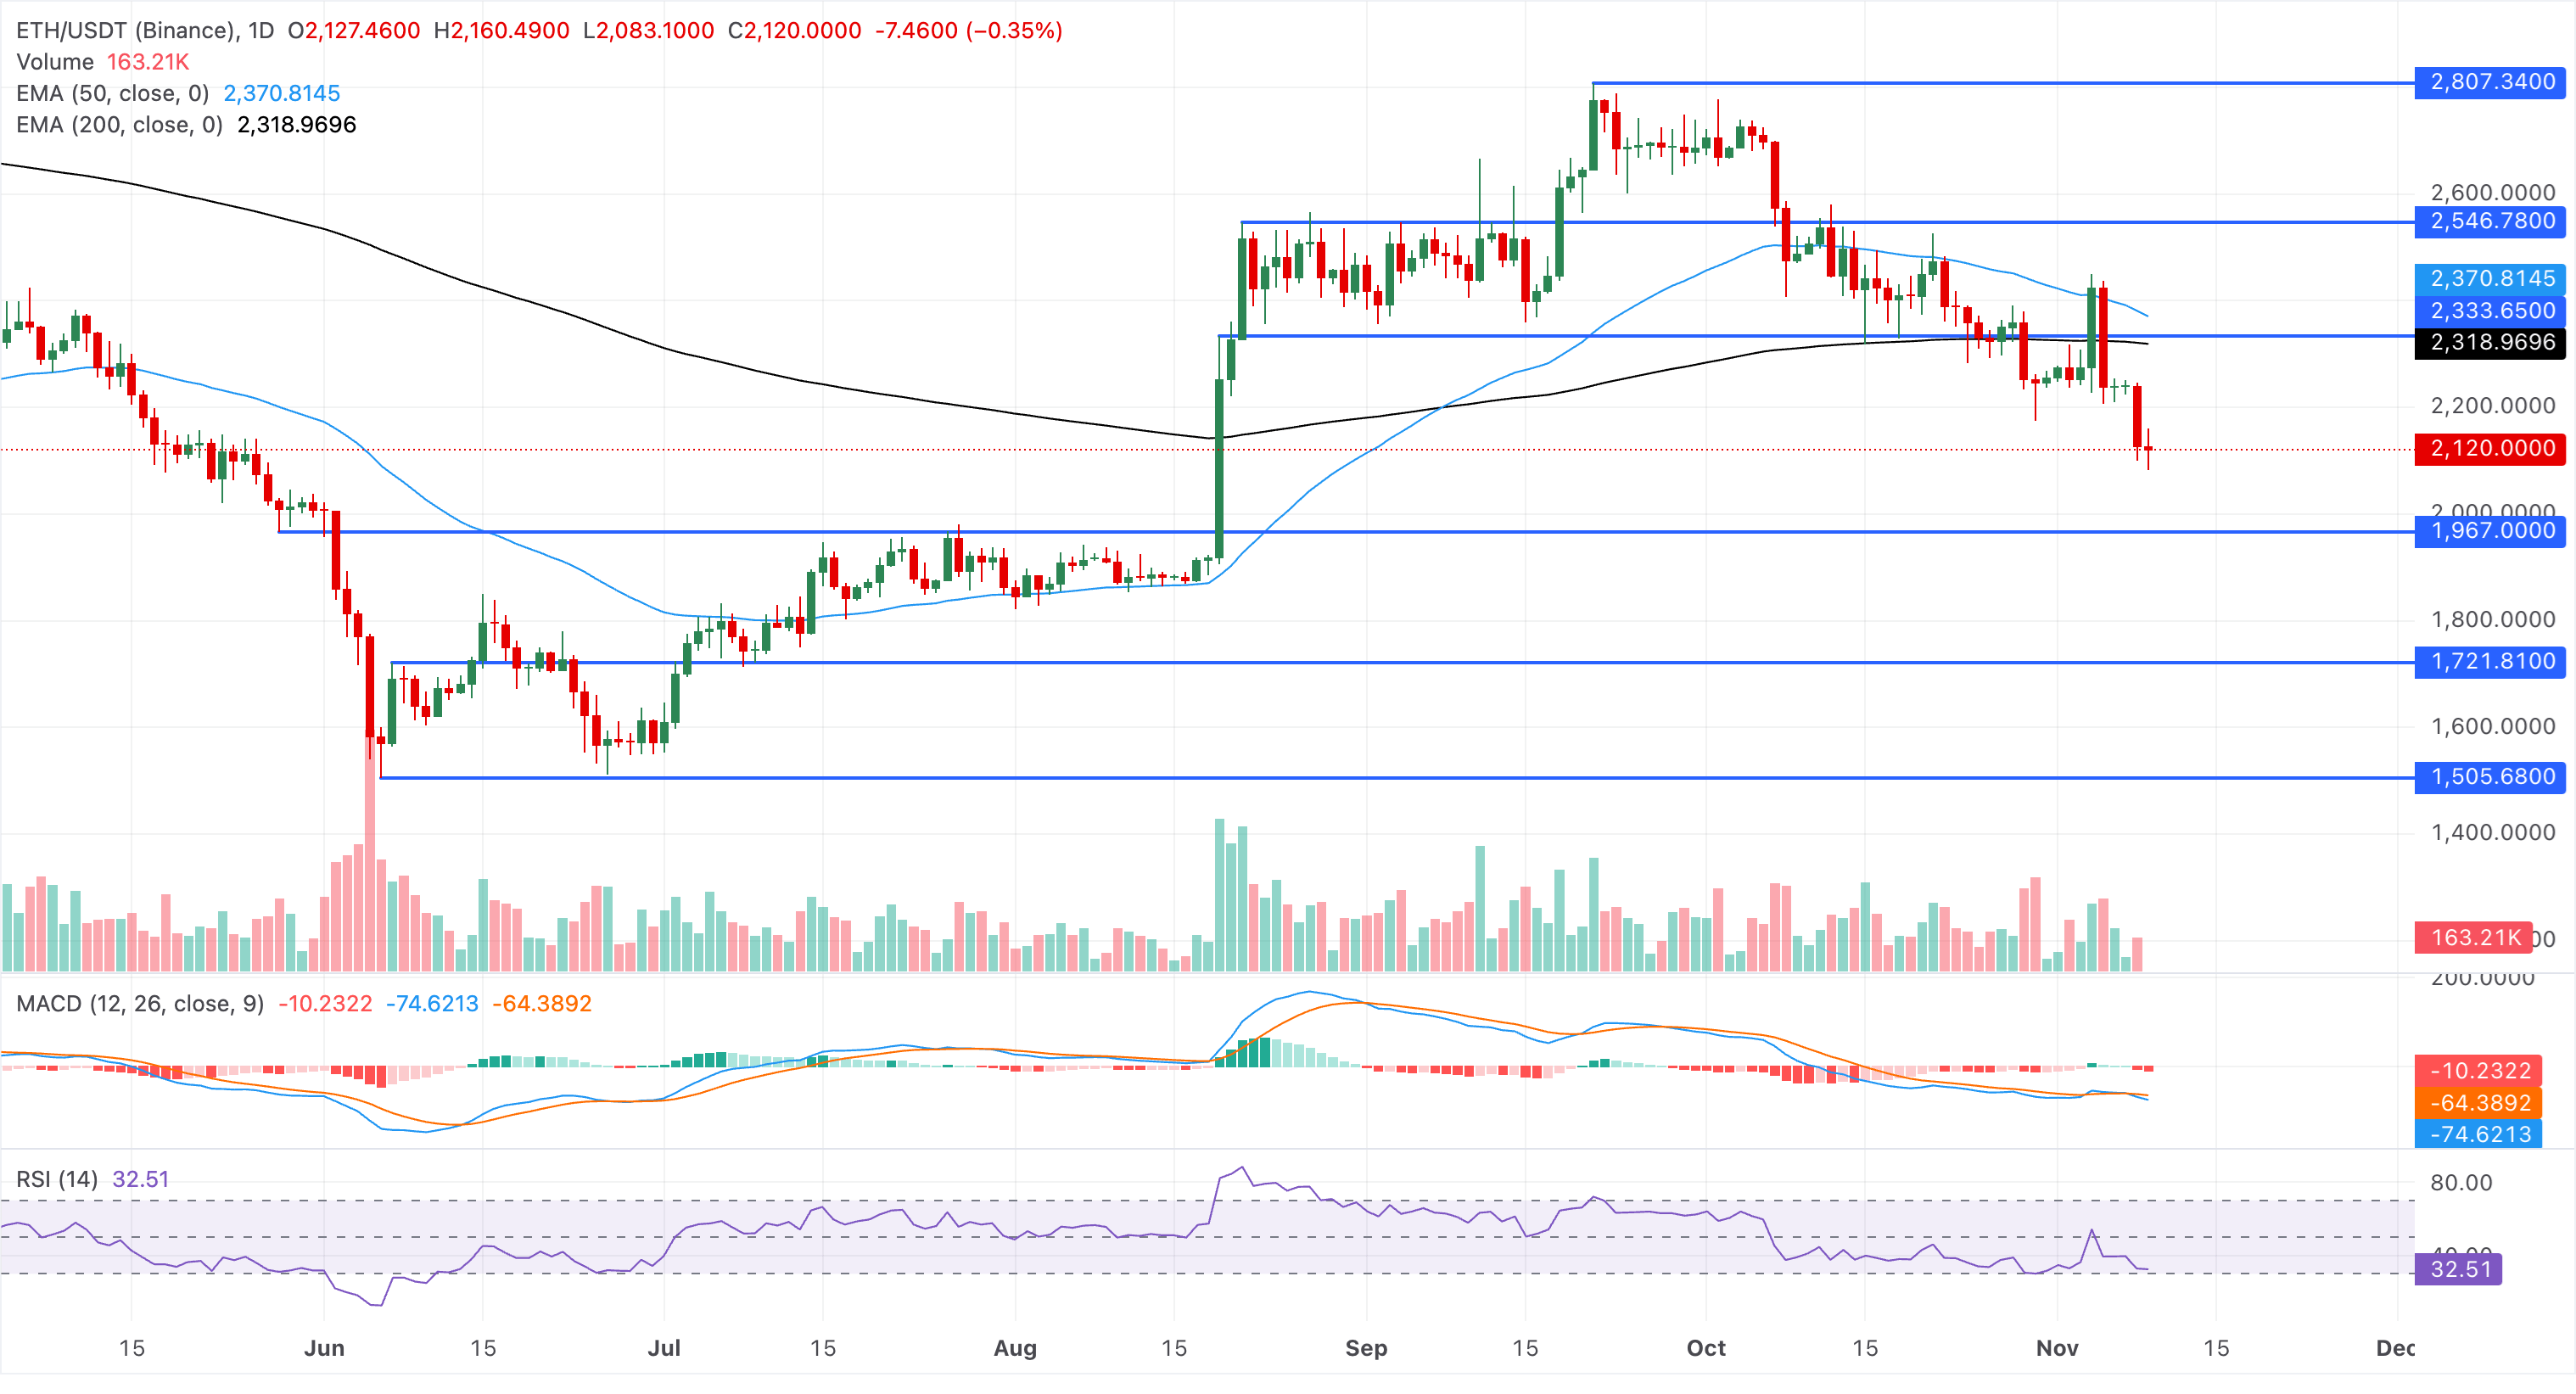
On the flip side, initial resistance is at the 200-day EMA near $2,319, where any recovery would first be tested, followed by a stronger barrier at the 50-day EMA around $2,371, which defines the broader bearish cap on the trend.
Technical analysis: XRP extends losses toward $1
Ripple trades at $1.1003 on Monday, keeping a bearish near-term tone as it holds well below both the 50-day and 200-day EMAs at $1.3025 and $1.3530, respectively. XRP declines for the fifth consecutive day, after an overhead resistance trendline near $1.3094 capped recovery last week.
The RSI is slipping into oversold territory near 26, while the MACD remains negative, hinting at lingering downside pressure.
The next notable demand area lies at the horizontal support drawn around the $1.0000 psychological threshold, where sellers could pause, allowing for an oversold bounce. However, a sustained decline could test the August 14 low at $0.9862.
On the topside, initial resistance appears at the trendline at $1.3094, followed by the 50-day EMA near $1.3025, reinforcing a broader overhead supply zone.
(The technical analysis of this story was written with the help of an AI tool. Know more.)
Artigos Recomendados


