


Pi Network Price Forecast: PI sell-off accelerates as Middle East tensions escalate
- Pi Network declines to $0.168 support amid investor reaction to tensions in the Middle East ahead of US-Iran peace talks.
- PI faces deteriorating momentum indicators, with the MACD maintaining a sell signal on the 4-hour chart.
- Pi Network's efforts to stage a recovery could remain limited, as major moving averages continue to reinforce a sustained bearish trend.
Pi Network (PI) is trading slightly above immediate support at $0.168 as of writing on Tuesday. PI’s deteriorating outlook aligns with the broader crypto market, faltering ahead of the United States (US)–Iran peace negotiations in Pakistan.
Pi Network wobbles as Trump says no to extending ceasefire with Iran
Peace negotiations between the US and Iran are expected to commence in Pakistan on Tuesday, even as the ceasefire between the two warring nations ends. US President Donald Trump told CNBC in an interview that the US has an upper hand in the peace talks and that he is not seeking to extend the ceasefire.
“I don’t want to do that. We don’t have that much time,” Trump told CNBC, adding, “I expect to be bombing ‘cause that would be a better attitude.”
Meanwhile, movement through the Strait of Hormuz remains limited following Iran’s re-closure on Saturday after US forces attacked and seized an Iranian-flagged vessel.
Oil prices are edging higher, trading at $88.36 for the West Texas Intermediate (WTI) benchmark at the time of writing. Approximately 20% of global Oil and Gas supplies passed through the Strait before the war broke out in late February.
The restricted movement of vessels continues to pressure global markets, amid the rising risk of higher inflation and slow economic growth. Moreover, volatility often limits recovery, suggesting that risk assets such as PI could remain in a broader downtrend.
Technical outlook: Pi Network holds at the cliff’s edge
PI trades around $0.168 at the time of writing on Tuesday, holding below the 50, 100 and 200 Exponential Moving Averages (EMAs), clustered between $0.172 and $0.176 on the 4-hour chart. An immediate descending trendline (dotted) also caps the upside, reinforcing the dominant bearish trend.
The Moving Average Convergence Divergence (MACD) indicator maintains a sell signal on the same chart, with a negative histogram suggesting sellers have the upper hand.
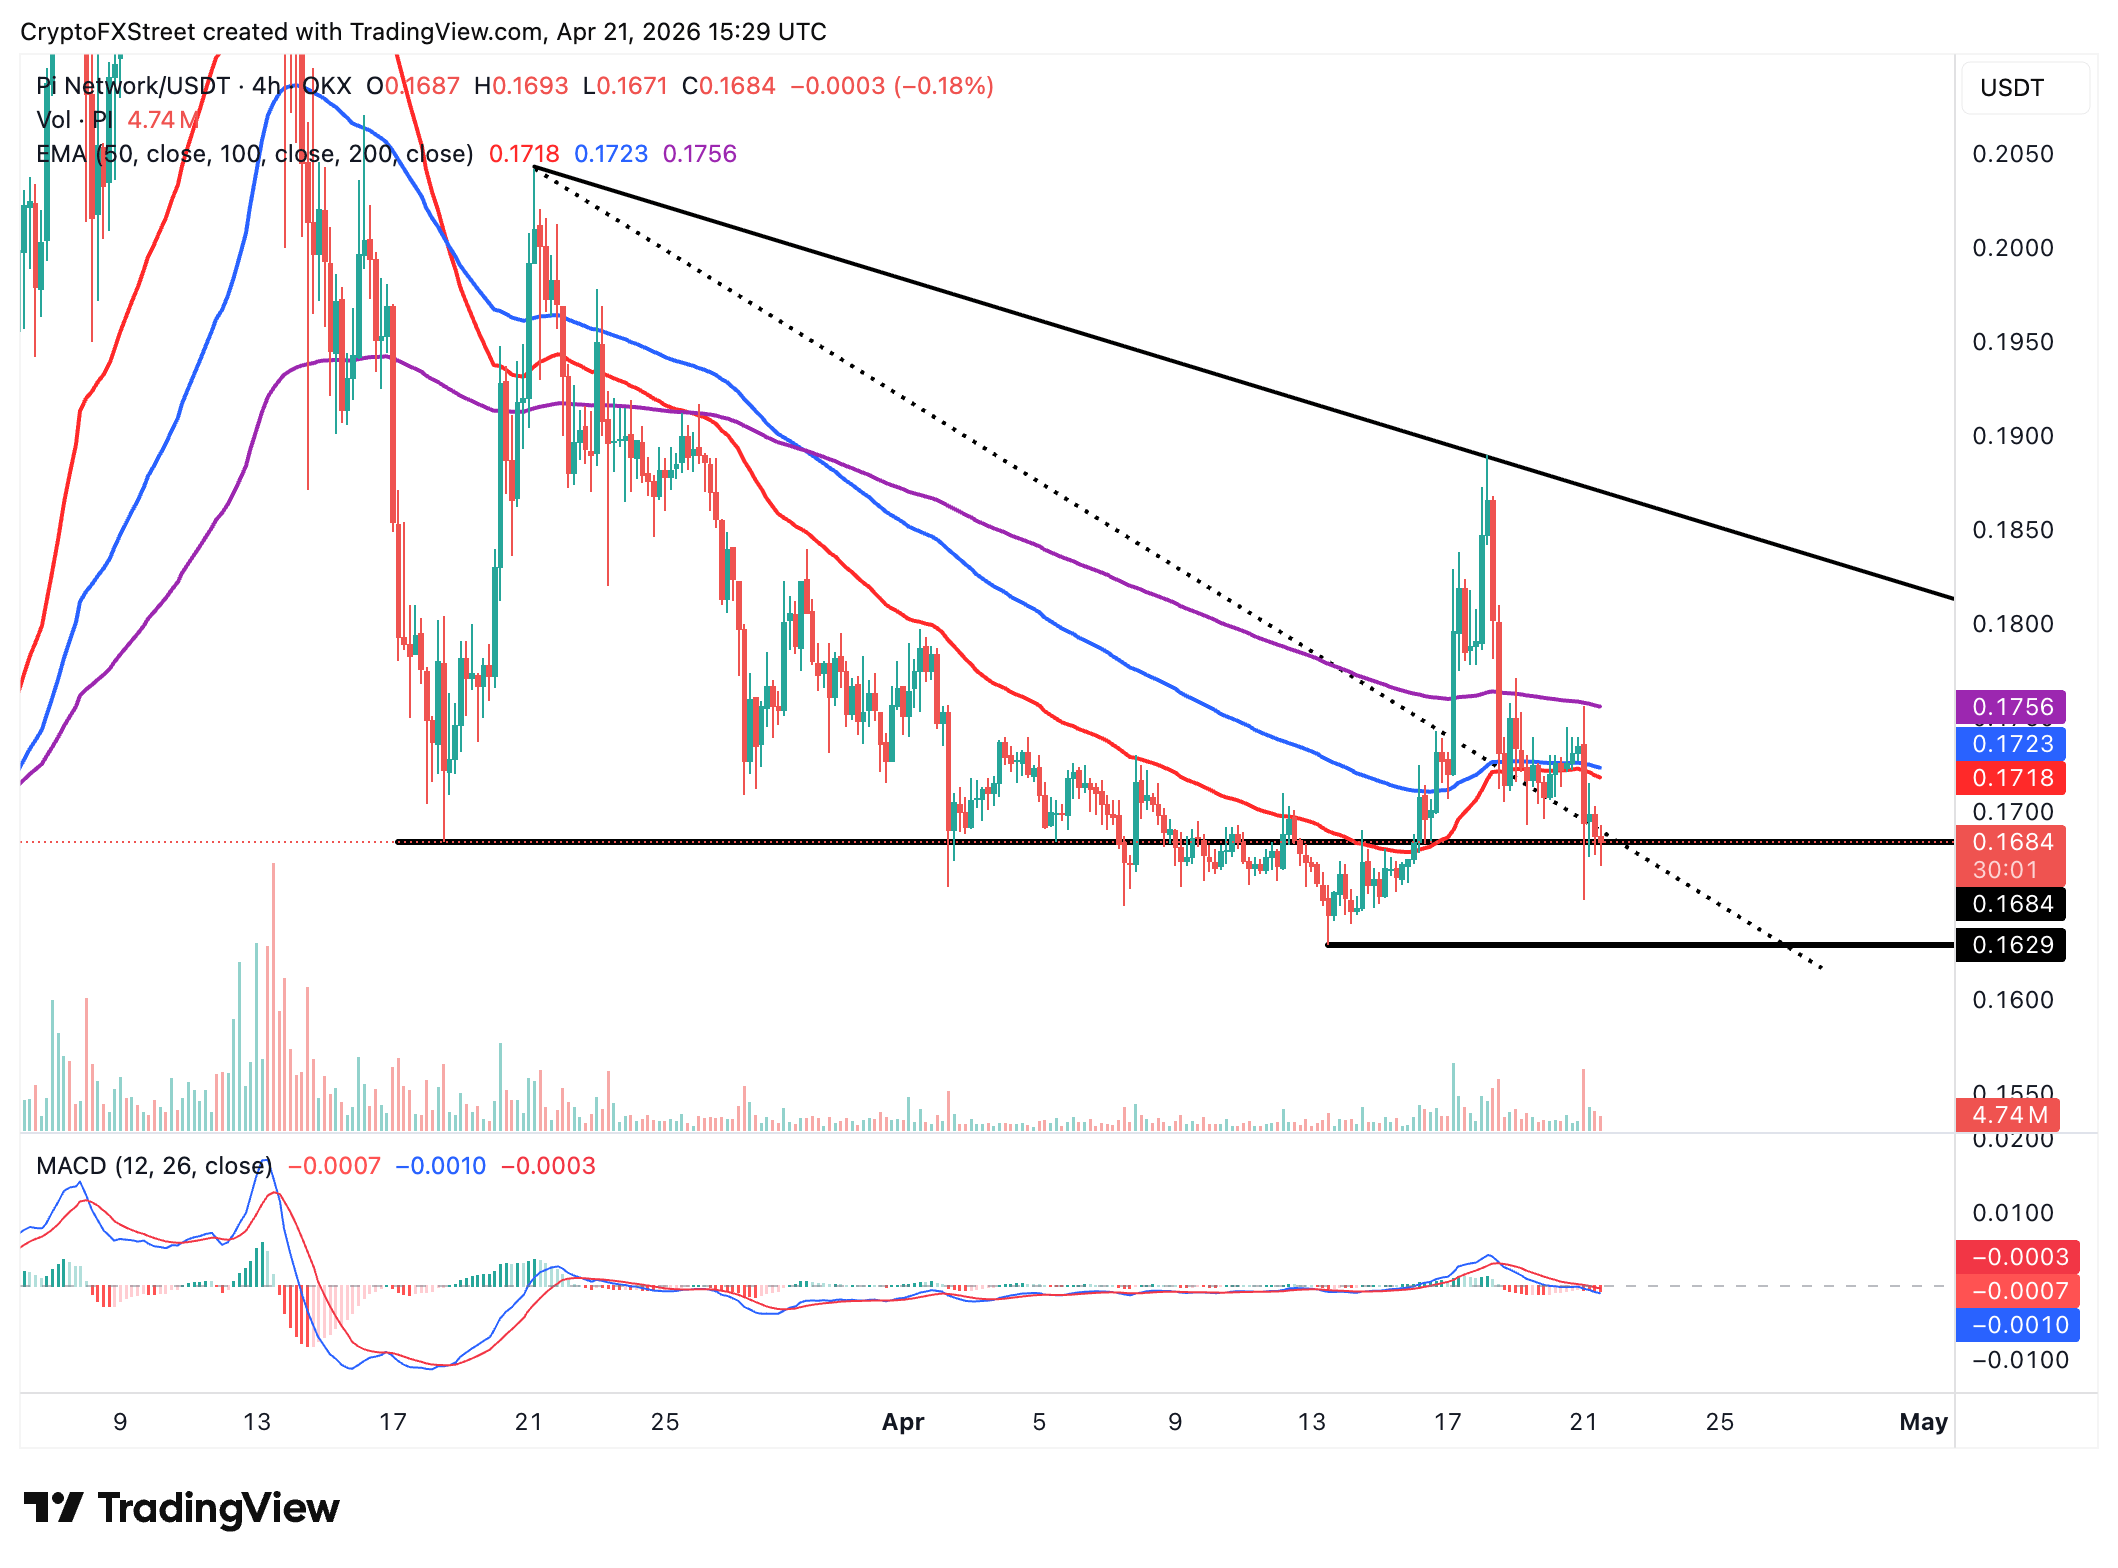
On the downside, immediate support aligns with the horizontal demand zone at $0.168, where a break below would expose the next demand area at $0.160. A reversal above the immediate descending trendline could open the door to gains targeting the 50 EMA at $0.172 and the 200 EMA at $0.176.
Cryptocurrency prices FAQs
Token launches influence demand and adoption among market participants. Listings on crypto exchanges deepen the liquidity for an asset and add new participants to an asset’s network. This is typically bullish for a digital asset.
A hack is an event in which an attacker captures a large volume of the asset from a DeFi bridge or hot wallet of an exchange or any other crypto platform via exploits, bugs or other methods. The exploiter then transfers these tokens out of the exchange platforms to ultimately sell or swap the assets for other cryptocurrencies or stablecoins. Such events often involve an en masse panic triggering a sell-off in the affected assets.
Macroeconomic events like the US Federal Reserve’s decision on interest rates influence crypto assets mainly through the direct impact they have on the US Dollar. An increase in interest rate typically negatively influences Bitcoin and altcoin prices, and vice versa. If the US Dollar index declines, risk assets and associated leverage for trading gets cheaper, in turn driving crypto prices higher.
Halvings are typically considered bullish events as they slash the block reward in half for miners, constricting the supply of the asset. At consistent demand if the supply reduces, the asset’s price climbs.
Artigos Recomendados


