

Cosmos Hub Price Forecast: ATOM under pressure as bearish momentum accelerates

Fonte Fxstreet
  • Cosmos Hub price hovers at $1.82 on Monday after falling over 20% in the previous week.
  • On-chain and derivatives data paint a bearish outlook, as ATOM’s TVL is falling alongside negative funding rates.
  • The technical outlook suggests further downside, as momentum indicators show bearish strength gaining traction.

Cosmos Hub (ATOM) steadies near $1.82 at the time of writing on Monday, following a 20% decline the previous week. Weakening on-chain and derivatives data support a bearish outlook, while technical analysis remains unfavorable. In addition, risk-off sentiment persists, as the escalating military aggression in the Middle East over the weekend continues to weigh on the crypto market.

On-chain and derivatives data show bearish bias

DefiLlama data shows that Cosmos Hub’s Total Value Locked (TVL) drops to $138,370 on Monday, and has been steadily declining since mid-January. Falling TVL signals weakening activity and waning user engagement in ATOM’s ecosystem, implying that fewer participants are depositing or interacting with ATOM-based protocols, which doesn’t bode well for its price.
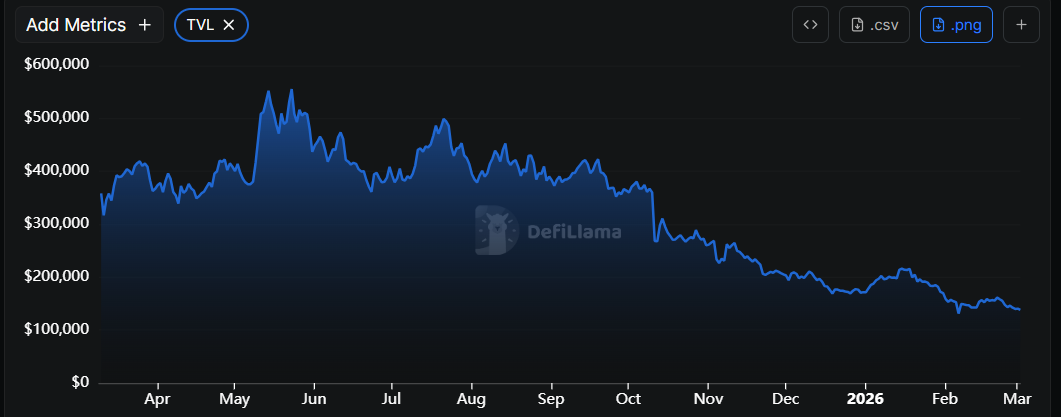
ATOM TVL chart. Source: DefiLlama

Derivatives data for Cosmos Hub also support a bearish outlook. Coinglass’s OI-Weighted Funding Rate data shows that the number of traders betting that the price of ATOM will slide further is higher than those anticipating a price increase. The metric flipped to a negative rate on Thursday and stands at -0.127% on Monday, indicating shorts are paying longs and suggesting bearish sentiment toward ATOM.
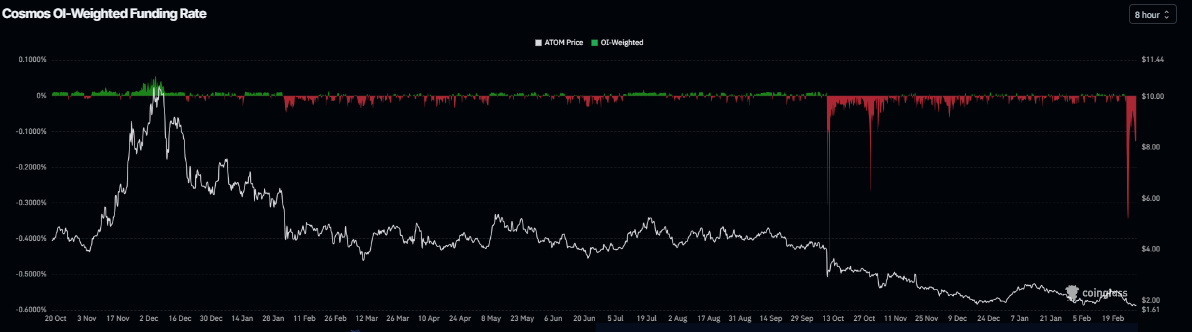
Cosmos Hub funding rates chart. Source: Coinglass

Cosmos Hub Price Forecast: Bears in control of the momentum

Cosmos Hub is trading at $1.82 as of Monday. The near-term bias stays mildly bearish, as price holds below the 50- and 100-day Exponential Moving Averages (EMAs), which continue to trend lower and cap recovery attempts. ATOM also trades under the 23.6% Fibonacci retracement at $1.90, measured from $2.69 (January 14 high) to $1.65 (February 6 low), underscoring a failed attempt to sustain above this initial corrective resistance on Sunday. 

Momentum remains weak, with the Relative Strength Index (RSI) on the daily chart at 36, indicating subdued buying interest, and the Moving Average Convergence Divergence (MACD) declining below its signal line and the zero mark, signaling persistent downside pressure.

Immediate resistance at $1.83 is reinforced by the abovementioned 23.6% Fibonacci retracement at $1.90, and a daily close above this band would be needed to ease selling pressure and open the way toward the 38.2% Fibonacci retracement at $2.05 and the 50-day EMA near $2.12. 

On the downside, the $1.80 area acts as the first line of support ahead of the recent $1.65 swing low, where previous demand emerged. 

A break below $1.65 would extend the dominant downtrend and expose lower levels, while only a sustained move back above $2.05 would start to neutralize the current bearish tone.

Chart Analysis ATOM/USDT (Binance)

(The technical analysis of this story was written with the help of an AI tool.)

Isenção de responsabilidade: Apenas para fins informativos. O desempenho passado não é indicativo de resultados futuros.
placeholder
Fundos HGFF11 e BPFF11 saem da bolsa para serem incorporados pelo RVBI11 do PátriaOs fundos imobiliários Hedge TOP FOFII 3 (HGFF11) e Banrisul Pátria Pactual (BPFF11) deixarão de ser negociados no mercado secundário da B3 após o encerramento do pregão da próxima segunda-feira, 18 de agosto.
Autor  Pedro Augusto Prazeres
14 ago. 2025
Os fundos imobiliários Hedge TOP FOFII 3 (HGFF11) e Banrisul Pátria Pactual (BPFF11) deixarão de ser negociados no mercado secundário da B3 após o encerramento do pregão da próxima segunda-feira, 18 de agosto.
placeholder
Ouro cai abaixo de US$ 4.400; suporte em US$ 4.360 pode definir reação do XAU/USDO ouro caiu abaixo de US$ 4.400 após três sessões de forte queda, mas a aproximação do suporte-chave em US$ 4.360 pode abrir espaço para uma recuperação técnica no curto prazo.
Autor  TradingKey
5 Mês 28 Dia Qui
O ouro caiu abaixo de US$ 4.400 após três sessões de forte queda, mas a aproximação do suporte-chave em US$ 4.360 pode abrir espaço para uma recuperação técnica no curto prazo.
placeholder
Vitalik Buterin relaciona o DeepSeek V4 ao futuro da privacidade do EthereumVitalik Buterin relacionou o DeepSeek V4 ao futuro da privacidade do Ethereum, delineando um roteiro que integra modelos de IA locais à camada de acesso do Ethereum.
Autor  Cryptopolitan
Ontem 01: 27
Vitalik Buterin relacionou o DeepSeek V4 ao futuro da privacidade do Ethereum, delineando um roteiro que integra modelos de IA locais à camada de acesso do Ethereum.
placeholder
O ETF Bitcoin da BlackRock registra uma saída de US$ 527 milhões, ficando muito perto de seu pior dia da históriaOs ETFs Bitcoin Spot registraram oito dias consecutivos de saídas líquidas acumuladas. Até o momento, este mês teve apenas seis dias de entrada positiva, com o total de saídas mensais chegando a -US$ 2,07 bilhões no momento da redação deste texto. Os números não são pequenos. Dados da SoSoValue mostram que o iShares Bitcoin Trust da BlackRock teve uma saída de -US$ 527,84 milhões...
Autor  Cryptopolitan
Ontem 01: 35
Os ETFs Bitcoin Spot registraram oito dias consecutivos de saídas líquidas acumuladas. Até o momento, este mês teve apenas seis dias de entrada positiva, com o total de saídas mensais chegando a -US$ 2,07 bilhões no momento da redação deste texto. Os números não são pequenos. Dados da SoSoValue mostram que o iShares Bitcoin Trust da BlackRock teve uma saída de -US$ 527,84 milhões...
placeholder
O ouro interrompe sua recuperação, já que os sólidos dados de inflação dos EUA reforçam as apostas em um aumento das taxas pelo Fed em meio à incerteza em relação ao IrãO ouro (XAU/USD) tem dificuldade em aproveitar a sólida recuperação do dia anterior, que partiu da faixa de US$ 4.367 a US$ 4.366 — seu nível mais baixo desde 27 de março —, e oscila em uma faixa estreita durante o pregão asiático desta sexta-feira.
Autor  FXStreet
21 horas atrás
O ouro (XAU/USD) tem dificuldade em aproveitar a sólida recuperação do dia anterior, que partiu da faixa de US$ 4.367 a US$ 4.366 — seu nível mais baixo desde 27 de março —, e oscila em uma faixa estreita durante o pregão asiático desta sexta-feira.
Produtos relacionados
goTop
quote