


Bitcoin price confronts key barrier: What next as BTC transaction fees dwindle?
- Bitcoin price has nicked $66,000, but transaction fees have dropped after peaking at $128 on April 20 halving hype.
- BTC strength at around $60,000 continues to protect the range low of the re-accumulation range around $59,195.
- Swiss Bitcoiners call for National Bank to buy BTC for its national reserves for independence from the European Central Bank.
Bitcoin (BTC) price is on the balance amid dwindling transaction fees. Just two days ago, this metric was sky high but has drop by double-digit percentages which is likely to influence price.
Also Read: Top 3 Price Prediction Bitcoin, Ethereum, Ripple: Altcoins come ashore after BTC halving arrival
Daily Market Mover: Markets record falling Bitcoin transaction fees
Bitcoin price continues to show strength, but not enough to draw in the late bulls, at least for now. The pioneer crypto continues to enjoy the limelight following the successful completion of the halving. Now, data shows that BTC transaction fees are dwindling, which could have a bearing on Bitcoin price.
After peaking on the halving day at $128.45, the BTC Average Transaction Fee has nosedived to $34.86 (293.2 sats/vB), representing a drop of 72.8% in under 48 hours. The metric measures the average fee in USD when a Bitcoin transaction is processed by a miner and confirmed. Average Bitcoin transaction fees can spike during periods of congestion on the network, like it did on the halving day.
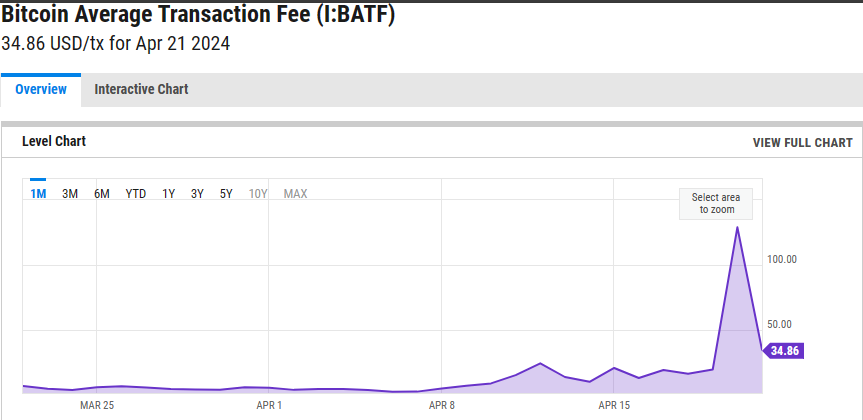
BTC average transaction fees
A drop in BTC transaction fees has the following implications:
- It could mean increased adoption (and therefore price) as lower transaction fees entice more users to transact on the network and enjoy its cost-effectiveness in sending and receiving funds.
- Better user experience and accessibility, especially for smaller transactions.
- Lower fees compared to other cryptocurrencies could attract investors looking for a cost-effective option for transferring value, potentially leading to increased investment and price.
- Miners may prioritize transactions with higher fees for better revenue.
Meanwhile, some traders and analysts are anticipating a drop in Bitcoin price, with some putting bets as low as $sub-60,000. If the price goes the other way, possibly even clearing the $73,777 all-time high to record a new peak price, it would see up to $7.24 billion in short positions liquidated, according to @Ashcryptoreal.
LIQUIDATION ALERT
— Ash Crypto (@Ashcryptoreal) April 22, 2024
$7,240,000,000 WORTH OF SHORTS WILL GET LIQUIDATED IF BTC HITS A NEW ATH pic.twitter.com/3VOytxJZnZ
Nevertheless, the bulls are showing strength near $60,000, which protects the range low of the re-accumulation range at $59,195. With this, @rektcapital says BTC may remain range-bound for the next few weeks.
#BTC
— Rekt Capital (@rektcapital) April 22, 2024
Bitcoin has managed to protect the Range Low of the Re-Accumulation Range
Because of Bitcoin's strength at the ~$60000 Range Low...
It's getting increasingly likely that Bitcoin has established its main range for the coming several weeks$BTC #Bitcoin #BitcoinHalving pic.twitter.com/9pLnWkqZQr
Elsewhere, reports indicate that Swiss Bitcoiners plan to push for the country’s National Bank to buy BTC for its national reserves, saying it would make Switzerland independent from the European Central Bank.
"Switzerland would mark its independence from ECB" : love it!
— Daniel Batten (@DSBatten) April 22, 2024
BTC technical analysis: Bitcoin price is at an inflection point
Bitcoin price is confronting resistance due to the midline of the market range, the 50% Fibonacci placeholder of $66,486. This level is critical as it determines the next directional bias for the king of crypto.
However, technical indicators show the upside potential remains capped below $66,500, with the Relative Strength Index (RSI) barely holding above the 50 mean level. The momentum indicator remains subdued, worsened by the position of both the Moving Average Convergence Divergence (MACD) and the Awesome Oscillator (AO) still in negative territory.
Bitcoin price is likely to suffer a rejection to $62,500, or lower, going as far as the $60,000 threshold. In a dire case, it could dip below this level for a sweep of the March 5 sell-side liquidity around $59,005.
The volume indicator is also showing reducing BTC/USDT pair volume, showing growing selling pressure. This means supply for the pair is high, providing traders with a price level to short or exit their trades. BTC could, therefore, record a market reversal ascribed to a weak trend.
The Average True Range (ATR) indicator is low, indicating that the market is relatively stable, and traders may want to avoid entering trades at that time. As a side note, a high ATR shows that there is a lot of volatility in the market, which can present opportunities for traders to profit.
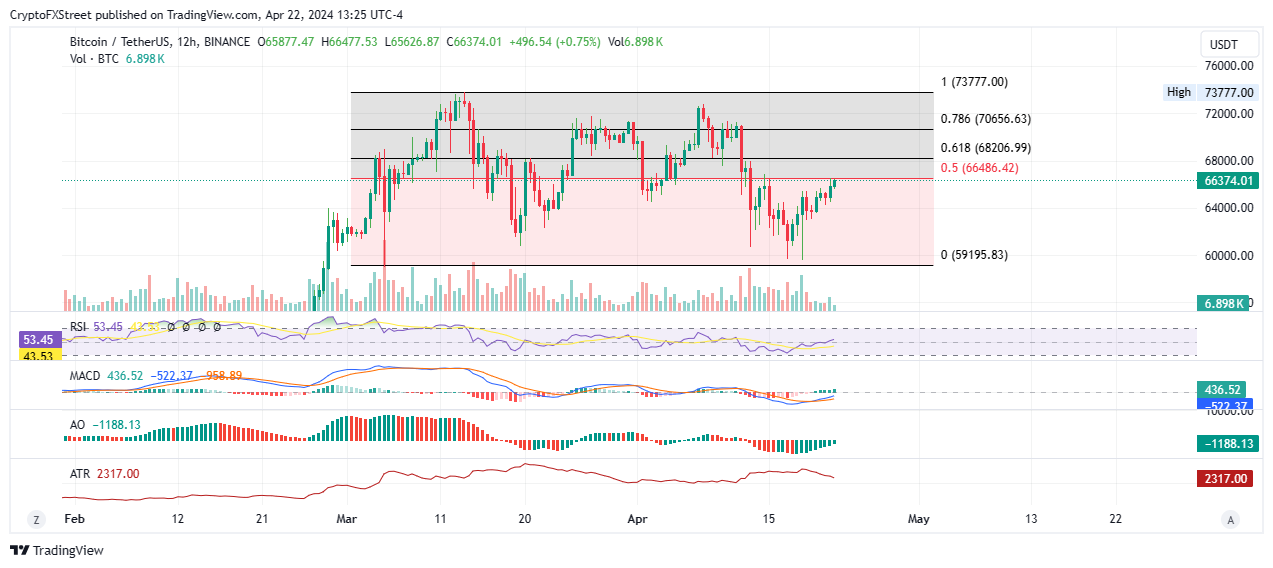
BTC/USDT 12-hour chart
Nevertheless, if the bulls can manage a decisive candlestick close above the $66,486 blockade, confirmed by a flip of the most important Fibonacci retracement level of 61.8% into support at $68,206, it would confirm the continuation of the uptrend.
The next key level to watch would be the 78.6% Fibonacci retracement level of $70,656. A strong move above this level could send BTC to a new all-time high above $73,777.
Cryptocurrency prices FAQs
Token launches like Arbitrum’s ARB airdrop and Optimism OP influence demand and adoption among market participants. Listings on crypto exchanges deepen the liquidity for an asset and add new participants to an asset’s network. This is typically bullish for a digital asset.
A hack is an event in which an attacker captures a large volume of the asset from a DeFi bridge or hot wallet of an exchange or any other crypto platform via exploits, bugs or other methods. The exploiter then transfers these tokens out of the exchange platforms to ultimately sell or swap the assets for other cryptocurrencies or stablecoins. Such events often involve an en masse panic triggering a sell-off in the affected assets.
Macroeconomic events like the US Federal Reserve’s decision on interest rates influence risk assets like Bitcoin, mainly through the direct impact they have on the US Dollar. An increase in interest rate typically negatively influences Bitcoin and altcoin prices, and vice versa. If the US Dollar index declines, risk assets and associated leverage for trading gets cheaper, in turn driving crypto prices higher.
Halvings are typically considered bullish events as they slash the block reward in half for miners, constricting the supply of the asset. At consistent demand if the supply reduces, the asset’s price climbs. This has been observed in Bitcoin and Litecoin.
Artigos Recomendados


