Fartcoin recovery gains traction on steady confidence of whales

Fonte Fxstreet
  • Fartcoin extends its recovery for the third consecutive day, posting 12% gains by press time on Thursday. 
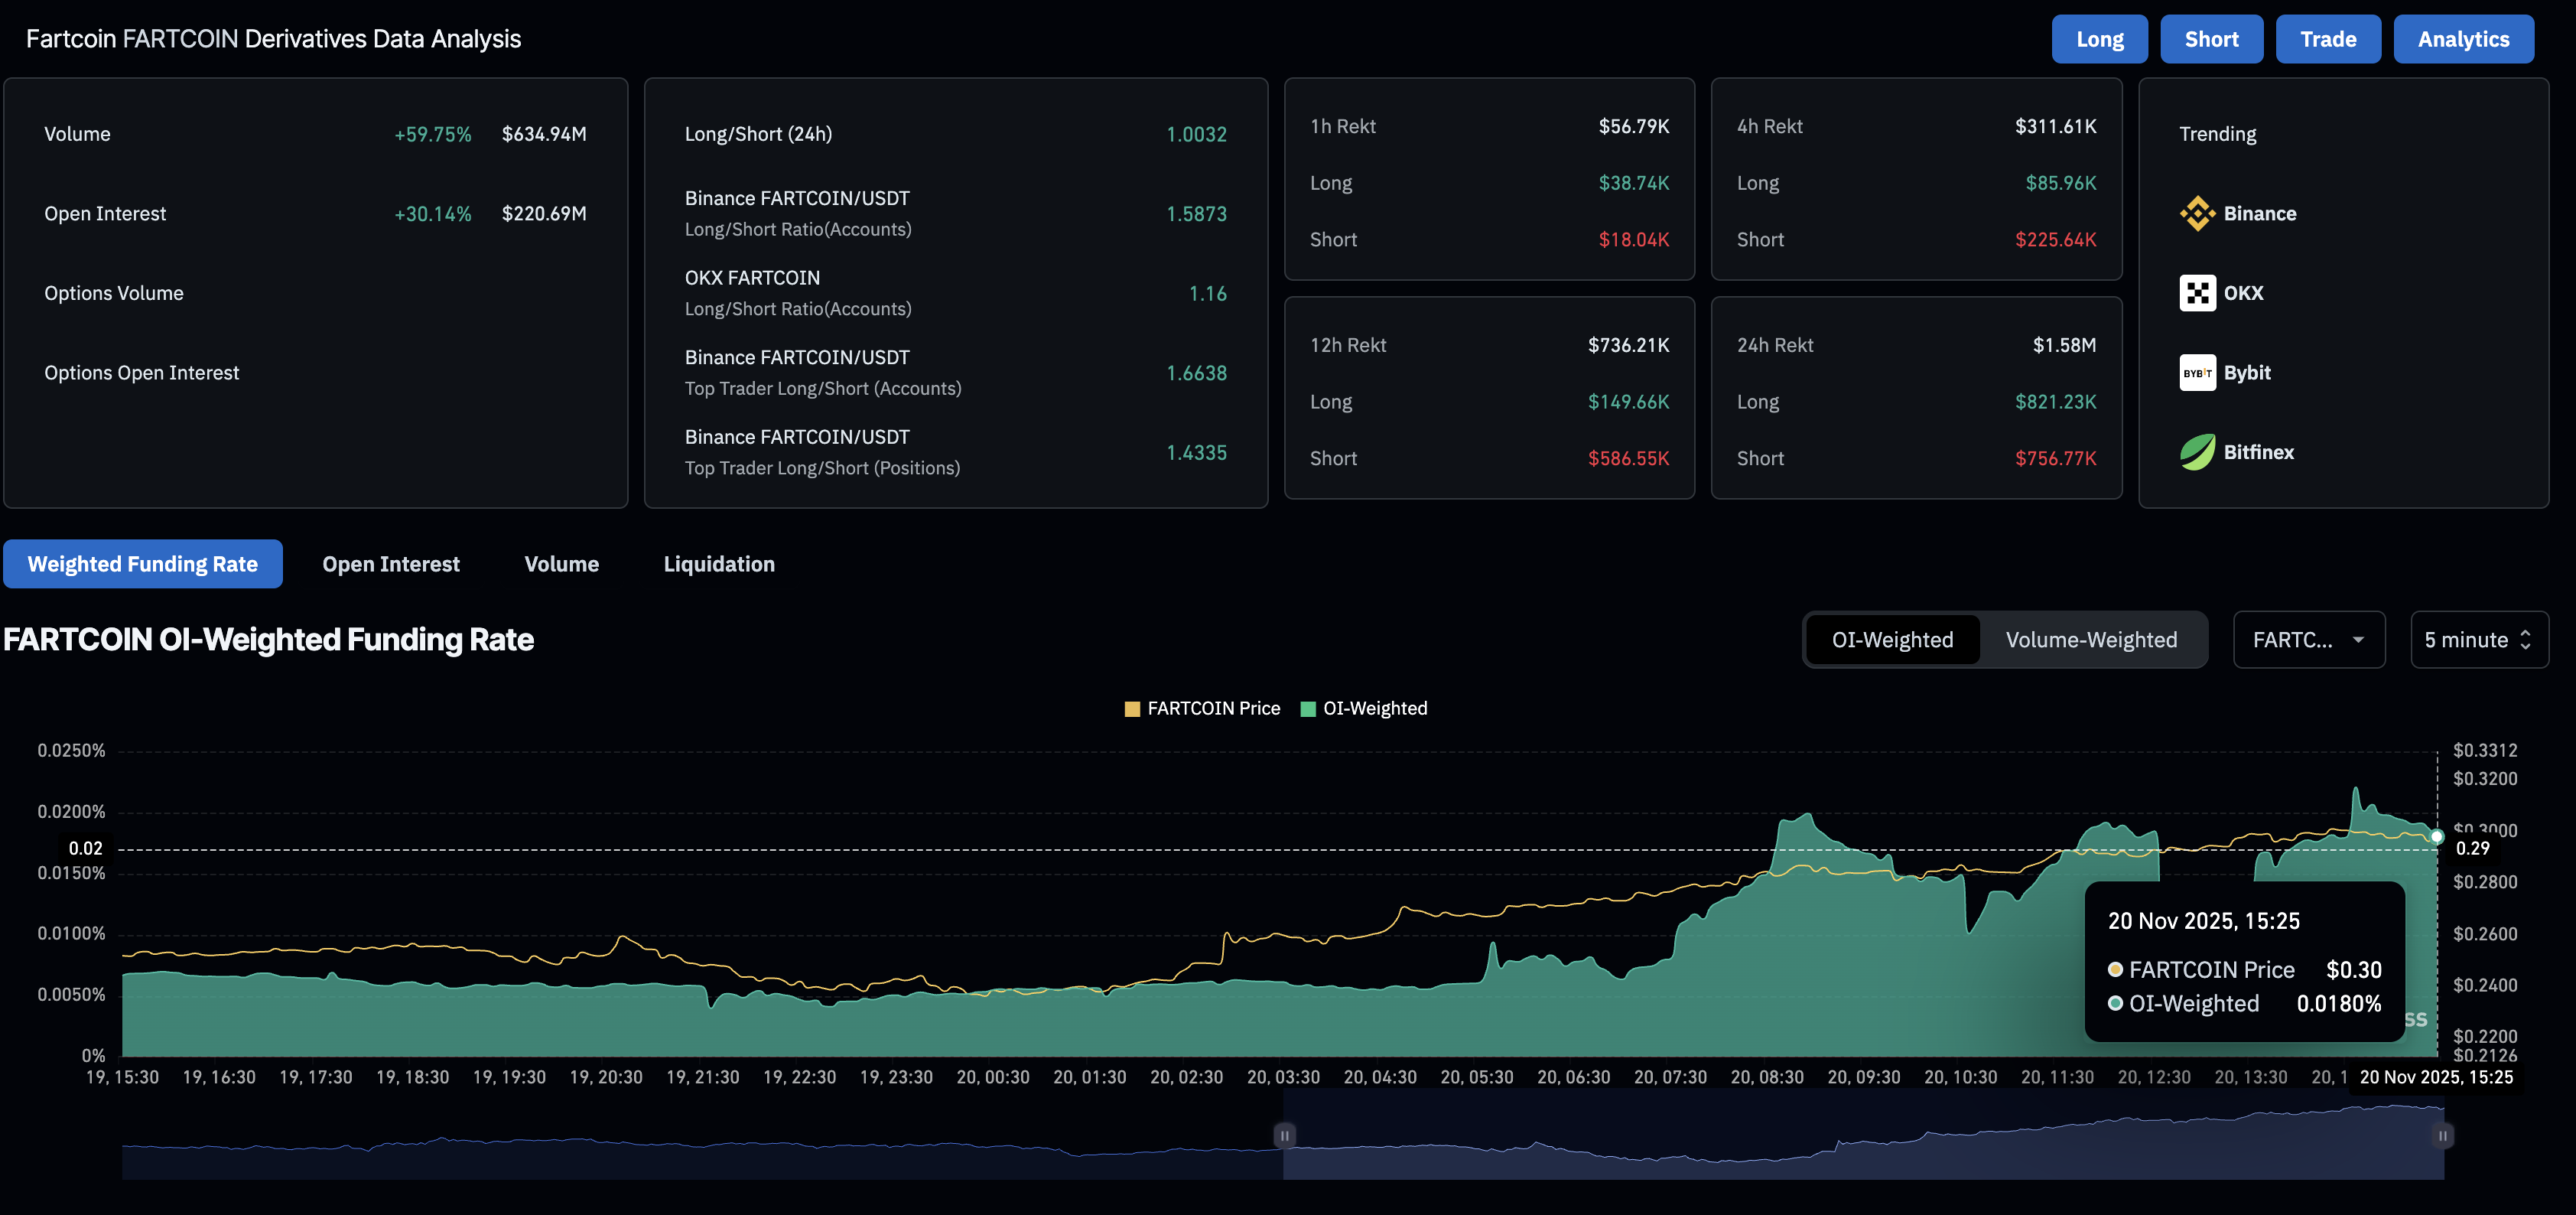
  • A 30% spike in Fartcoin futures Open Interest and heightened funding rates reflect elevated retail demand in the derivatives market. 
  • On-chain data showcases strong support from large wallet investors, fueling the short-term recovery. 

Fartcoin (FARTCOIN) is regaining strength, rising 12% by press time on Thursday, and tests the upper resistance trendline of a falling channel pattern on the daily chart. Both the derivatives and on-chain data suggest that the renewed demand for the meme coin is backed by large wallet investors, commonly referred to as whales. Technically, Fartcoin is poised for a breakout rally amid early signals of resurgent bullish momentum.  

Whales are building bullish Fartcoin positions

Retail interest in Fartcoin is resurfacing, aligning with the short-term recovery, increasing the likelihood that the meme coin can sustain bullish momentum. According to CoinGlass, the FARTCOIN futures Open Interest (OI) has risen by 30% to $220.69 million in the last 24 hours. This sharp increase in OI reflects a massive buying of long positions by traders anticipating further gains. 

Fartcoin derivatives data. Source: CoinGlass

CryptoQuant data shows that the OI surge is driven by whales, as evidenced by the average order size. Apart from derivatives, the whales are buying in the spot market, signaling strong confidence in the meme coin. 

Fartcoin derivatives indicators. Source: CryptoQuant.

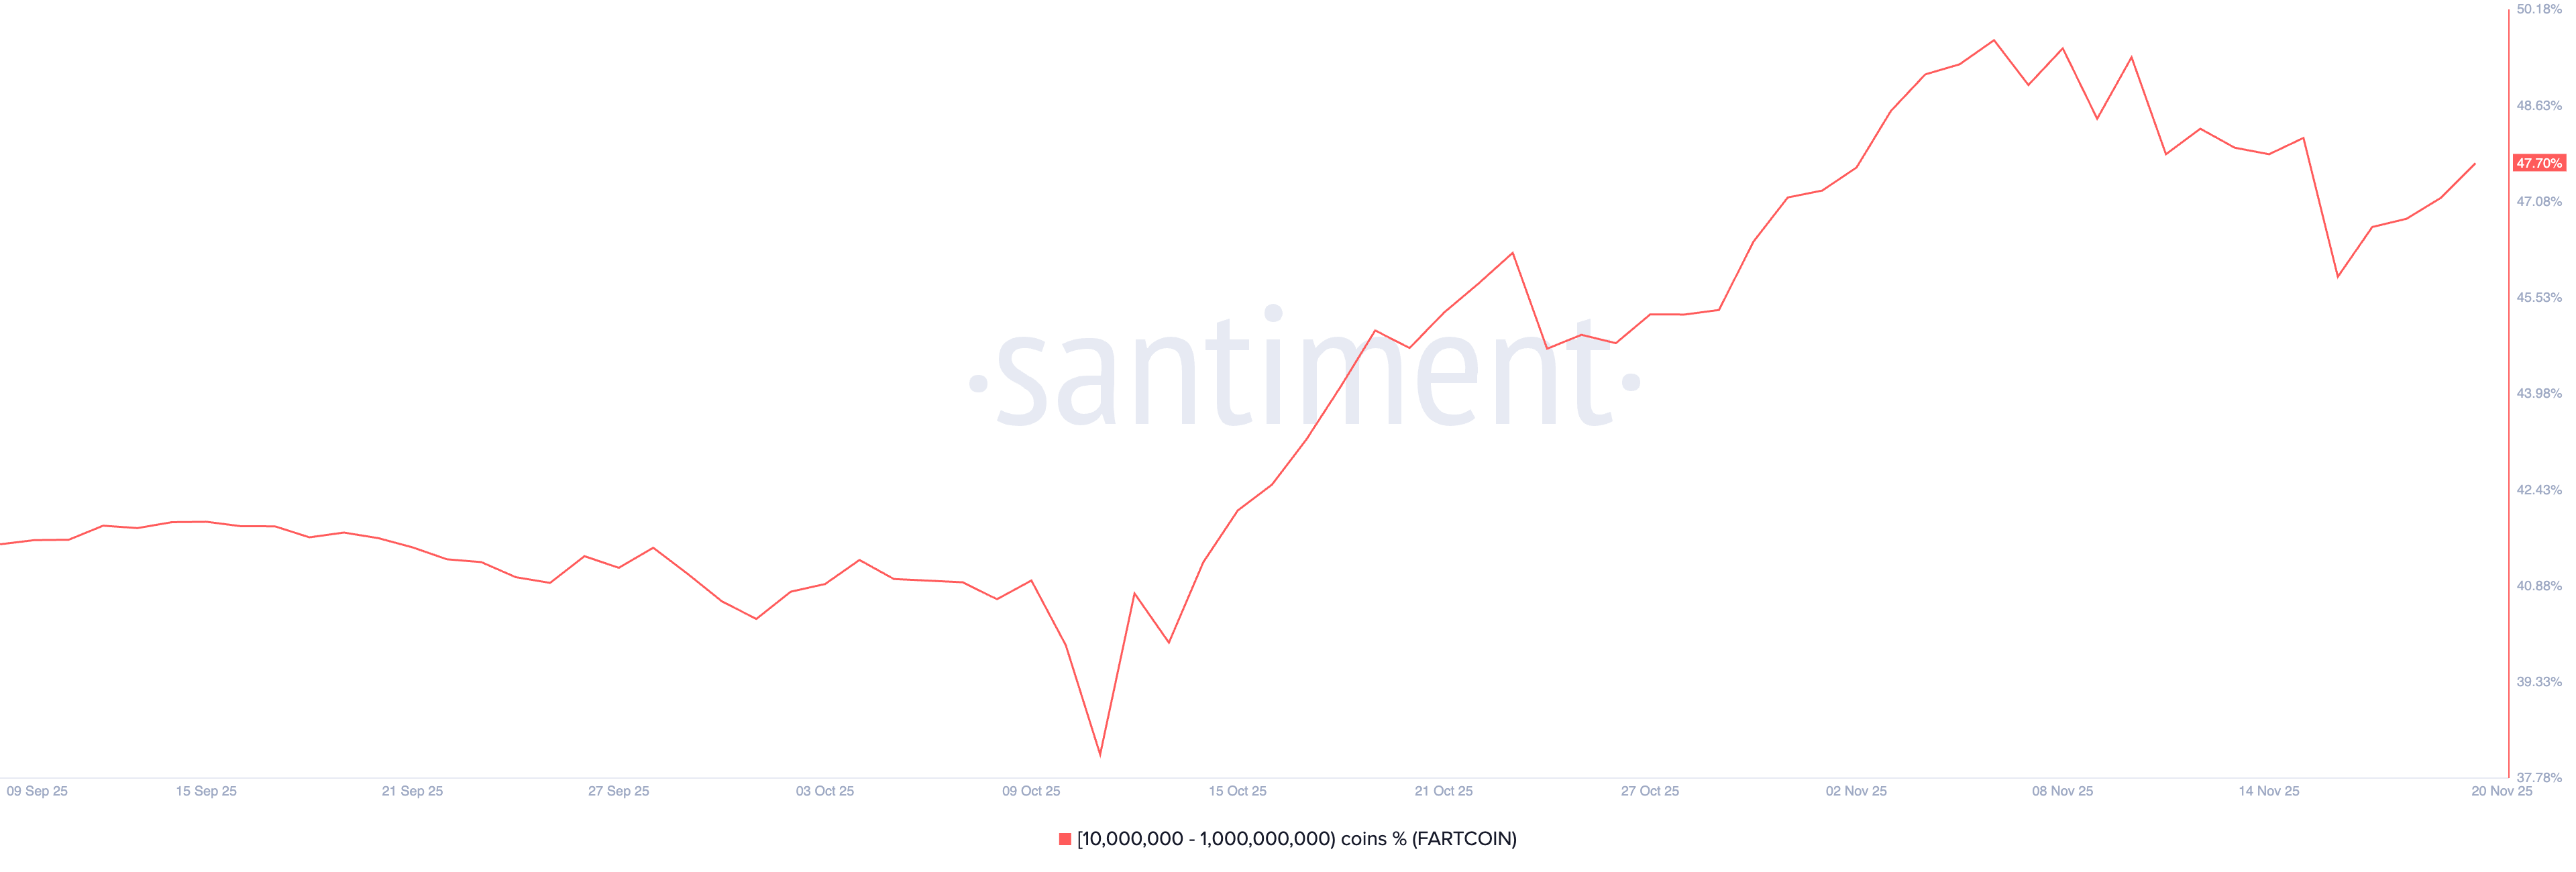
Santiment data shows that investors with 10 million to 1 billion tokens have increased their exposure to 47.70% of the on-chain supply, up from 45.87% on Sunday. As large wallet investors acquire more tokens, FARTCOIN is likely to surge as supply declines and sentiment strengthens, with smart money signaling conviction. 

FARTCOIN supply distribution. Source: Santiment.

Fartcoin builds strength for a potential breakout rally 

Fartcoin’s recovery challenges a local resistance trendline of a falling channel pattern on the daily chart, near the $0.30 round figure. If the Solana-based meme coin successfully holds a daily close above this level, it could confirm the pattern breakout and kickstart a bullish trend. 

A potential breakout rally could target the declining 50-day Exponential Moving Average (EMA) at $0.39, followed by the 50% Fibonacci retracement, drawn from the $1.69 peak of July 22 and the $0.17 low of October 10, at $0.54. 

Corroborating the chances of a breakout rally, the Relative Strength Index (RSI) at 48 is gradually ascending towards the midline as selling pressure wanes. At the same time, the Moving Average Convergence Divergence (MACD) regains buoyancy, extending the uptrend above the signal line to avoid a crossover, with rising green histogram bars signaling renewed bullish momentum. 

Meanwhile, the Rate of Change (ROC) at 3.54 resurfaces above the zero line, marking a positive shift in trend momentum. A steady rise in ROC above zero indicates stronger bullish momentum. 

FARTCOIN/USDT daily logarithmic chart.

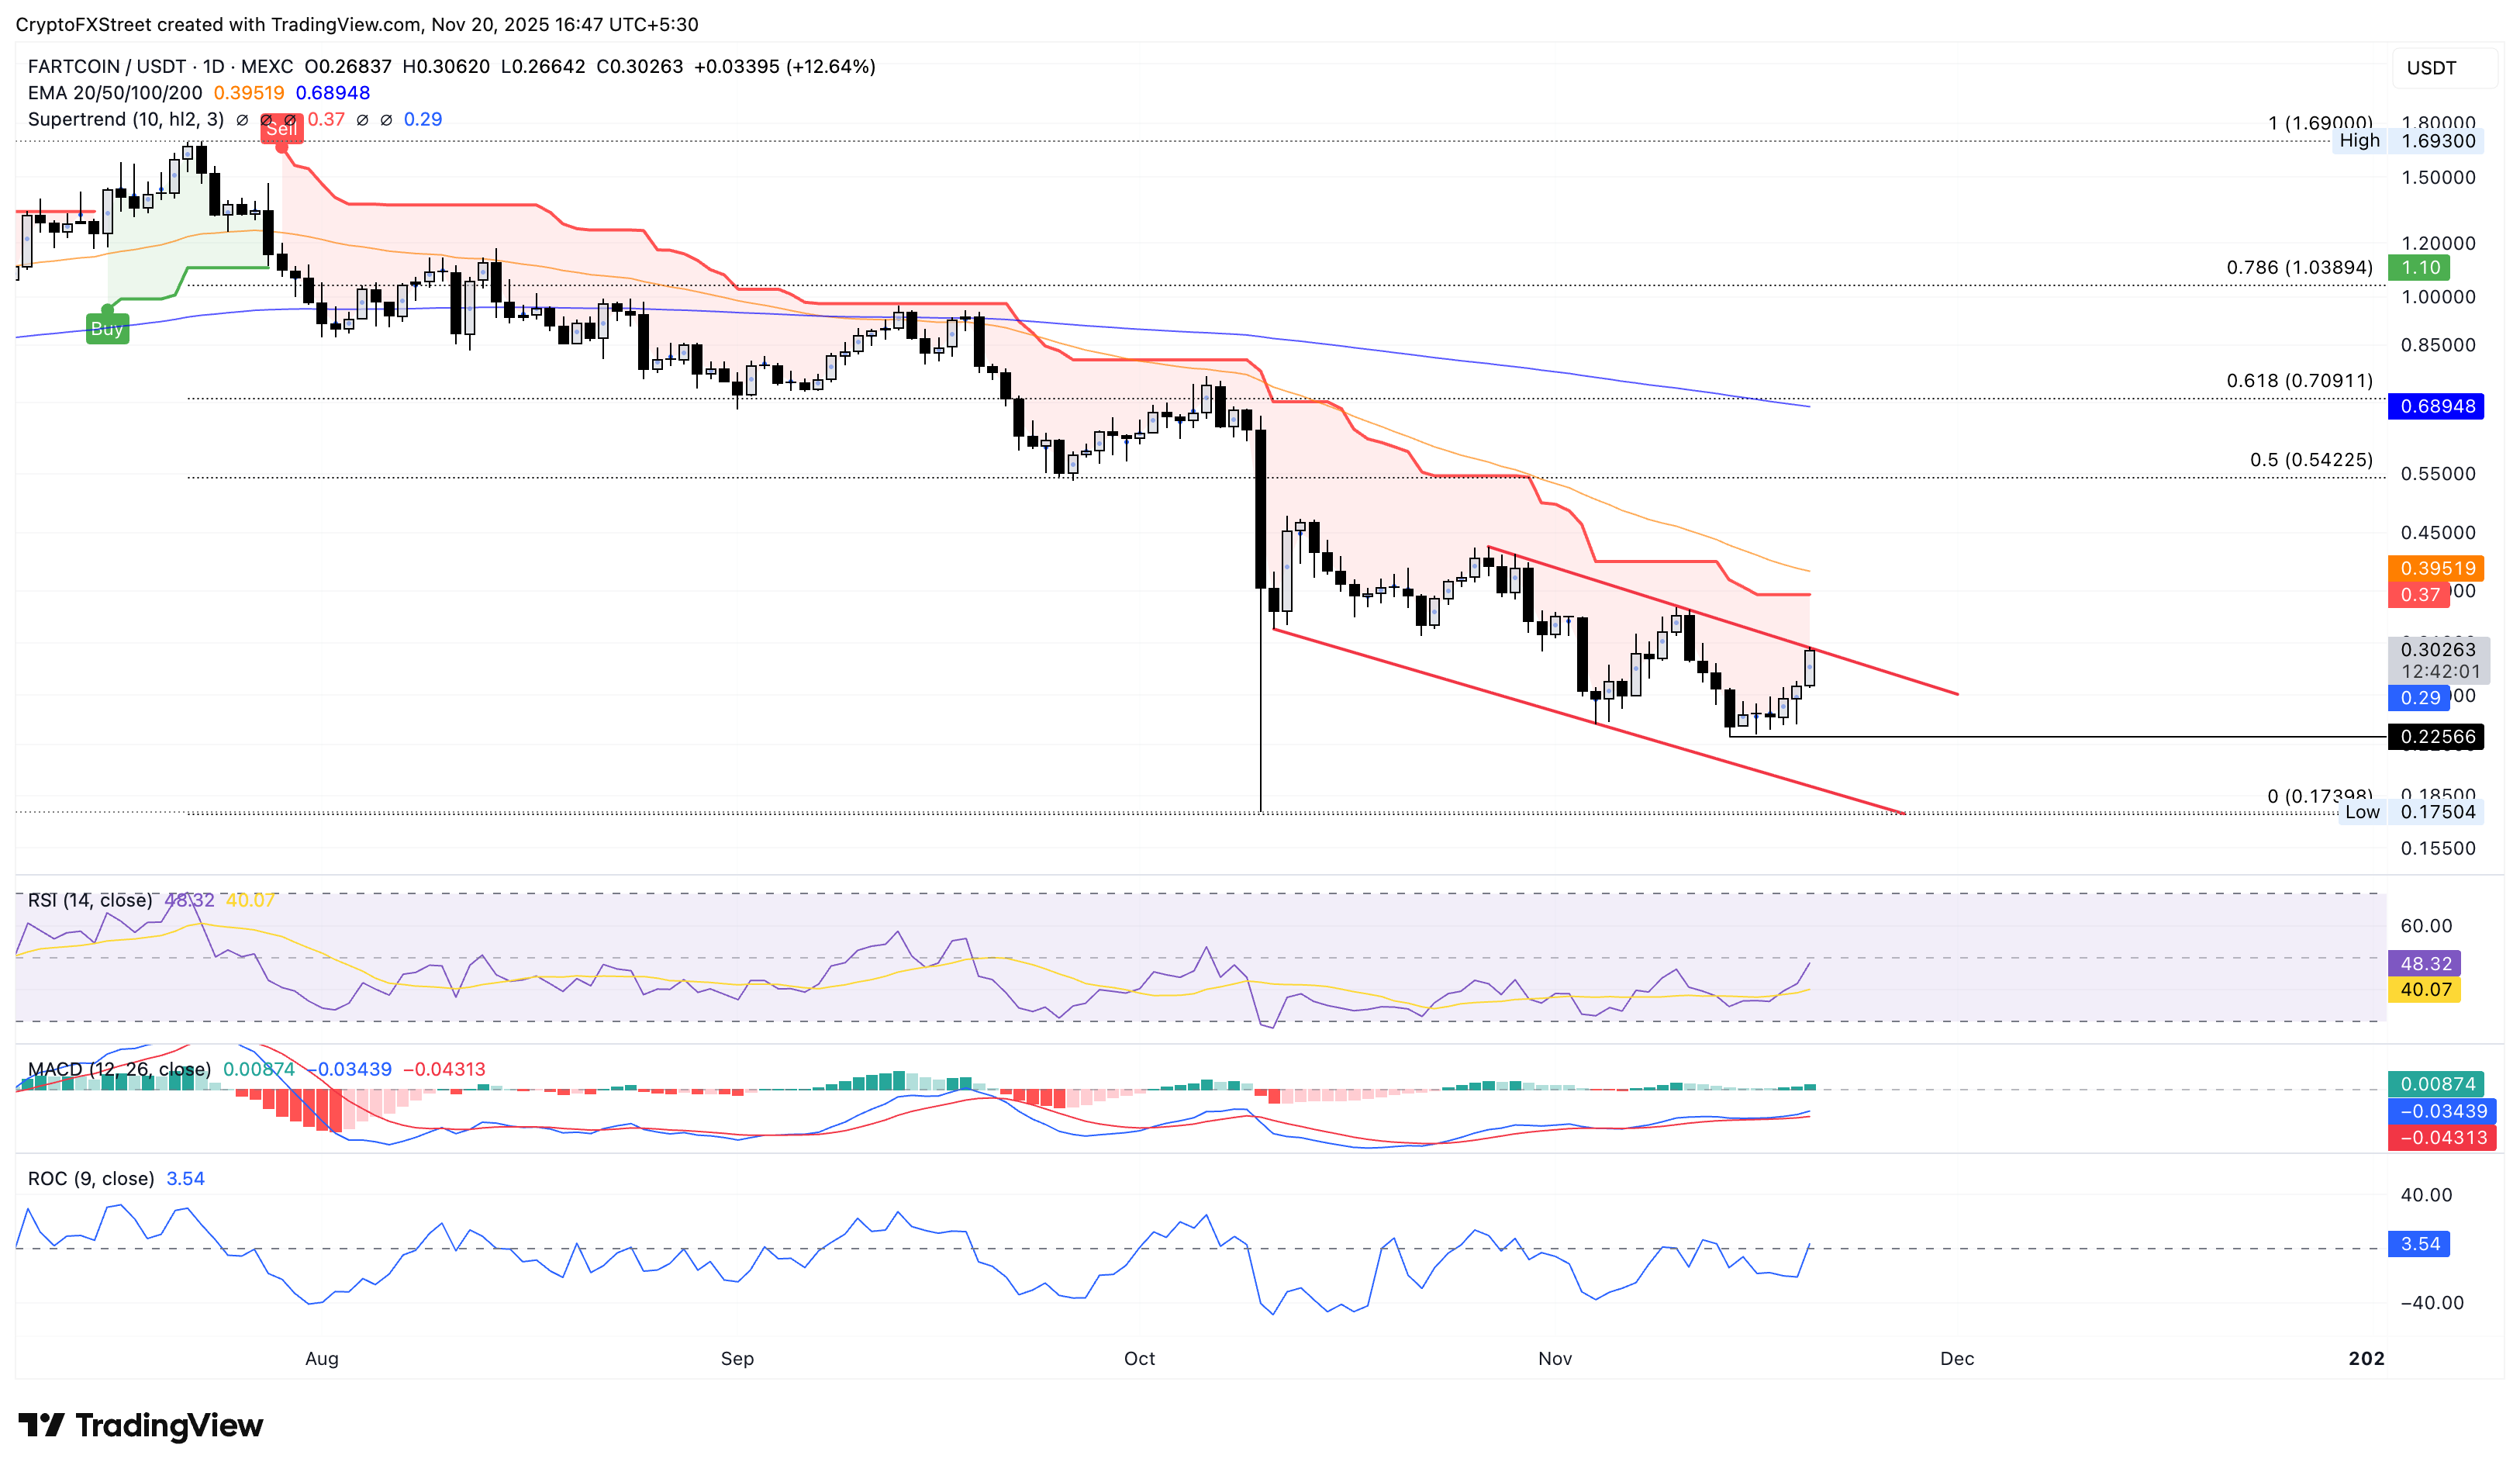
If FARTCOIN fails to sustain bullish momentum, it could revert within the falling channel, potentially threatening the $0.22 low from Friday. 

Isenção de responsabilidade: Apenas para fins informativos. O desempenho passado não é indicativo de resultados futuros.
placeholder
O ouro permanece perto da mínima de uma semana em meio à redução nas apostas de corte de juros pelo FedO ouro (XAU/USD) continua sob pressão de venda pelo quarto dia consecutivo nesta terça-feira e recua novamente para perto da mínima de uma semana e meia, na região dos $4.000, atingida no dia anterior.
Autor  FXStreet
11 Mês 18 Dia Ter
O ouro (XAU/USD) continua sob pressão de venda pelo quarto dia consecutivo nesta terça-feira e recua novamente para perto da mínima de uma semana e meia, na região dos $4.000, atingida no dia anterior.
placeholder
Ethereum (ETH) cai 20% em novembro e testa US$ 3.000; indicador aponta 'zona de compra' históricaO Ether (ETH), token nativo da rede Ethereum, registrou uma queda de quase 20% ao longo do mês de novembro. O ativo saiu da casa dos US$ 3.900 para retestar o nível psicológico de US$ 3.000 no dia 17 de novembro.
Autor  Pedro Augusto Prazeres
Ontem 02: 08
O Ether (ETH), token nativo da rede Ethereum, registrou uma queda de quase 20% ao longo do mês de novembro. O ativo saiu da casa dos US$ 3.900 para retestar o nível psicológico de US$ 3.000 no dia 17 de novembro.
placeholder
A Semrush se une à Adobe para impulsionar a próxima geração de marketing generativo com IA.A Adobe adquire a Semrush por US$ 1,9 bilhão, integrando ferramentas de SEO e marketing com inteligência artificial para aumentar a visibilidade da marca em plataformas digitais e baseadas em IA.
Autor  Cryptopolitan
13 horas atrás
A Adobe adquire a Semrush por US$ 1,9 bilhão, integrando ferramentas de SEO e marketing com inteligência artificial para aumentar a visibilidade da marca em plataformas digitais e baseadas em IA.
placeholder
Bitcoin (BTC) cai com ata do Fed; "Medo Extremo" e capitulação podem sinalizar fundoO Bitcoin (BTC) aprofundou sua correção nesta quarta-feira (19), caindo para baixo do patamar de US$ 89.000 e atingindo sua mínima em sete meses. O movimento de aversão ao risco foi intensificado pela divulgação das atas da reunião do Federal Reserve (Fed) realizada em 28 e 29 de outubro.
Autor  Pedro Augusto Prazeres
12 horas atrás
O Bitcoin (BTC) aprofundou sua correção nesta quarta-feira (19), caindo para baixo do patamar de US$ 89.000 e atingindo sua mínima em sete meses. O movimento de aversão ao risco foi intensificado pela divulgação das atas da reunião do Federal Reserve (Fed) realizada em 28 e 29 de outubro.
placeholder
Ibovespa cai antes do feriado; dólar sobe a R$ 5,33 com cautela e queda do petróleoO Ibovespa encerrou esta quarta-feira (19) em queda de 0,73%, aos 155.380,66 pontos, registrando uma perda de mais de 1.100 pontos. O movimento marca a terceira baixa consecutiva do índice, uma sequência negativa que não era vista desde o início de outubro.
Autor  Pedro Augusto Prazeres
11 horas atrás
O Ibovespa encerrou esta quarta-feira (19) em queda de 0,73%, aos 155.380,66 pontos, registrando uma perda de mais de 1.100 pontos. O movimento marca a terceira baixa consecutiva do índice, uma sequência negativa que não era vista desde o início de outubro.
goTop
quote