


Meme Coins Price Prediction: Dogecoin, Shiba Inu, Pepe flash bearish potential
- Dogecoin drops below $0.18000, marking its fourth consecutive day of loss.
- Shiba Inu under high selling pressure breaks below the $0.00001000 psychological support.
- Pepe continues to experience a steady decline as the retail interest plummets.
Meme coins such as Dogecoin (DOGE), Shiba Inu (SHIB), and Pepe (PEPE) are at risk of steeper corrections as the broader cryptocurrency market weakens. The pullback over the last three days has driven the top meme coins to a cliff as support levels turn to lines in the sand. Technically, DOGE, SHIB, and PEPE are at a make-or-break level, while nearly $1 billion in total liquidations in the crypto market point to a bearish incline.
The meme coins futures market turns bleak
Meme coins such as Dogecoin, Shiba Inu, and Pepe are the first to lose retail interest in the event of a broader cryptocurrency market sell-off. In the ongoing market downcycle, CoinGlass data shows a double-digit decline of over 10% in the futures Open Interest (OI) of DOGE, SHIB, and PEPE in the last 24 hours, reaching $1.82 billion, $87.78 million, and $246.64 million, respectively. This decline in futures Open Interest suggests that optimism is waning among investors who are either closing long positions or deleveraging to minimise exposure.
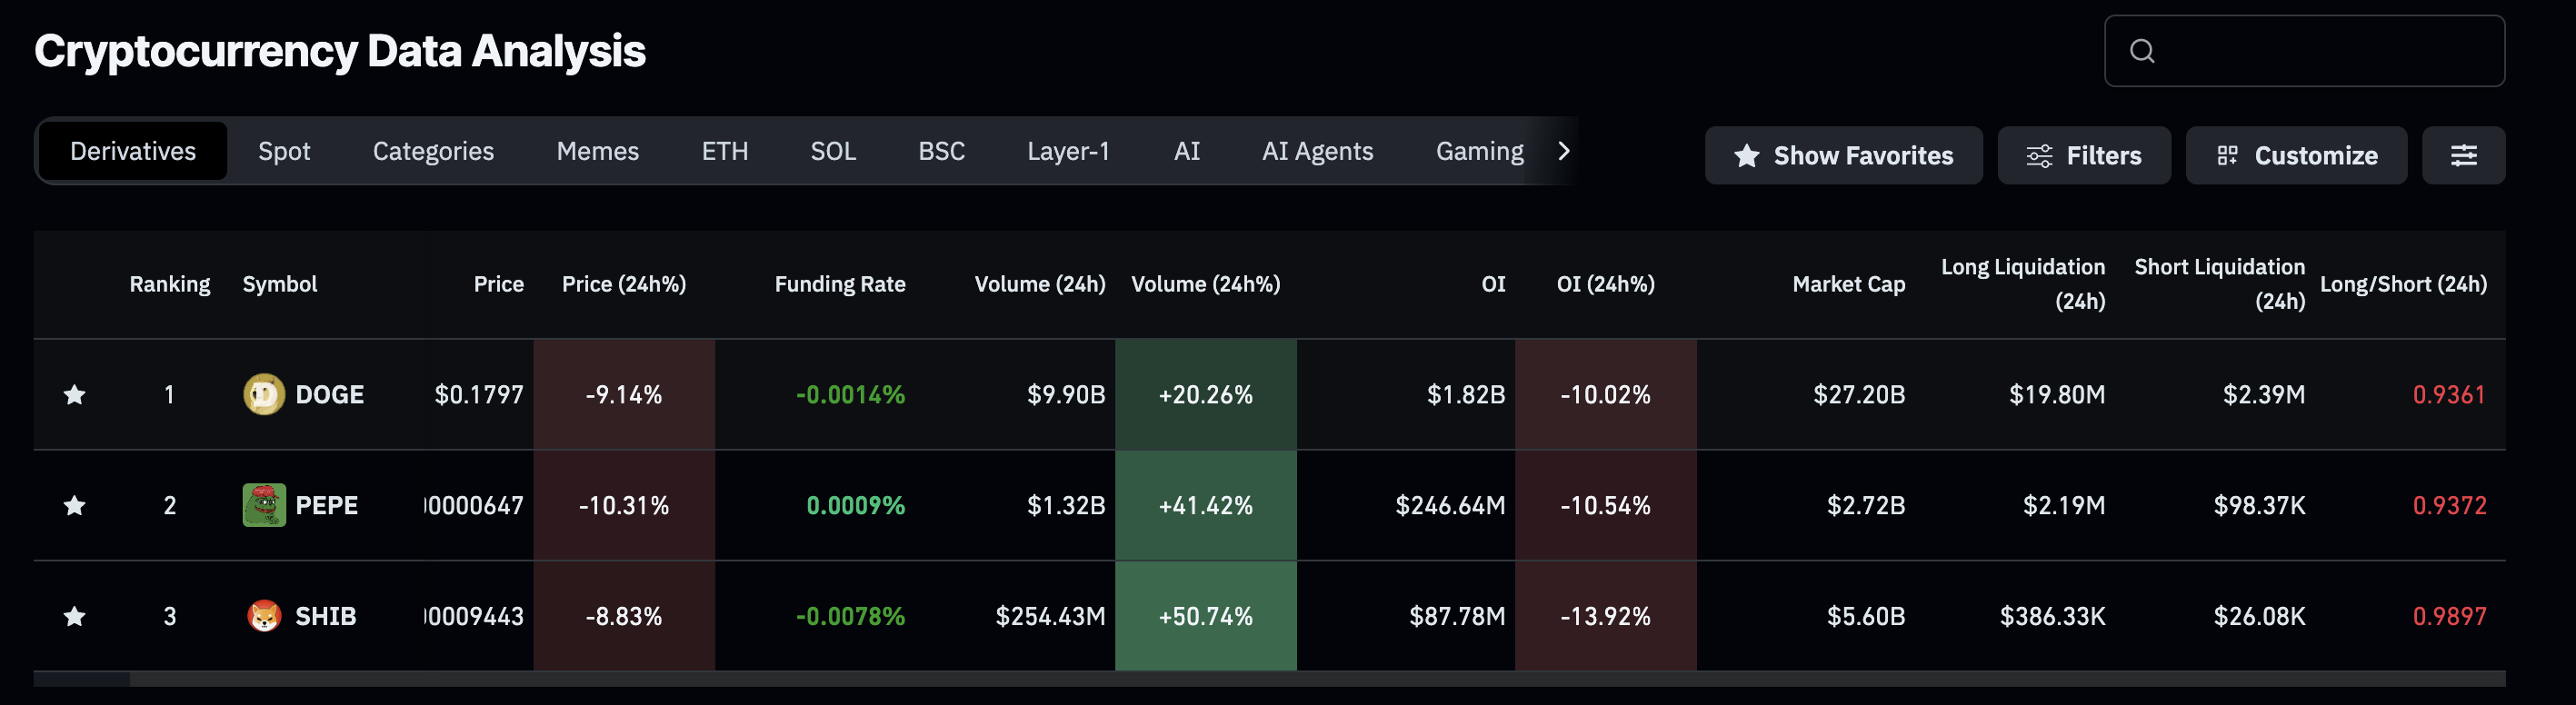
Meme coins derivatives data. Source: CoinGlass
Dogecoin under pressure eyes further loss
Dogecoin edges lower by nearly 5% at press time on Friday, extending the loss for the fourth consecutive day. The meme coin has dropped below Saturday’s close at $0.18527, eyeing the $0.15000 round figure and the S2 Pivot Point level at $0.14610.
The momentum indicators on the daily chart are reflecting a bearish dominance as the Moving Average Convergence Divergence (MACD) extends its freefall into negative territory. At the same time, the successive rise in red histogram bars corroborates the surge in selling pressure.
Additionally, the Relative Strength Index (RSI) reads 34 on the same chart, maintaining a steady decline and approaching the oversold zone as bearish pressure increases.
Additionally, the downward shift in the 50-day, 100-day, and 200-day Exponential Moving Averages (EMAs) poses the risk of bearish crossovers, which would confirm the start of a downtrend in Dogecoin.
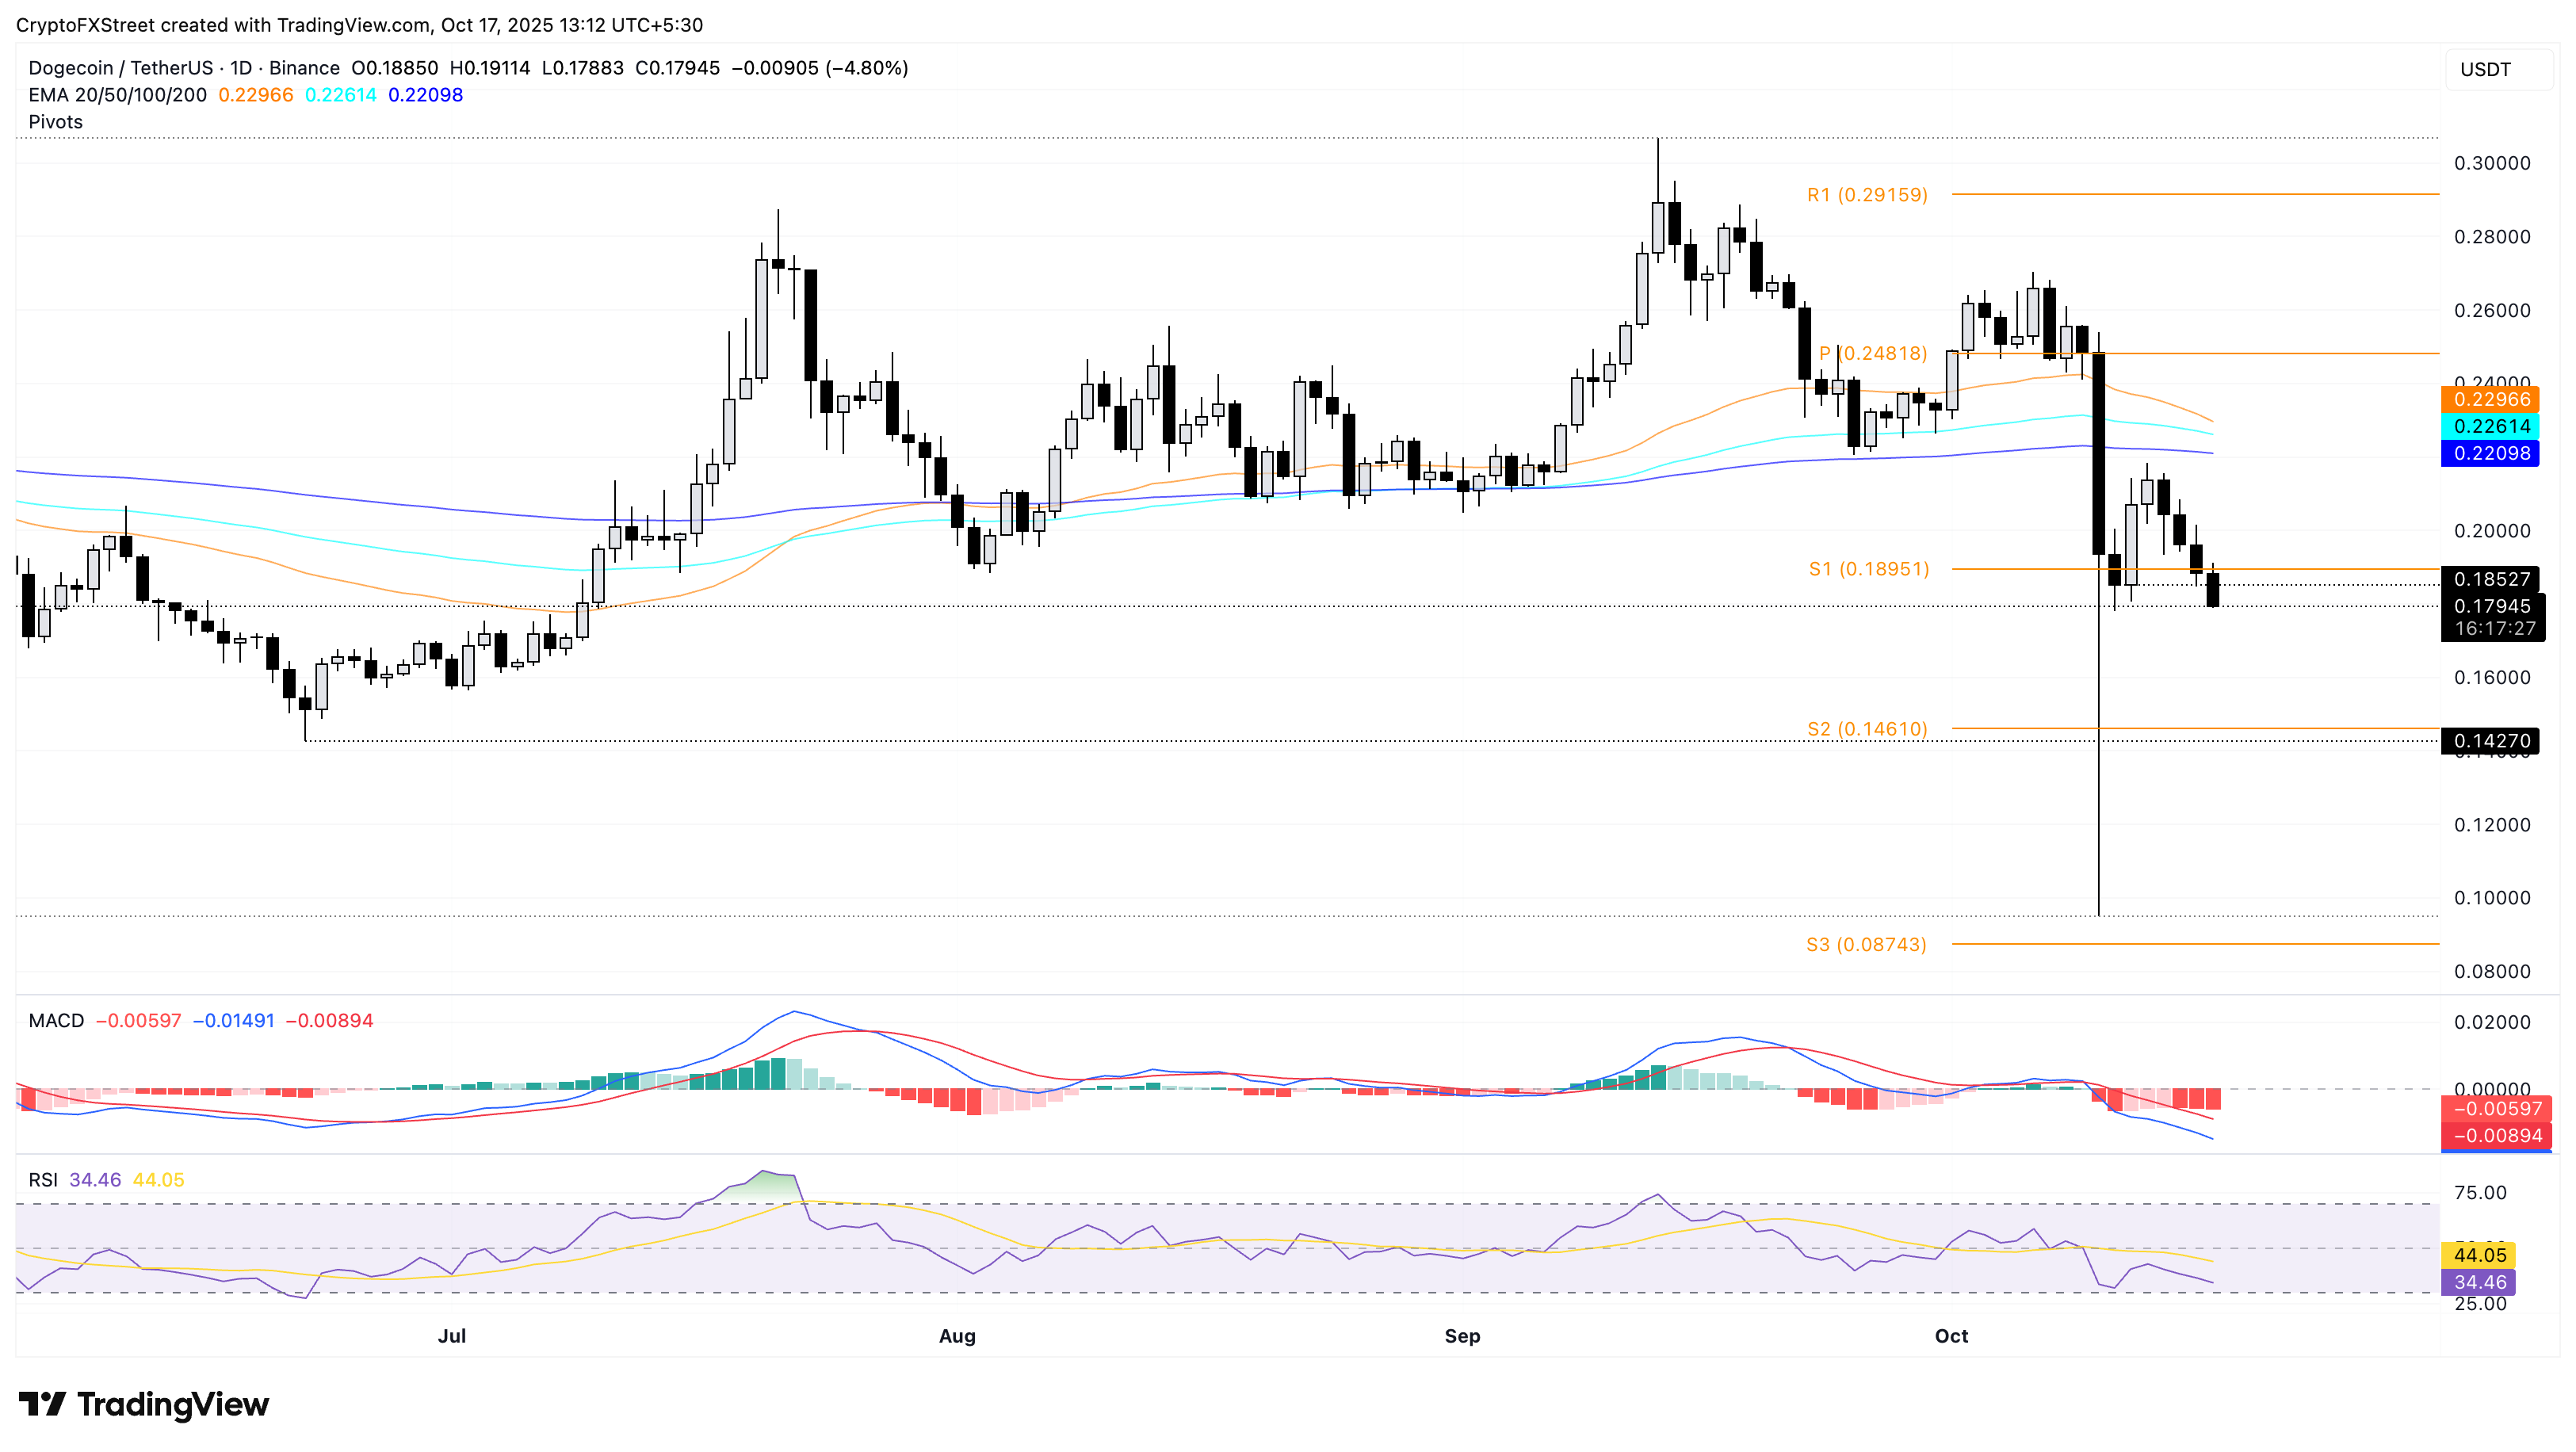
DOGE/USDT daily price chart.
Looking up, if DOGE recovers the intraday loss to hold above $0.18000, it could retest the S1 Pivot Point level at $0.18951.
Shiba Inu tanks below key psychological support
Shiba Inu trades below the declining 50-day, 100-day, and 200-day EMAs at $0.00001193, $0.00001241, and $0.00001328, indicating a bearish trend. At the time of writing, SHIB is down by nearly 6% on Friday, extending the 3% decline from the previous day.
The four-day pullback has erased gains made over the weekend and has broken below the $0.00001000 psychological level. If SHIB fails to hold ground at the S2 Pivot Point level at $0.00000935, it could extend the decline to the S3 Pivot Point level at $0.00000723.
Technical signals from the daily chart suggest that selling activities are on the rise as the MACD and its signal line extend the correction wave below the zero line. Additionally, the RSI at 31 approaches the oversold zone after failing to sustain in the neutral region.
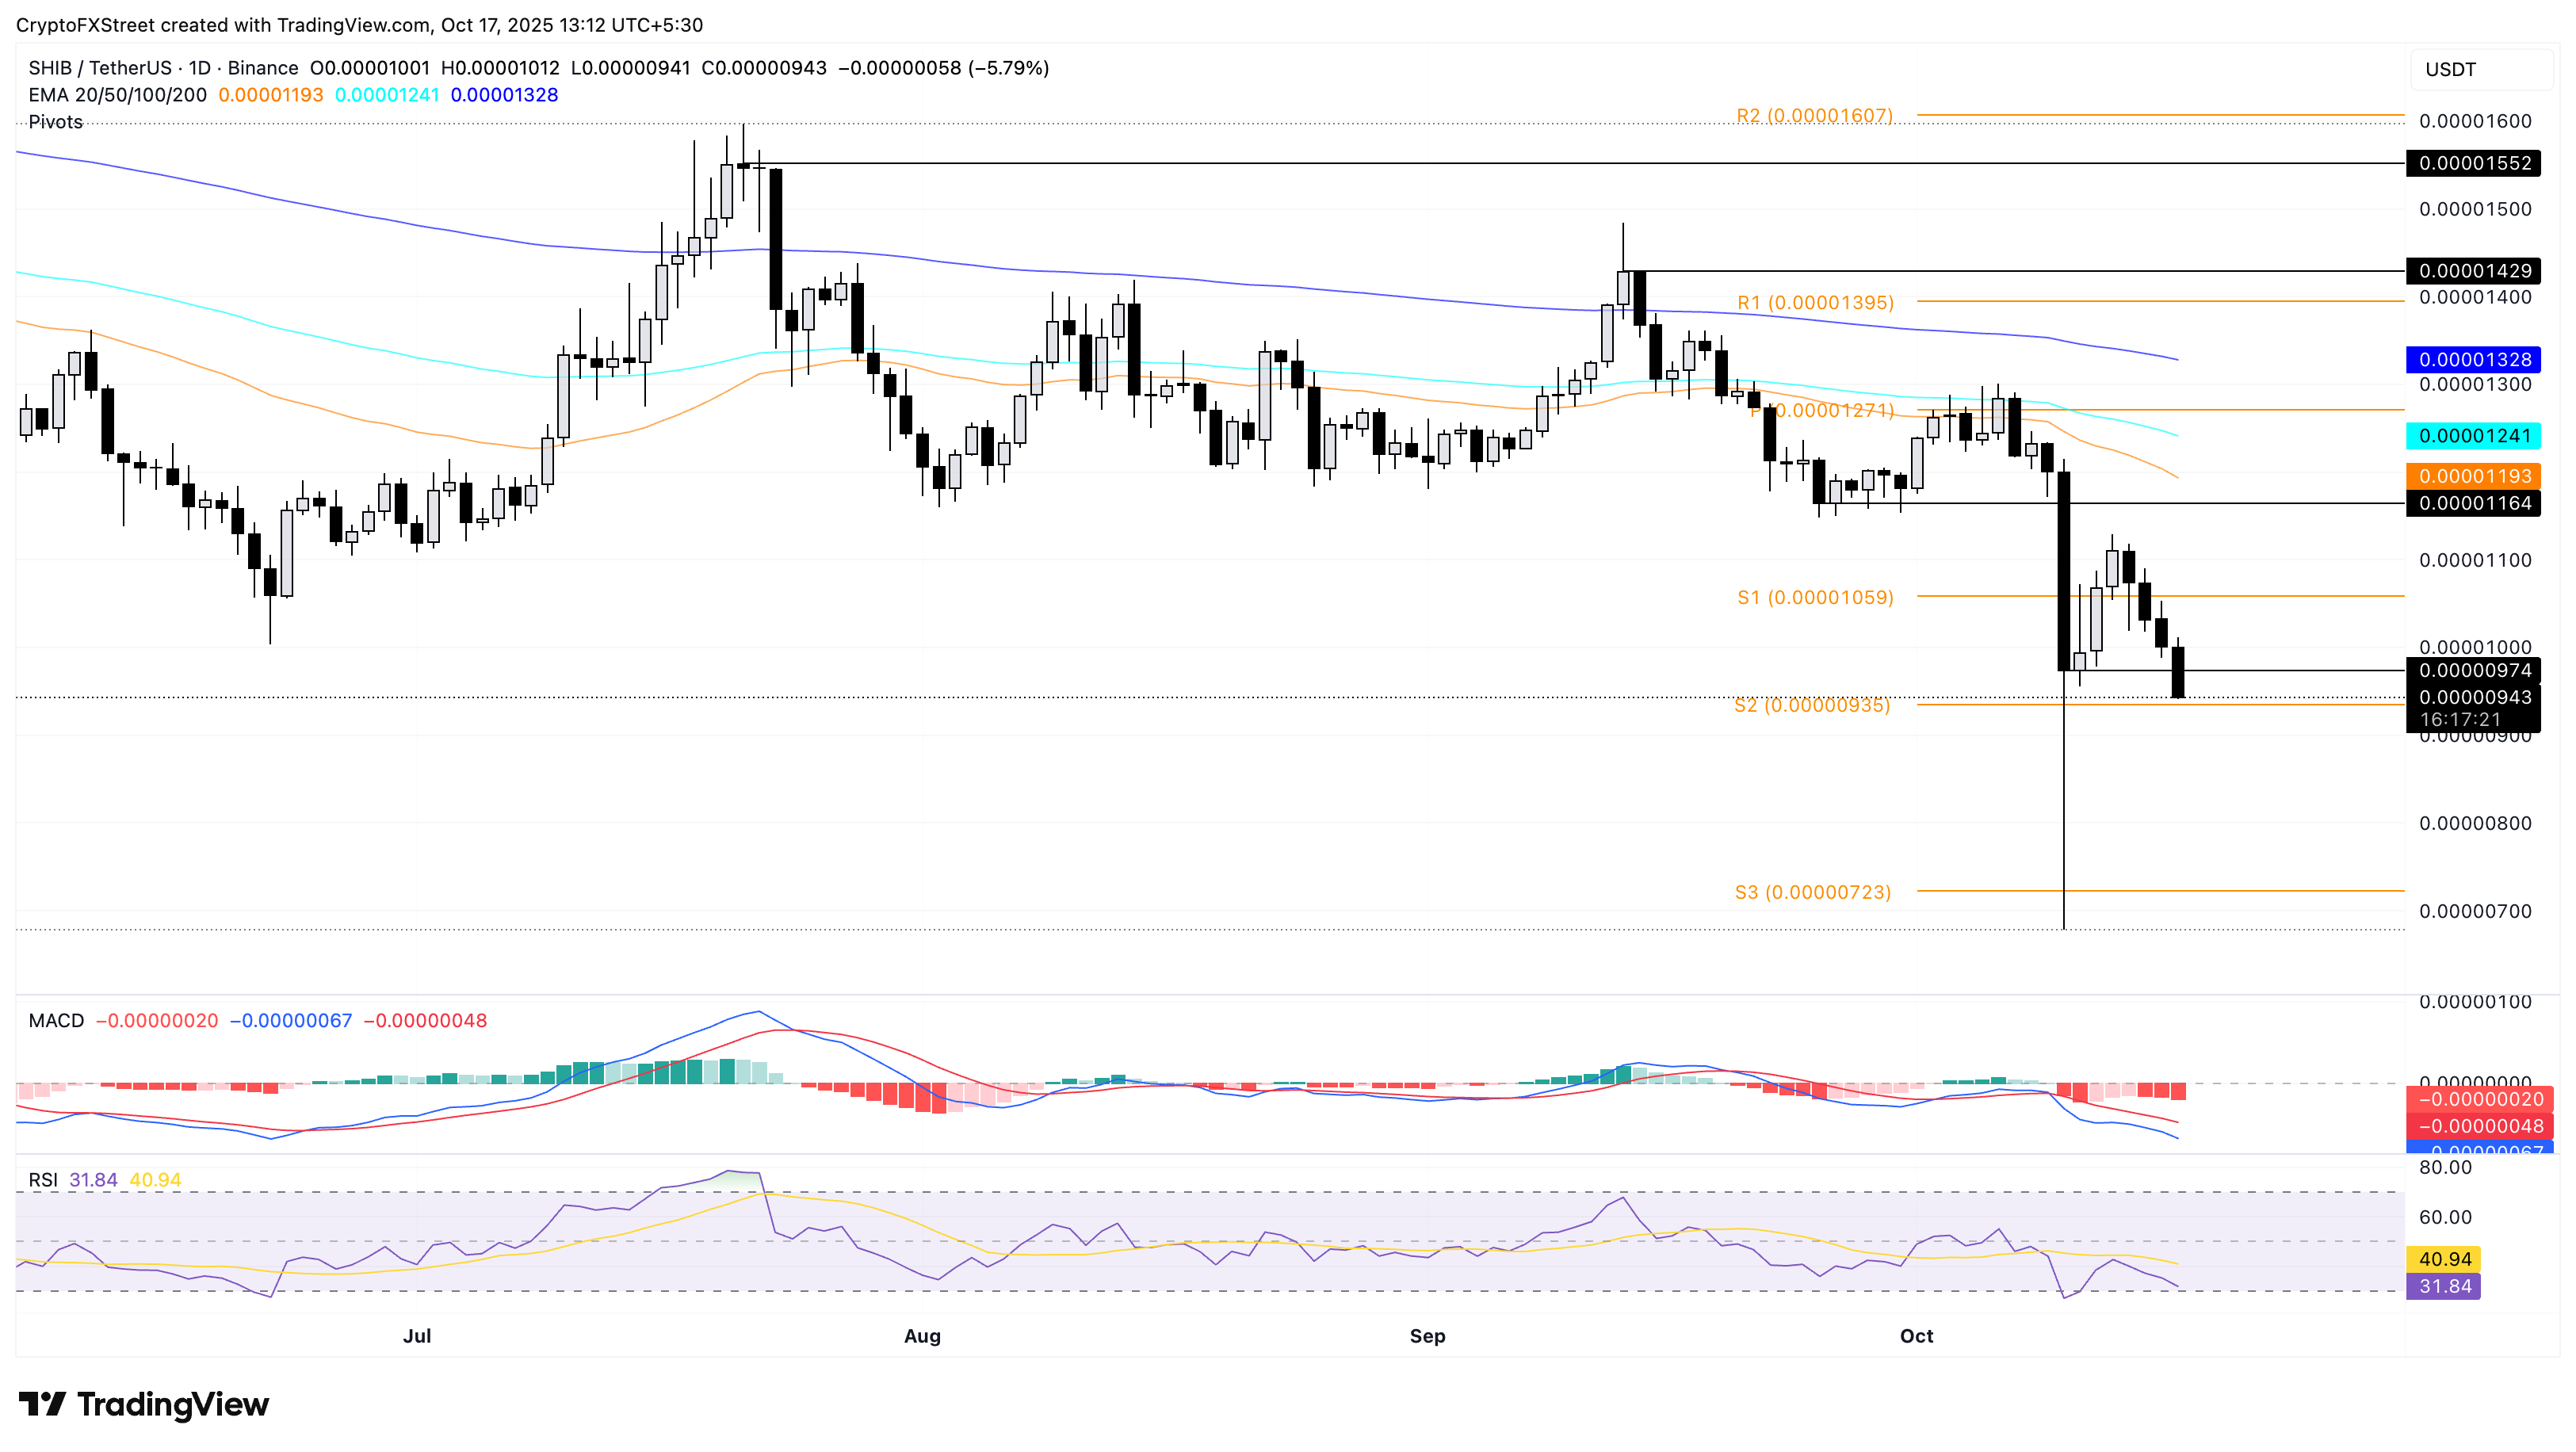
SHIB/USDT daily price chart.
To reinforce a recovery run, SHIB should reclaim the $0.00001000 psychological level, potentially targeting the S1 Pivot Point level at $0.00001059.
Pepe’s downtrend risks breaking another line in the sand
Pepe edges lower by over 6% at press time on Friday, risking a bearish weekend ahead. The frog-themed meme coin tests the S2 Pivot Point level, acting as the immediate support level, at $0.00000645.
A decisive close below this level would legitimize the possibility of a downfall to the S3 Pivot Point level at $0.00000404.
Similar to Shiba Inu, the technical indicators on the daily chart signal further downside risk as the MACD and its signal line trend downward. On the other hand, RSI at 30 reverts to the oversold zone after a brief recovery earlier this week, indicating a weak recovery in hindsight.
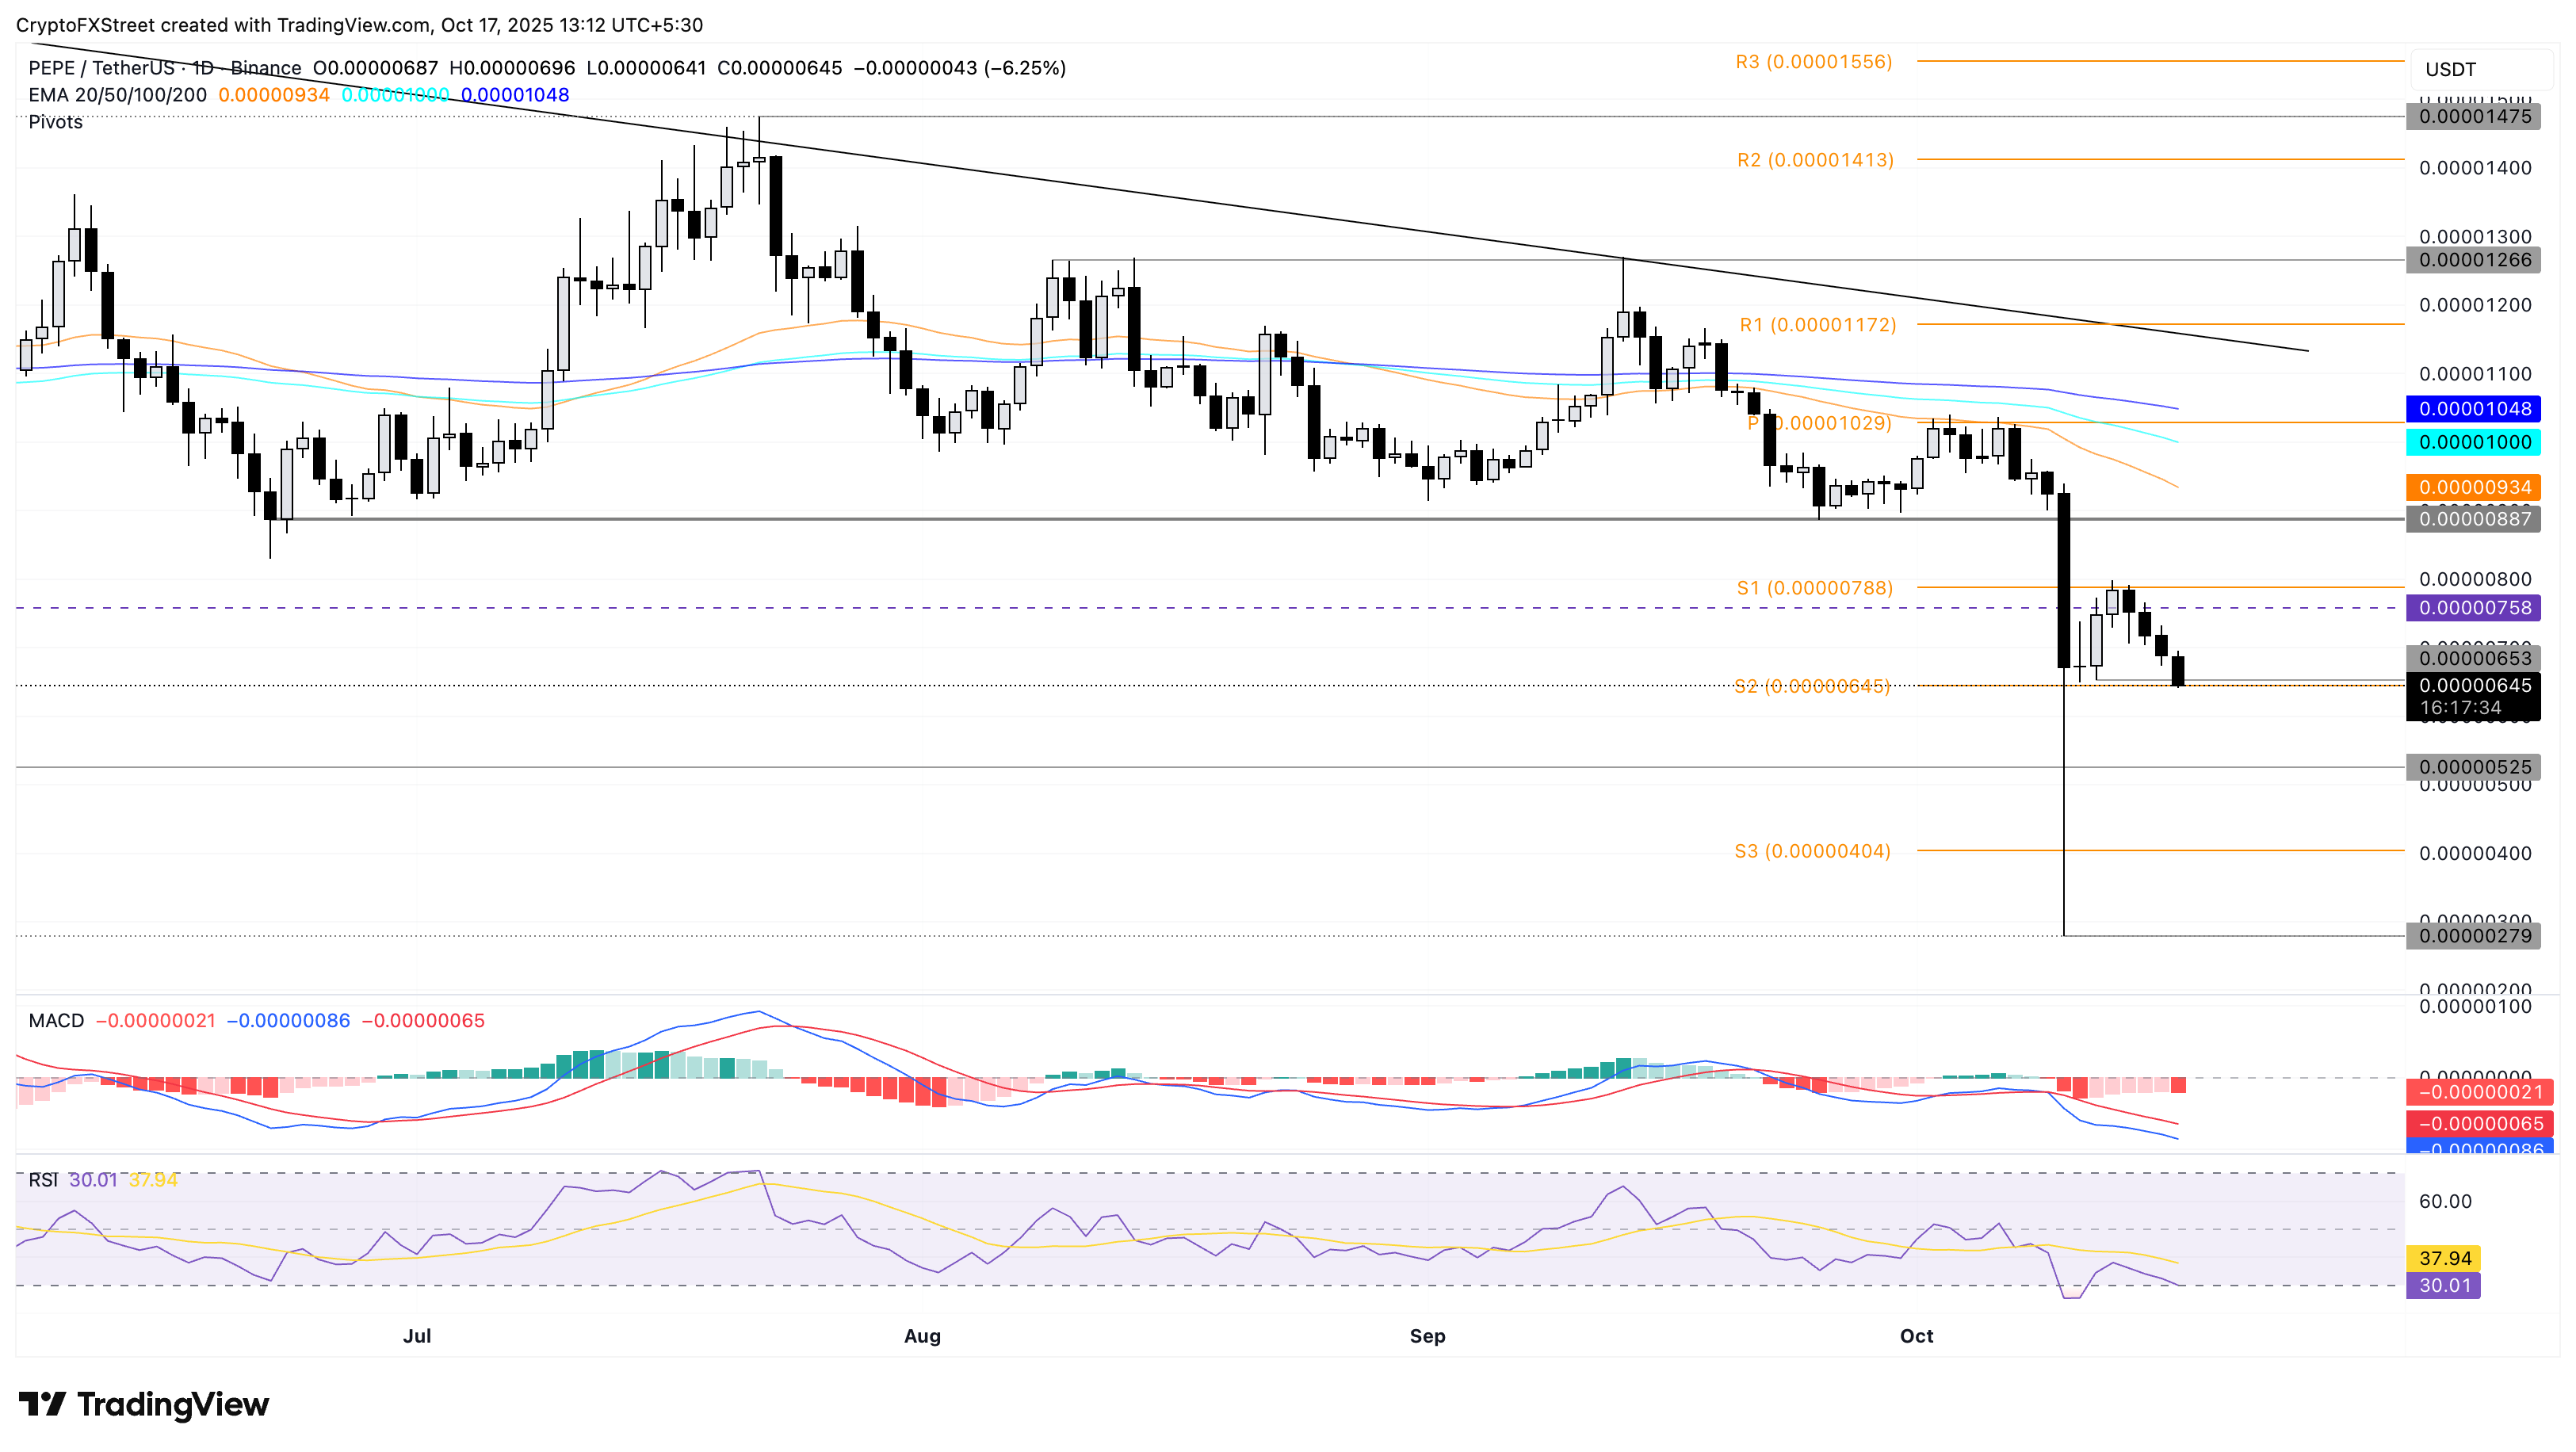
PEPE/USDT daily price chart.
A bounce back from the S2 Pivot Point at $0.00000645 could retest the S1 Pivot Point at $0.00000788.
Artigos Recomendados


