
Top Crypto Gainers: Aethir, Aster, and Flare rally hits double-digit rise
- Aethir outperforms the broader cryptocurrency market in the last 24 hours, with a 15% rise.
- Aster extends the rally with an 11% rise in the last 24 hours, ahead of the Trust Wallet integration.
- Flare ranks among the top performers with the launch of FAssets, FXRP.
Aethir (ATH), Aster (ASTER) and Flare (FLR) rallied and posted double-digit gains in the last 24 hours from press time, outperforming the broader cryptocurrency market. The technical outlook of ATH, ASTER, and FLR suggests further upside movement, driven by increased bullish momentum. Furthermore, the increased computing demand for AI, upcoming integration with Trust Wallet (TWT), and the launch of FAssets could boost sentiments around Aethir, Aster, and Flare.
Aethir extends uptrend as bullish momentum holds
Aethir holds steady above $0.06000 at the time of writing on Thursday, following a 13% rise on Wednesday. The computing token extends the trendline breakout rally with a bounce back from the 61.8% Fibonacci retracement level at $0.05565, which is drawn from the $0.09326 peak of December 12 to the $0.02413 low of April 7.
The ATH rally targets the 78.6% Fibonacci retracement level at $0.06983 as bullish momentum builds.
The Relative Strength Index (RSI) is at 67, pointing upwards with a rebound inching closer to the overbought zone, indicating heightened buying pressure. Still, the Moving Average Convergence Divergence (MACD) moves flat after crossing below its signal line, suggesting indecisiveness in the short term. If MACD resurfaces above its signal line, it would provide an early signal of an extended rally.
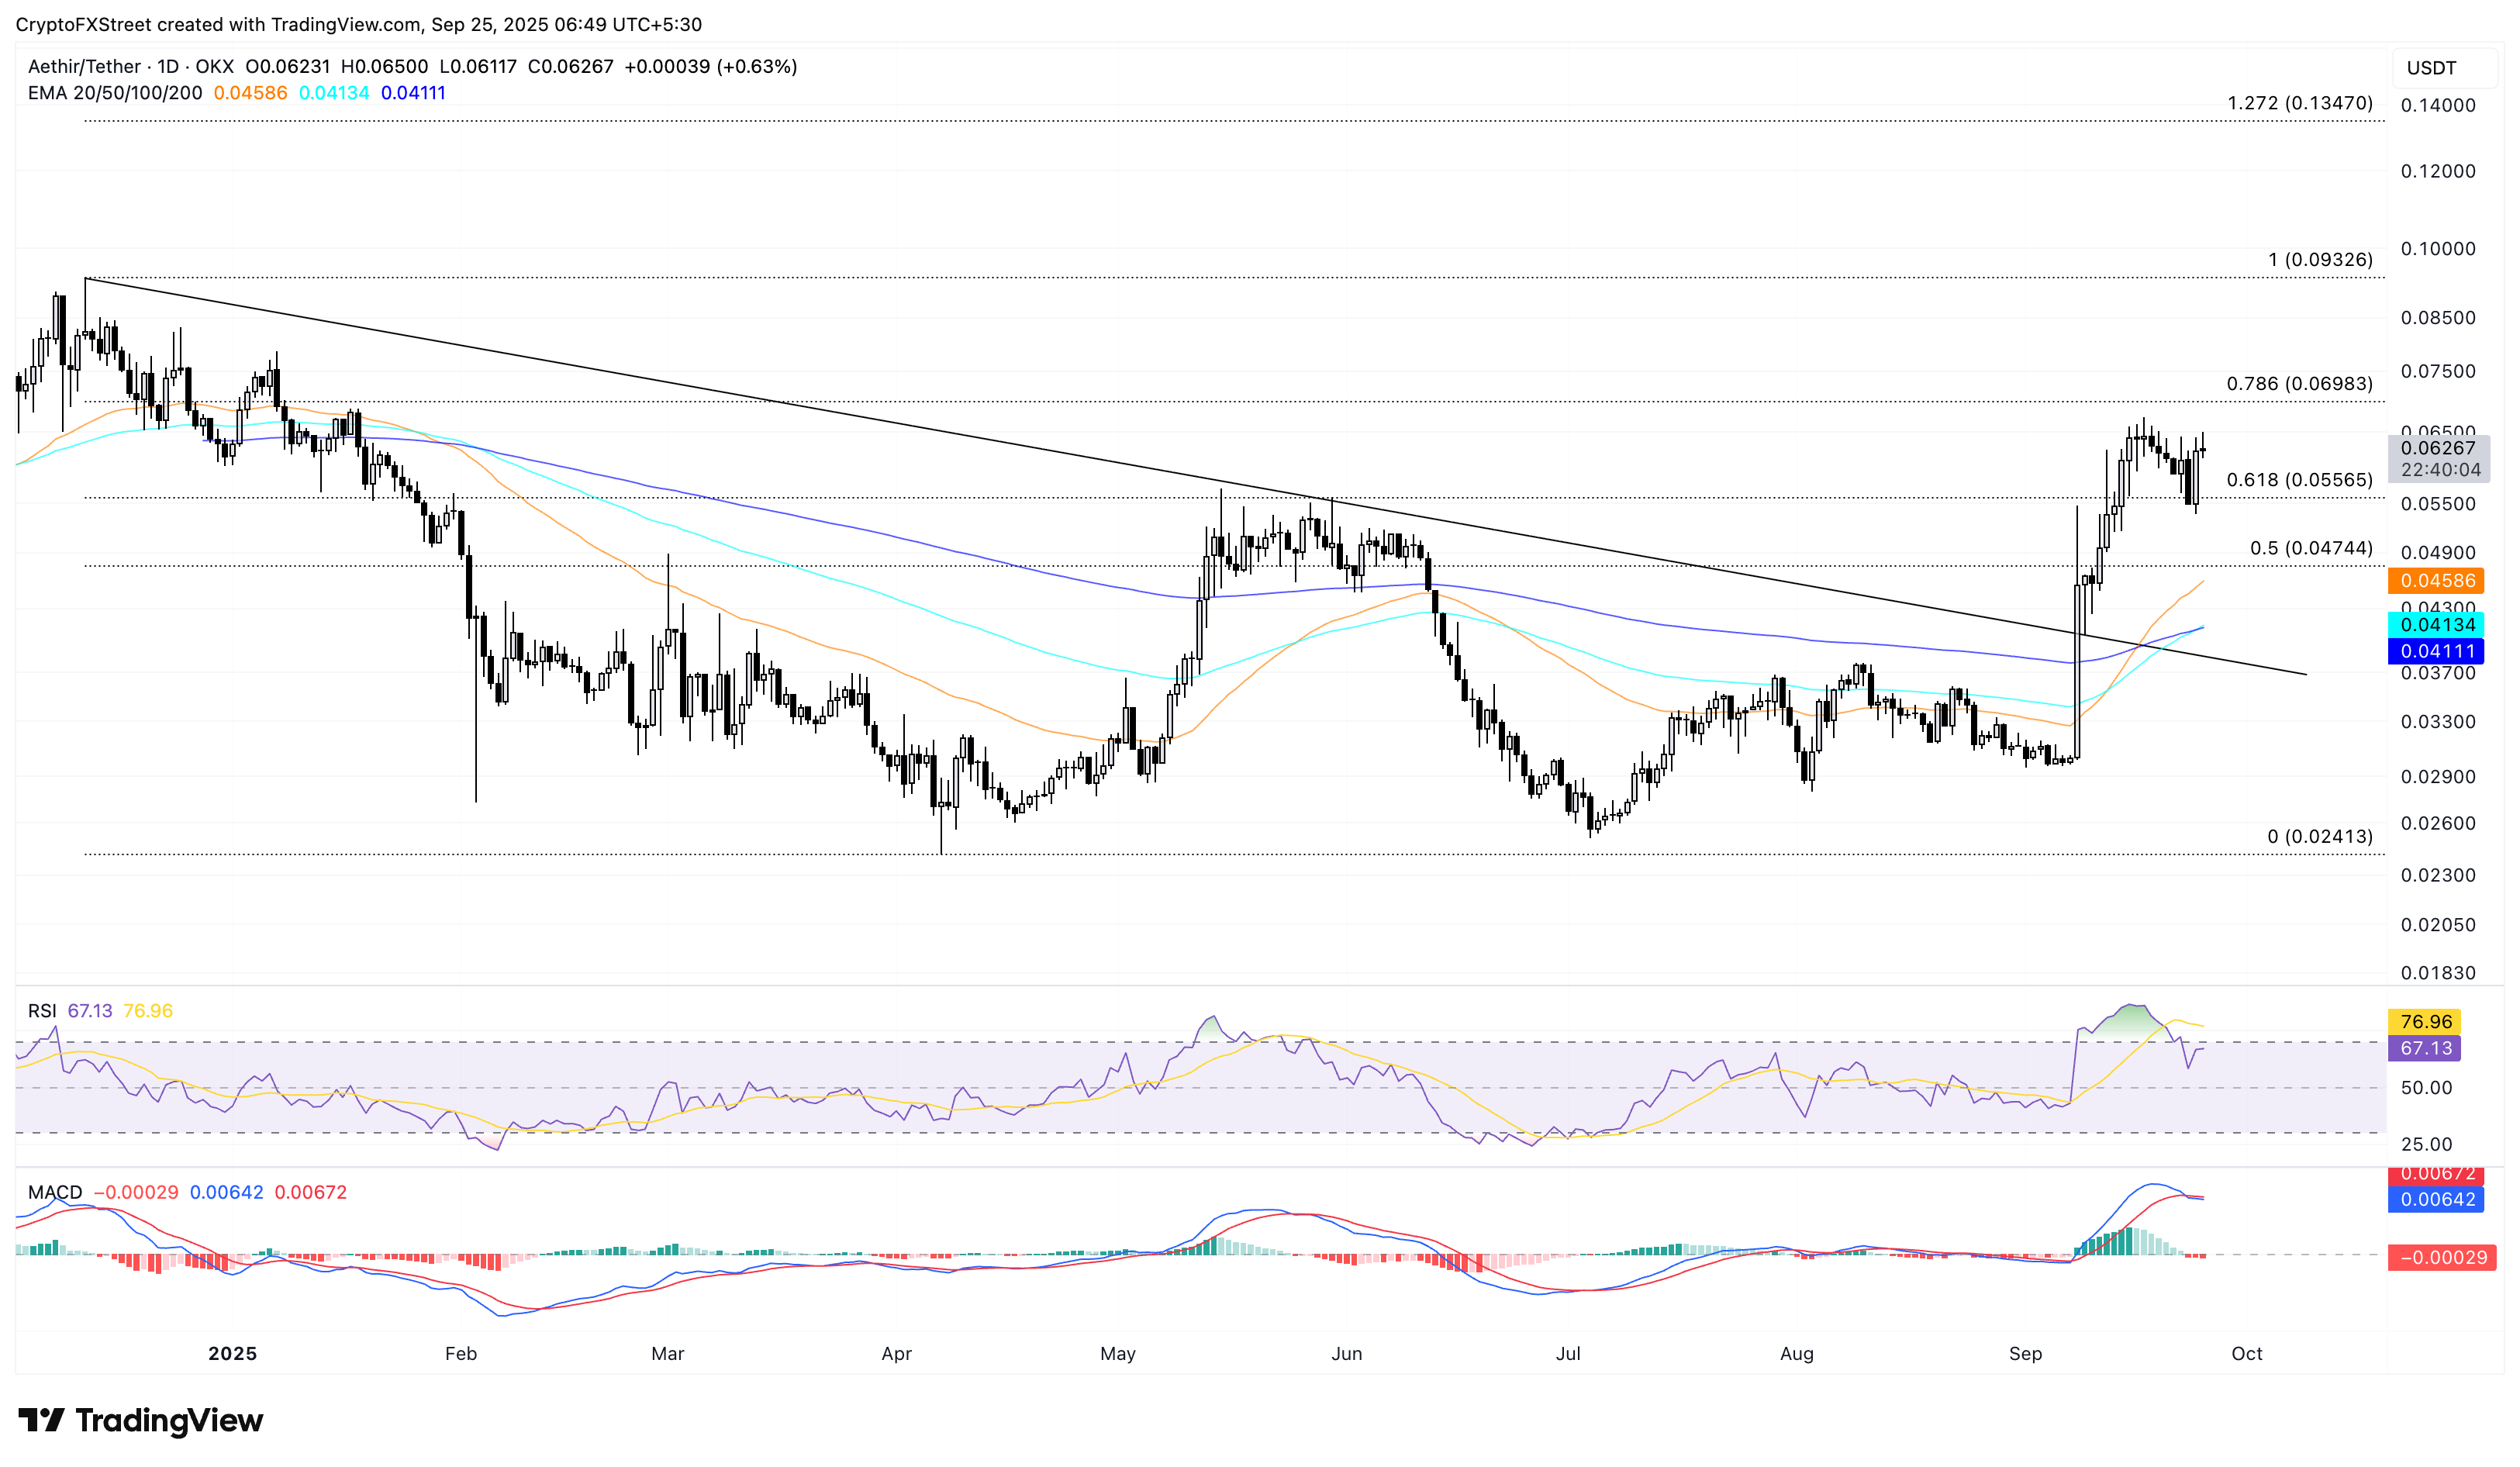
ATH/USDT daily price chart.
On the flip side, if ATH fails to hold above $0.05565, it could extend the decline to the 50-day Exponential Moving Average (EMA) at $0.04586.
Aster eyes further gains ahead of Trust Wallet integration
Aster trades above $2.30 at press time on Wednesday, amid the exclusive bonus available of 10% for traders using Binance Wallet. Adding to the interest, the upcoming integration with the Trust Wallet, alongside the 50,000 TWT tokens giveaway, provides an incentive to ASTER traders.

The DEX token extends the rally above the R1 pivot level at $2.07 on the 4-hour chart, targeting the R2 resistance level at $2.76.
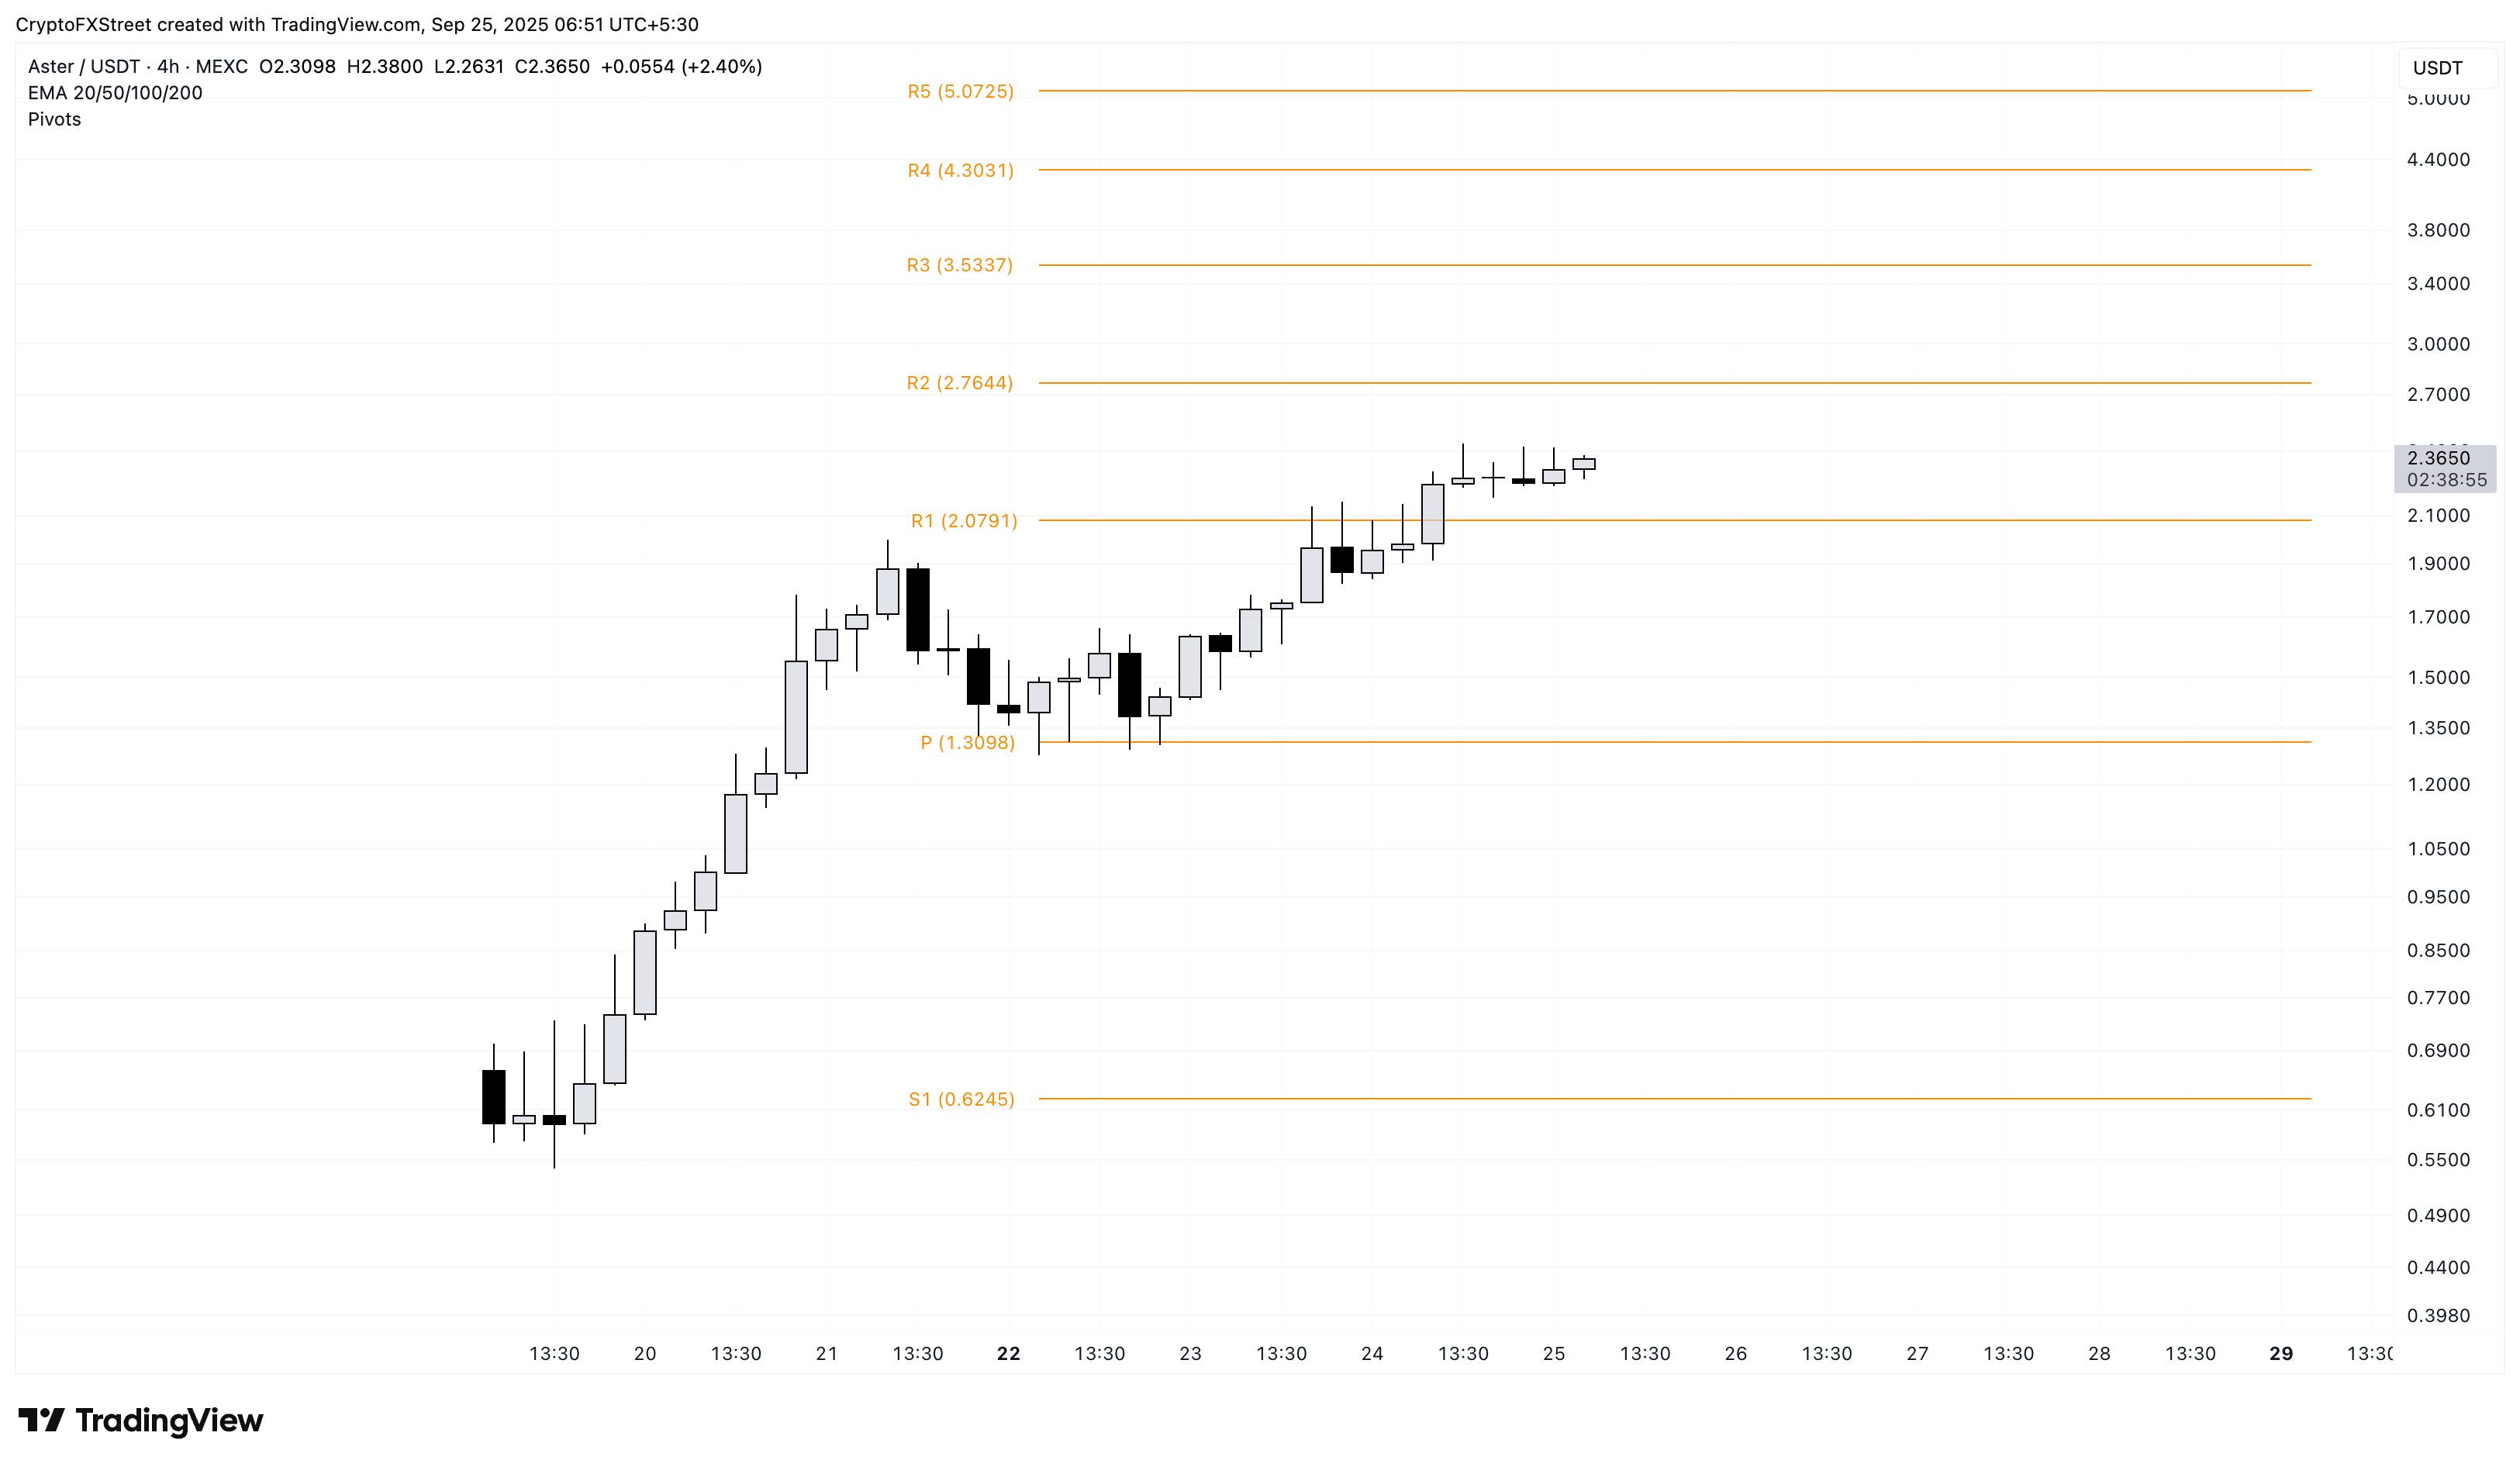
ASTER/USDT 4-hour price chart.
However, if ASTER slips below $2.07, the declining trend could test the centre pivot level at $1.30.
Flare extends the rally on FAssets launch
Flare edges higher by 1% at the time of writing on Thursday, following the 13% surge from the previous day. The platform focuses on expanding the liquidity and utility of Ripple’s XRP and has recently launched its FAssets, including FXRP, which unlocks Decentralized Finance (DeFi) capabilities for the cross-border remittance token.
The FLR rally targets the 78.6% Fibonacci retracement level at $0.02924, which is drawn from the $0.03827 peak of December 3 to the $0.01088 low of April 7. If FLR marks a decisive close above this level, it could extend the rally to the $0.03827 peak.
The MACD and its signal line exhibit an upward movement, marked by successive rises in the green histogram bars, indicating an increase in bullish momentum. Furthermore, the RSI at 69 stands at the verge of the overbought zone, suggesting that the buying pressure is elevated.
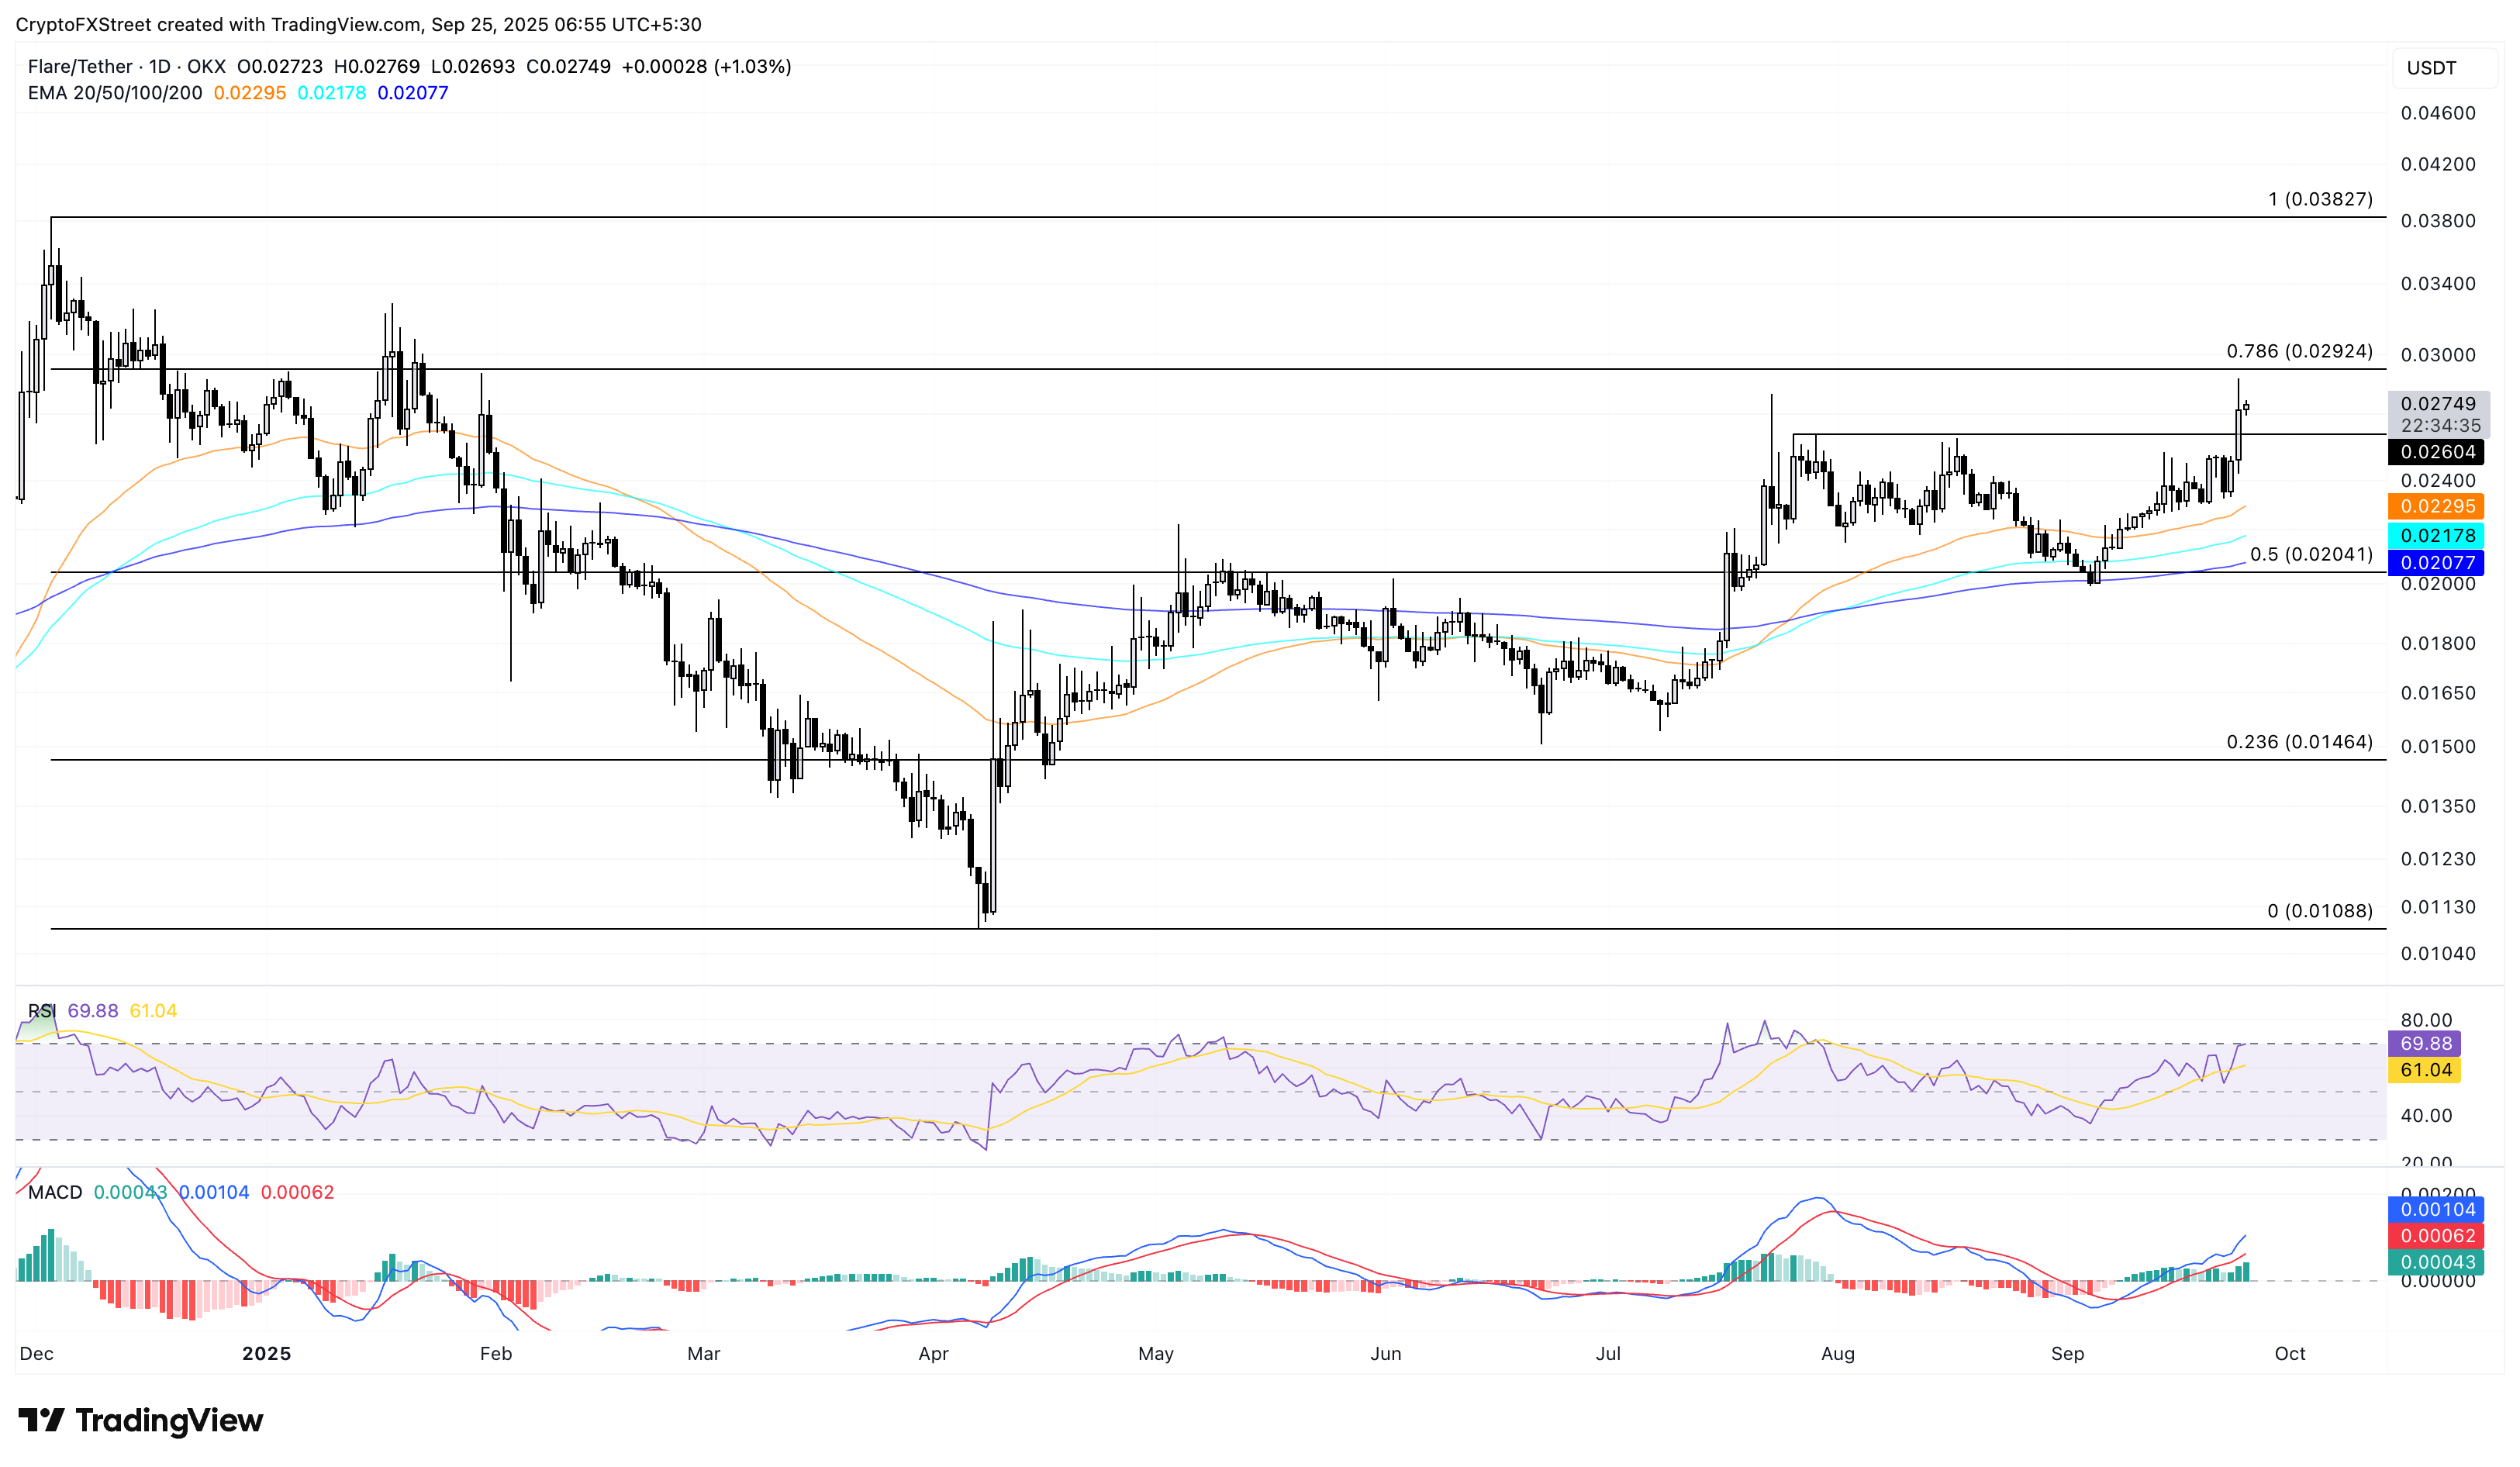
FLR/USDT daily price chart.
On the downside, if FLR reverses from $0.02924, it could result in a retest of the 50-day EMA at $0.2295.
Artigos Recomendados


