

Sui Price Forecast: SUI eyes 22% rally as DeFi TVL hits $2 billion
- Sui recovery stalls short of a key descending trendline resistance, but bullish outlook remains intact.
- Sui's DeFi TVL surpasses the $2 billion mark, reflecting increased investor confidence in the Layer-1 token's recovery.
- Retail interest in SUI grows in tandem with the surge in futures Open Interest to $1.98 billion.
Sui (SUI) holds above the $3.62 level at the time of writing on Wednesday after surging above $3.70 earlier in the day amid rising risk-on sentiment in the broader cryptocurrency market. The Layer-1 token's technical structure remains intact, as bulls set their sights on a potential 22% increase to $4.43.
Sui DeFi ecosystem gains momentum
Sui's staking protocol has experienced significant growth over the past few months, reaching $2.29 billion on July 28 before correcting to $1.91 billion in early August due to a general downturn in sentiment in the broader crypto market.
Total Value Locked (TVL) in Decentralized Finance (DeFi) refers to the cumulative value of all coins held in smart contracts of all the protocols on the chain.
A steady increase in TVL from $1.91 billion, averaging at $2 billion on Friday, suggests growing investor confidence in the Sui ecosystem. This could explain the rising interest in the staking service, which locks SUI holdings in smart contracts on the chain, earning staking rewards in return.
A higher TVL also reduces the circulating supply and subsequently the potential selling pressure. A decrease in SUI tokens on the open market, while demand increases, is a recipe for a sustainable price rally.
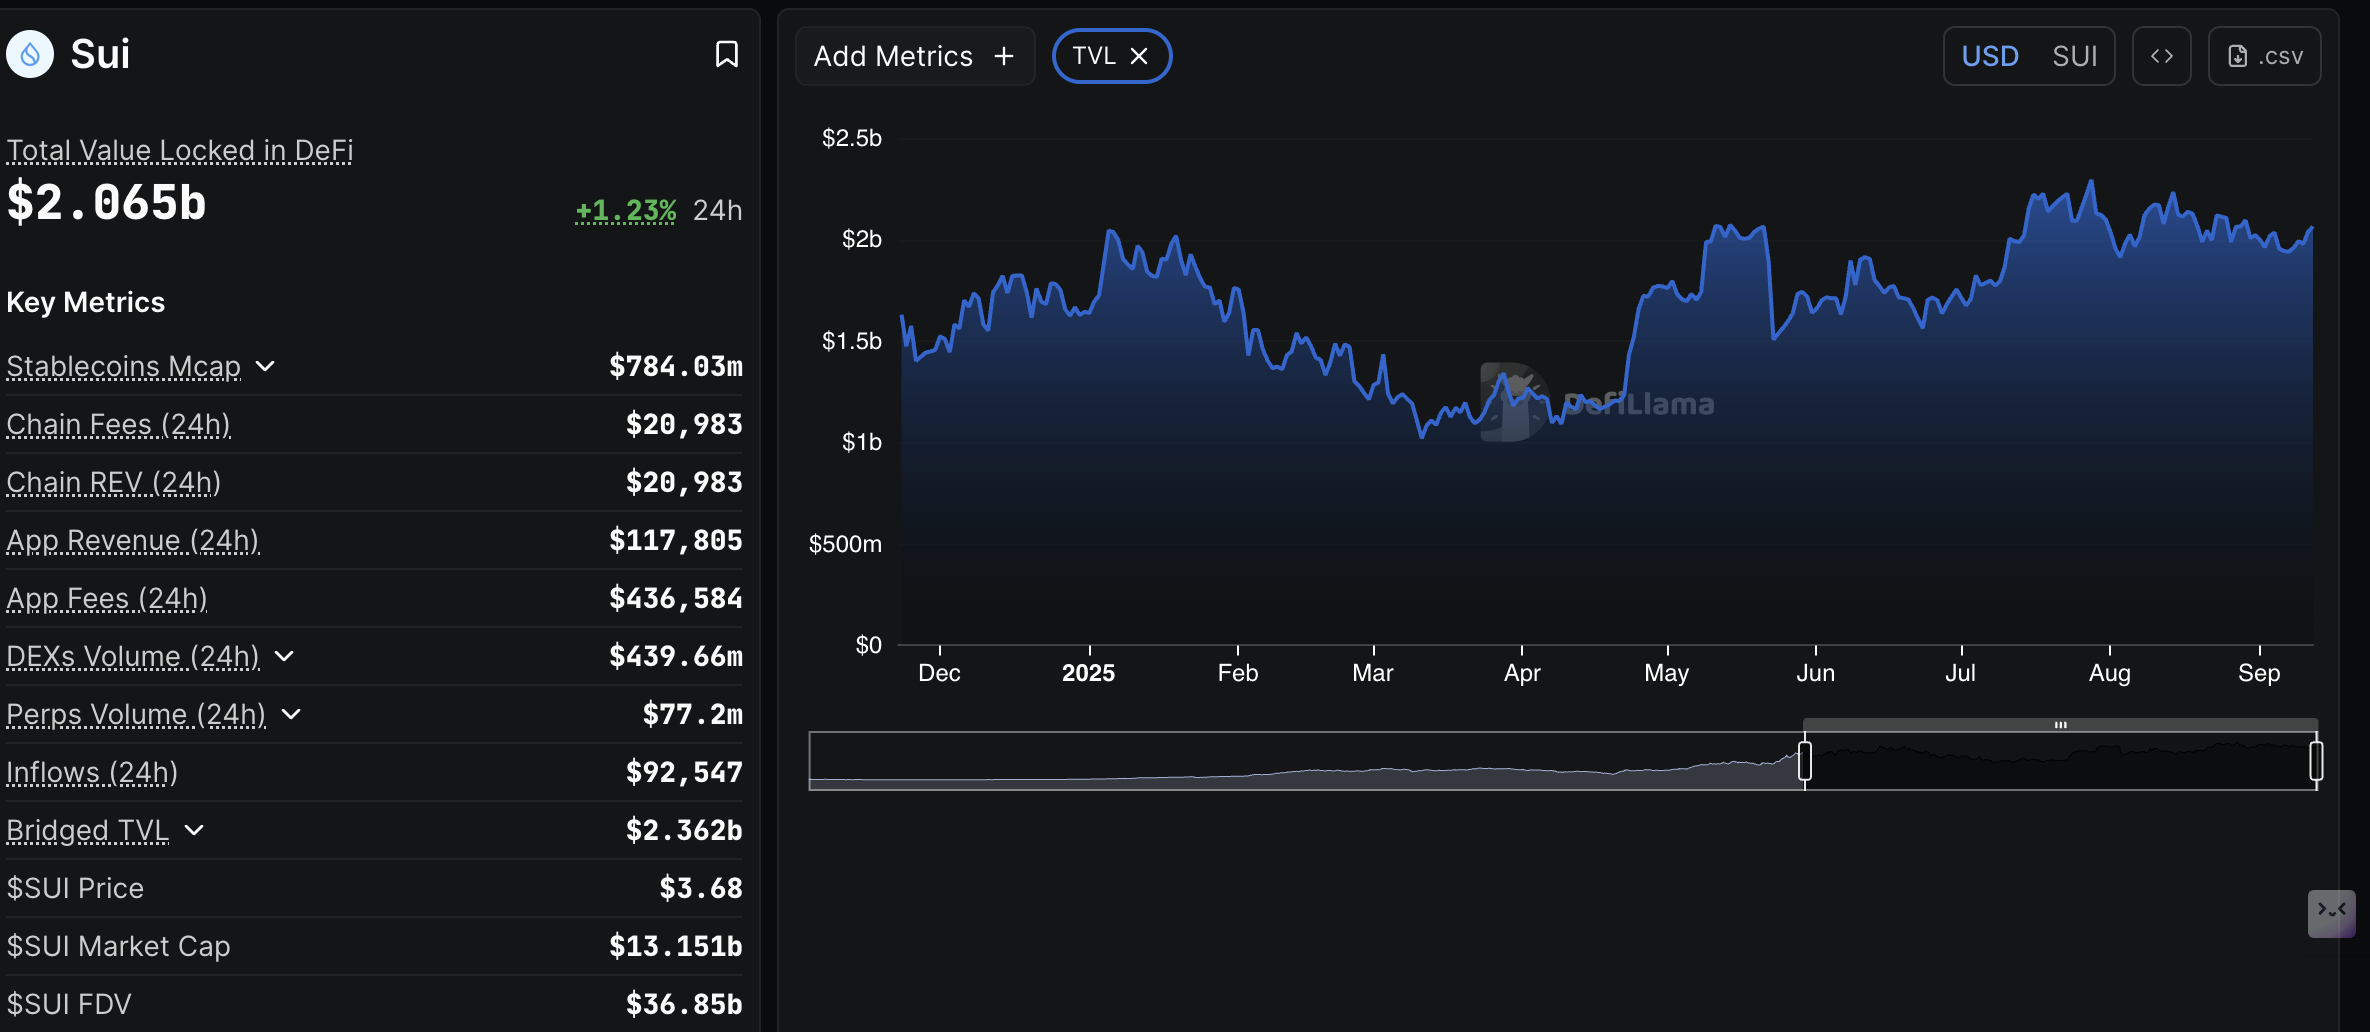
Sui DeFi TVL | Source: DefiLlama
Retail interest in SUI remains relatively high compared to last month. CoinGlass data shows the Sui futures Open Interest (OI) averaging $1.98 billion on Friday, up from $1.78 billion on August 22. OI refers to the notional value of outstanding futures contracts.
The rising OI trend suggests that investors have a strong conviction in Sui's ability to trigger and sustain a 22% breakout above a descending trendline resistance to $4.43.
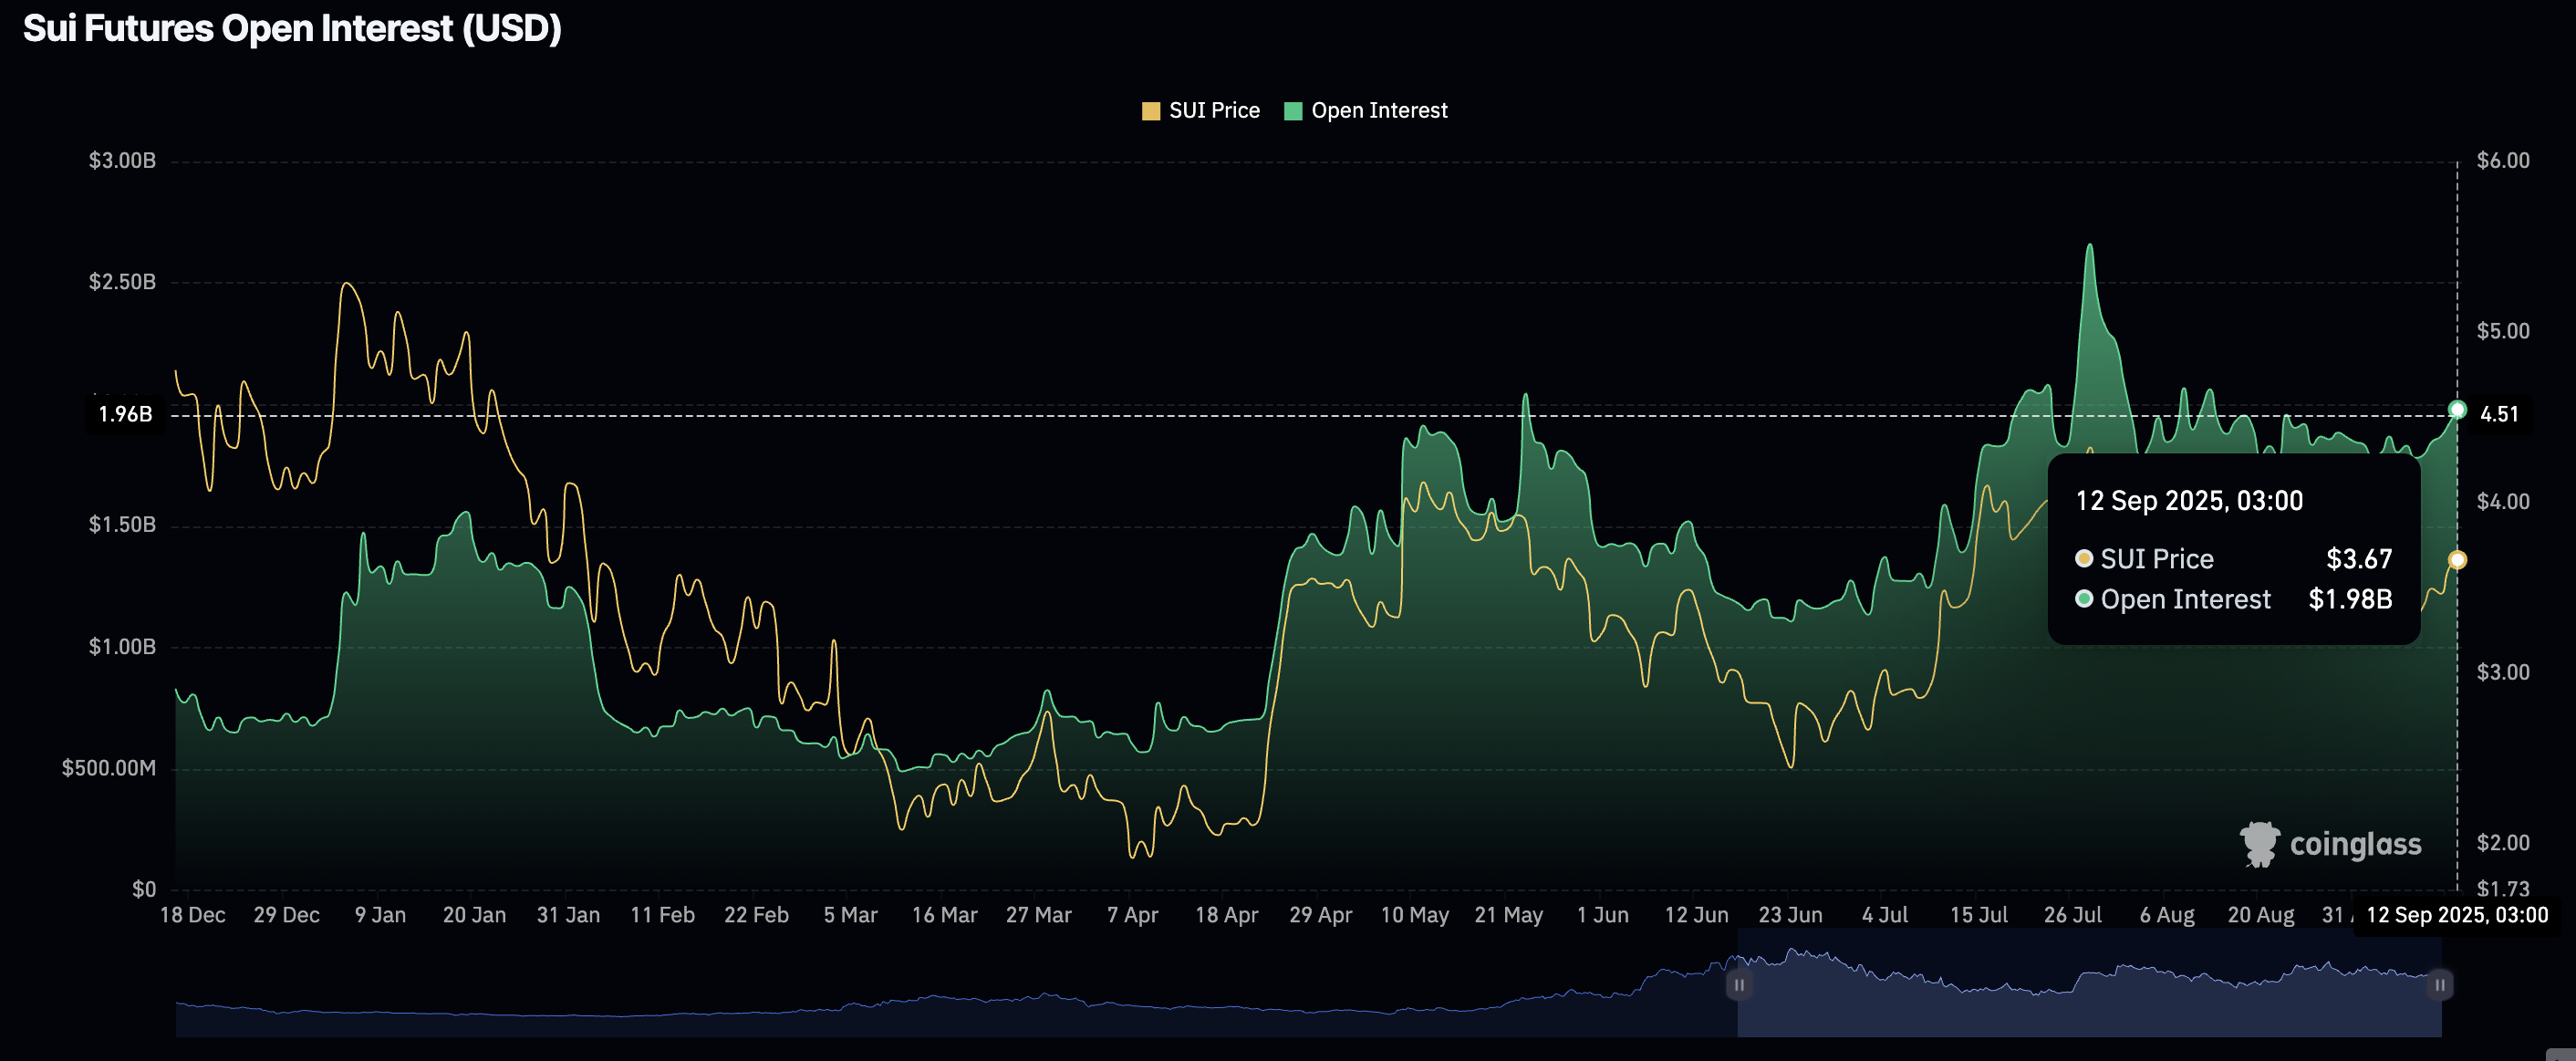
Sui Futures Open Interest | CoinGlass
Technical outlook: Is Sui poised for a breakout?
Sui holds significantly above key moving averages, including the 50-day Exponential Moving Average (EMA) at $3.50, the 100-day EMA at $3.44 and the 200-day EMA at $3.29, all of which face a slightly upward slope, reinforcing bullish sentiment.
A buy signal by the Moving Average Convergence Divergence (MACD) indicator has been sustained since Monday on the daily chart, which suggests that bulls have the upper hand. Traders may continue to increase their exposure as long as the MACD blue line remains above the red signal line, as the indicator generally rises.
A break above the descending trendline in the same daily time frame could boost risk-on sentiment. Above trendline, Sui price could extend the uptrend 22% to the next key hurdle at $4.43, which was previously tested on July 28.
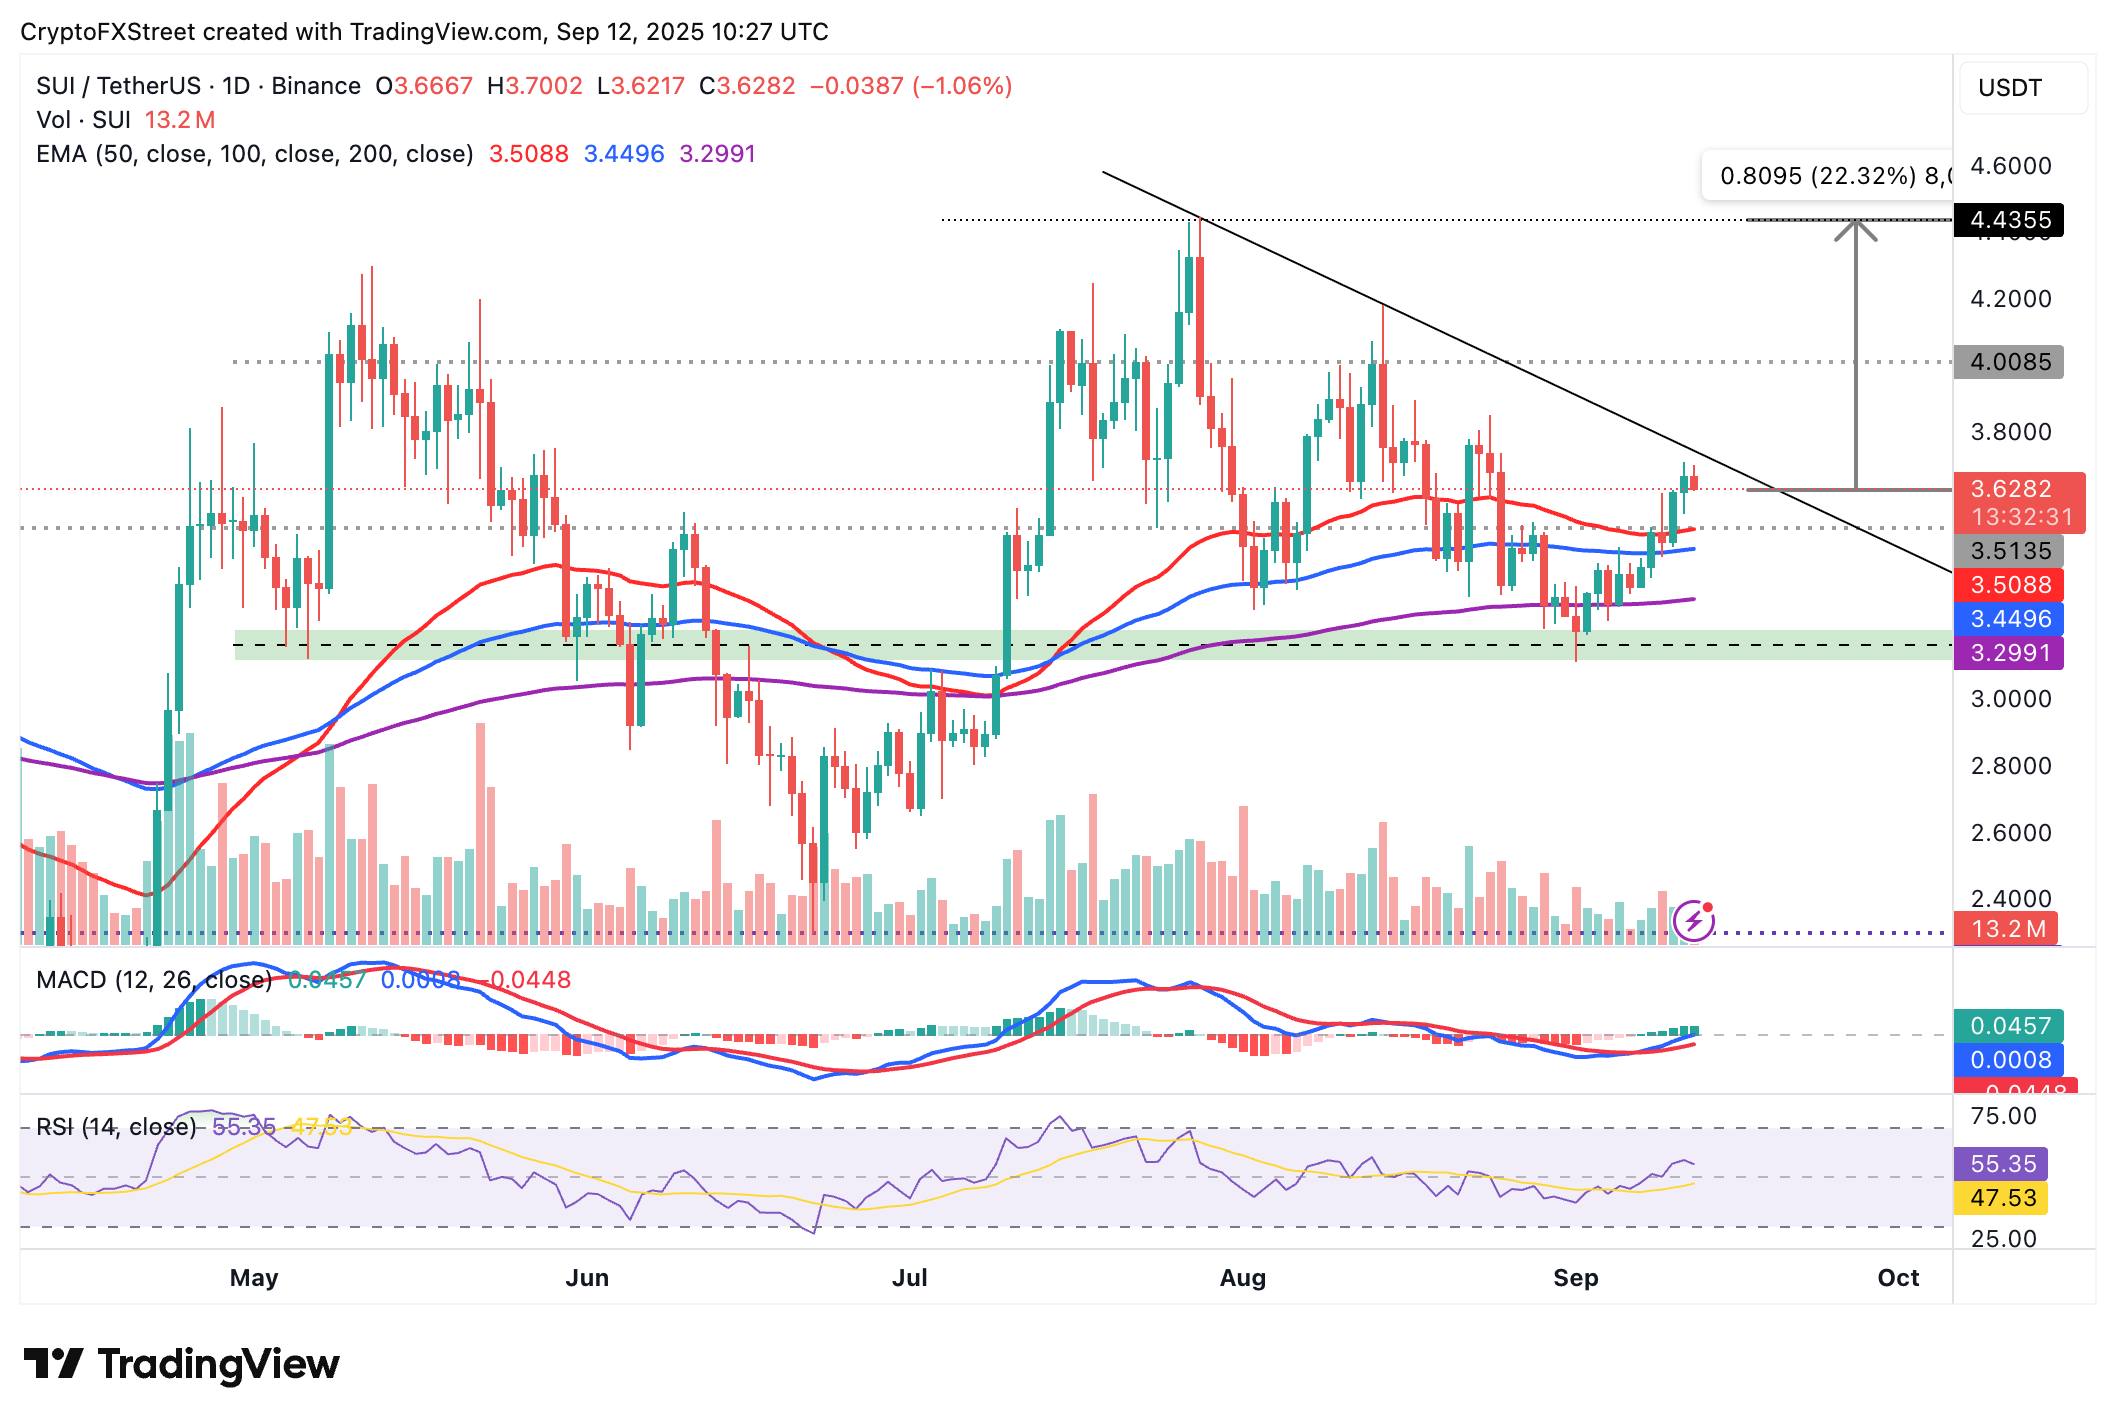
SUI/USDT daily chart
Still, traders should be cautious about the impact of early profit-taking, which could cause the extension of the current decline, bringing the 50-day EMA at $3.50, the 100-day EMA at $3.44 and the 200-day EMA at $3.29 within reach.
Open Interest, funding rate FAQs
Higher Open Interest is associated with higher liquidity and new capital inflow to the market. This is considered the equivalent of increase in efficiency and the ongoing trend continues. When Open Interest decreases, it is considered a sign of liquidation in the market, investors are leaving and the overall demand for an asset is on a decline, fueling a bearish sentiment among investors.
Funding fees bridge the difference between spot prices and prices of futures contracts of an asset by increasing liquidation risks faced by traders. A consistently high and positive funding rate implies there is a bullish sentiment among market participants and there is an expectation of a price hike. A consistently negative funding rate for an asset implies a bearish sentiment, indicating that traders expect the cryptocurrency’s price to fall and a bearish trend reversal is likely to occur.
Artigos Recomendados


