


Flow Q2 DeFi Report: Record growth in TVL, smart contracts, and Disney partnership
- The total value locked on Flow increases by 46% quarterly.
- Triple-digit surge in Smart contracts and PayPal’s PYUSD stablecoin supply in the last quarter signals increased activity.
- A record of 50 million subscribers onboarded to Flow via Disney’s Pinnacle partnership with Disney+.
Flow (FLOW), a Proof-of-Stake layer-1 blockchain, has significantly strengthened its Decentralized Finance (DeFi) ecosystem in the last quarter. Still, the ecosystem boost has yet to translate into its spot market demand, as the technical outlook suggests a potential trend reversal amid elevated bullish bets.
Flow’s DeFi ecosystem boost with Disney’s collaboration
Messari, a crypto-focused data analytics firm, released a report on Flow’s DeFi ecosystem growth over the second quarter of 2025. The Total Value Locked (TVL) on Flow had increased $68 million by the end of Q2, which accounted for a 46.3% Quarter-on-Quarter (QoQ) growth. At the time of writing, the TVL stands at $79.98 million, indicating a larger inflow of digital assets on the network.
Corroborating the TVL surge, the smart contracts deployed on the network reached a record high of 45,239 since October 2024. Additionally, liquidity on the network increases with the PYUSD supply reaching $26.2 million on June 30, dominating 65.8% of the stablecoin supply on Flow. The rest of the market share is acquired by Circle’s USDC stablecoin, with $13.6 million.
As of Friday, the stablecoin market capitalization on Flow stands at $36.89 million, with the PYUSD dominating 64.7%, indicating a minor decline in liquidity since July 30.
Flow’s collaboration with Disney’s Pinnacle Partnership added over 50 million subscribers with digital collectibles. The spot market demand is likely to increase as the Flow’s DeFi ecosystem grows, with investors rotating profits from Bitcoin (BTC) and Ethereum (ETH) into other altcoins.
Bullish bets increase amid stagnant FLOW price move
FLOW trades at $0.373 at press time on Friday, keeping a sideways track on the daily chart, between the previous two pivot points of $0.458 on July 21 and $0.345 on August 2. The multi-role architecture token struggles to overcome the 50-day Exponential Moving Average (EMA) at $0.381 while the declining 100- and 200-day EMAs suggest a long-term bearish trend in motion.
Still, the Stochastic Relative Strength Index (Stoch RSI) indicates the average line approaching the oversold boundary. A crossover in the Stoch RSI average lines for a positive turnaround would mark a bullish shift in trend momentum, triggering a buy signal for sidelined investors.
Additionally, the Relative Strength Index (RSI) at 46 hovers relatively flat, below the halfway line, indicating a neutral signal.
CoinGlass data shows that the elevated taker buy volumes, representing 50.8% long positions, have dropped from 52.17% on Thursday. This suggests that risk-on sentiment among investors is gradually increasing.
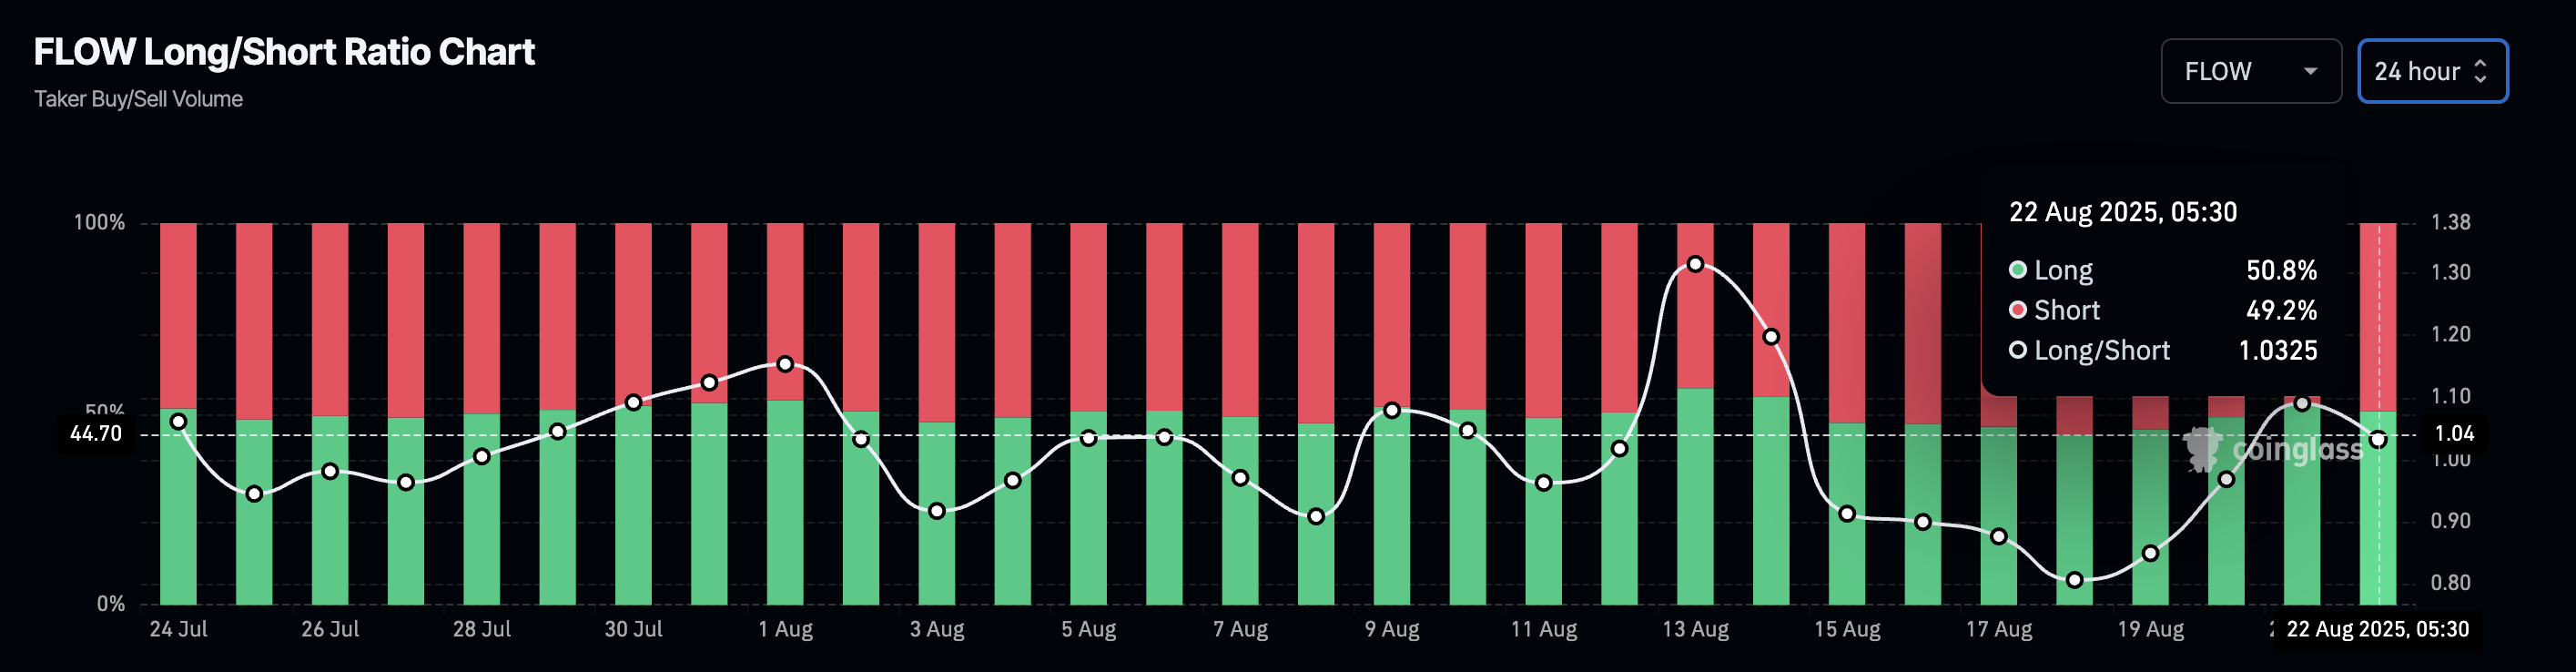
FLOW long/short ratio chart.
To reinstate a bullish run, FLOW should mark a decisive close above the 200-day EMA at 0.431, targeting the July 21 peak at $0.458.
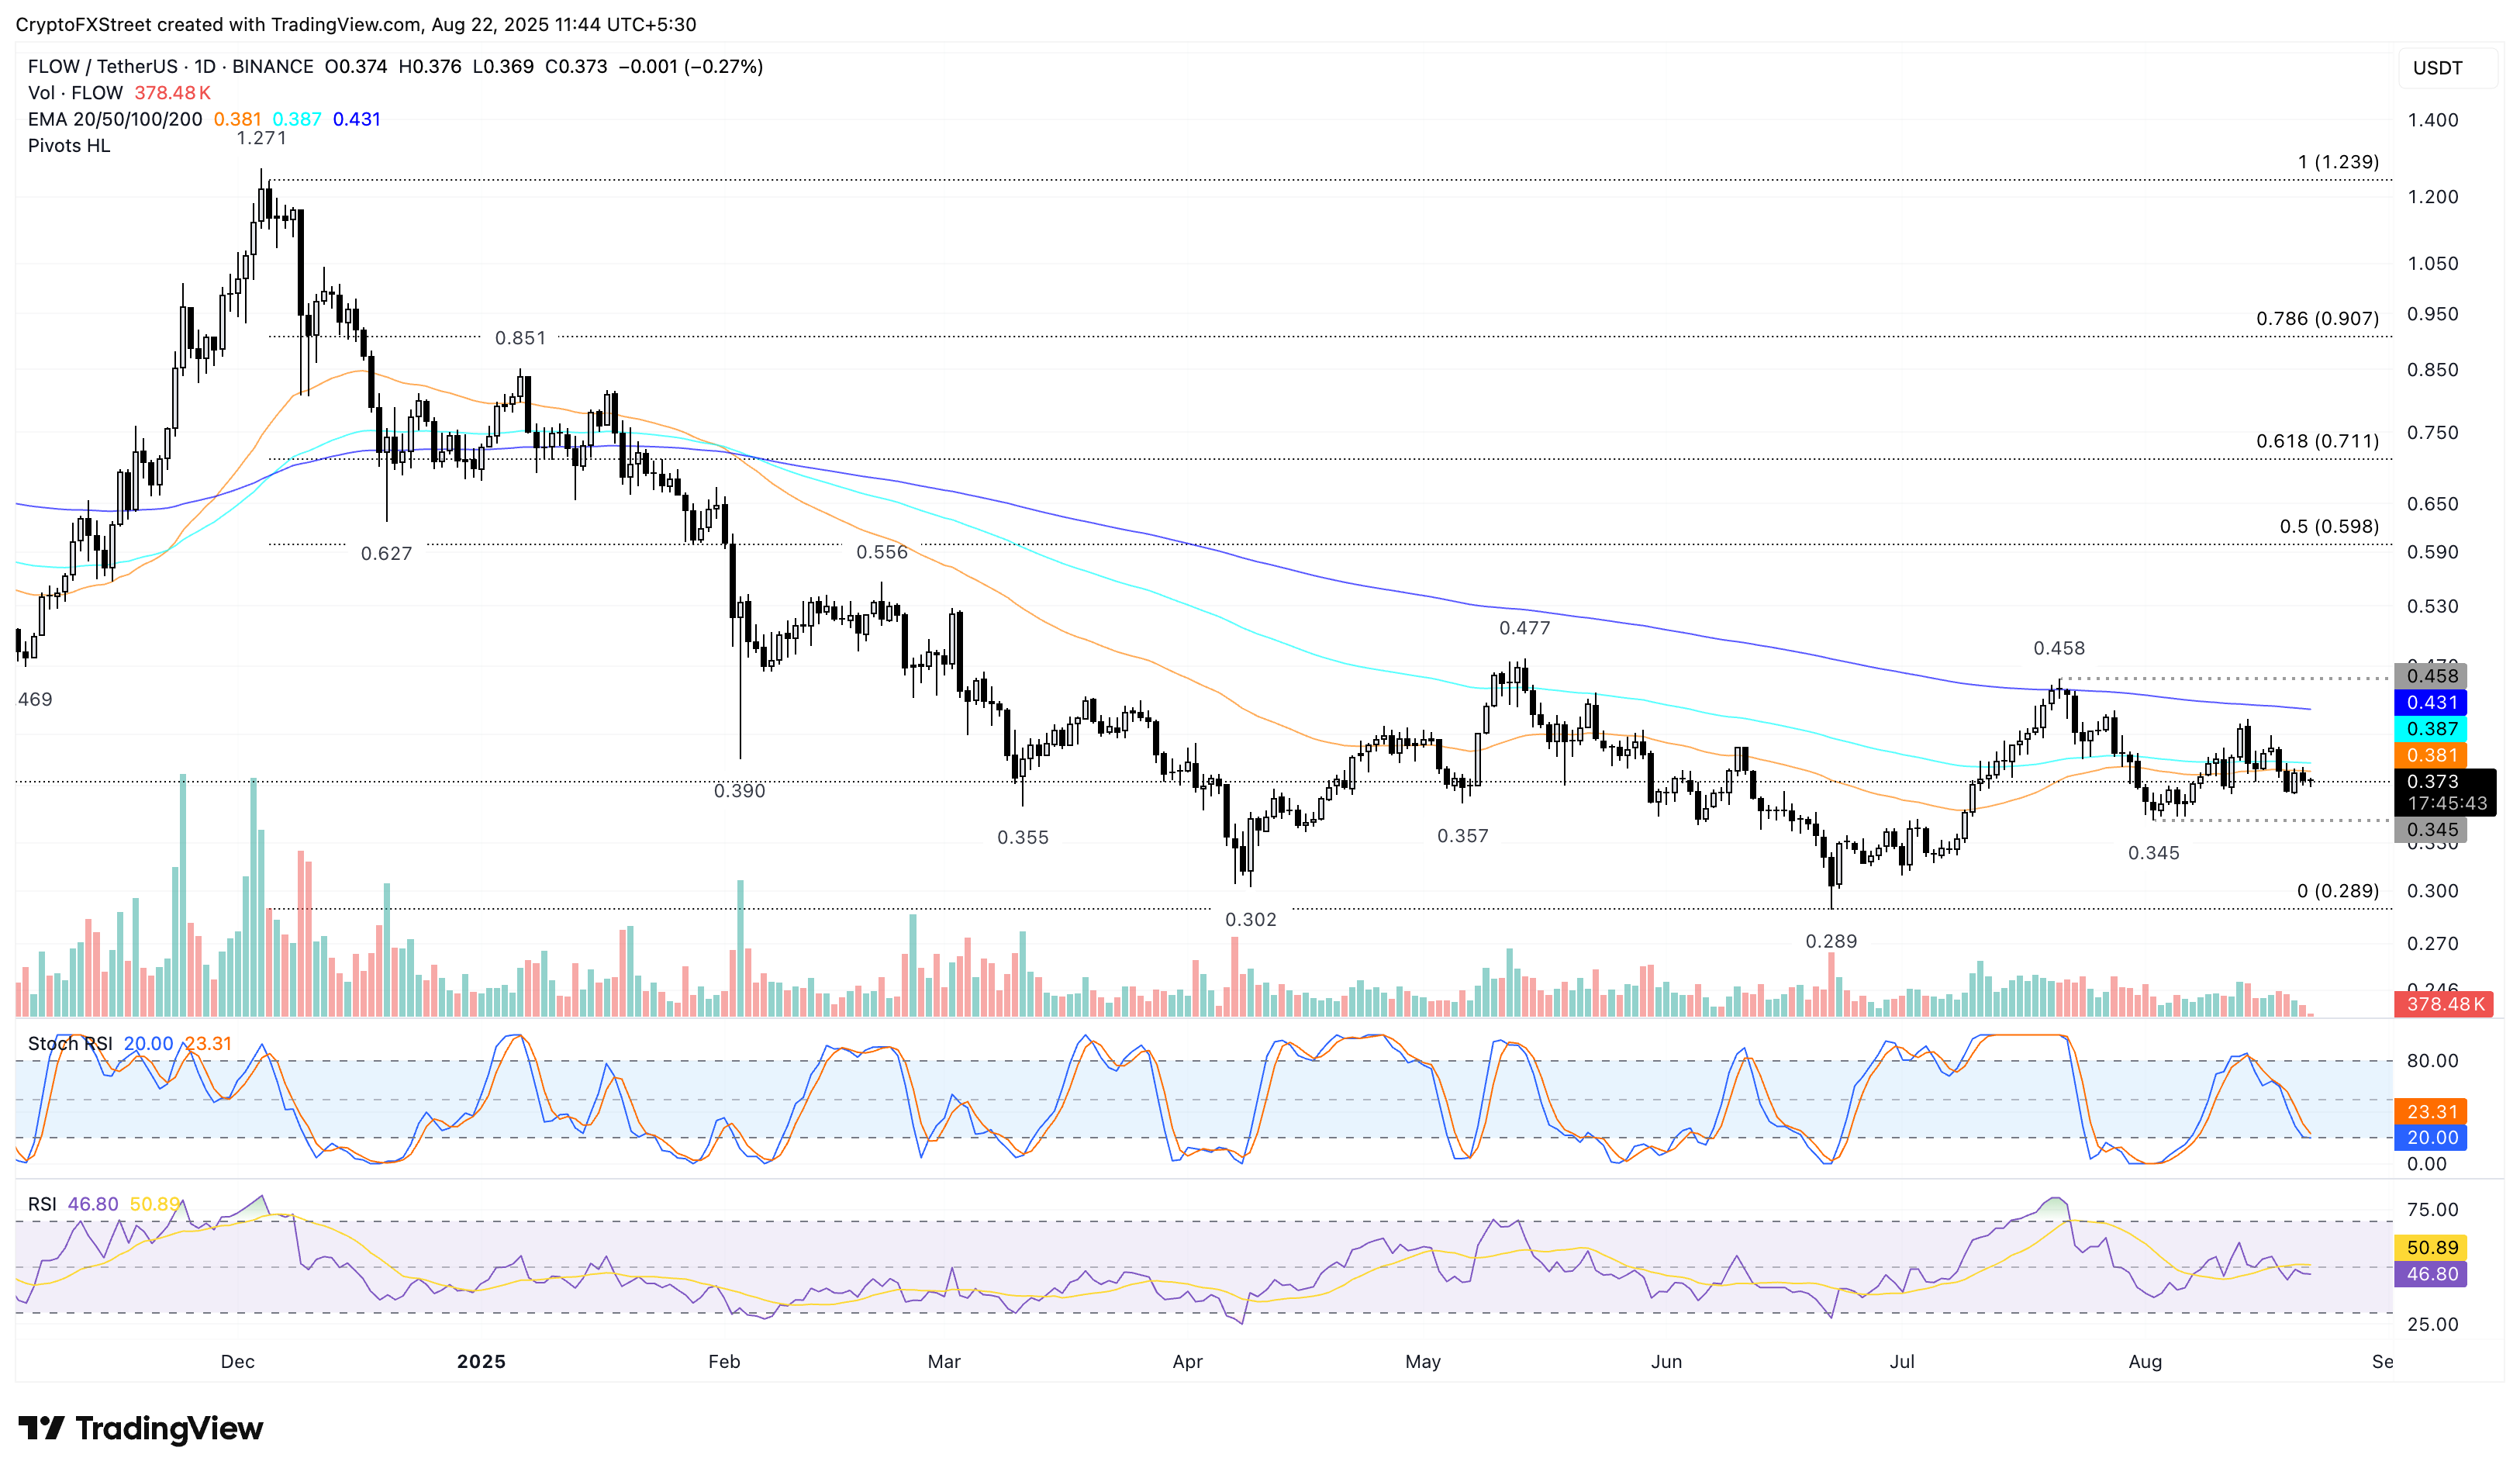
FLOW/USDT daily price chart.
Looking down, a close below the $0.345 low from August 2 could extend the pullback to $0.289 low from June 22.
Artigos Recomendados


