


Silver Price Forecast: XAG/USD wobbles near $79, investors await US-Iran second round talks
- Silver price remains calm near $78.70 while investors await the announcement of the US-Iran second round of talks.
- US President Trump remains hopeful of a permanent ceasefire with Iran.
- Iran optimism continues to keep the US Dollar under pressure.
Silver price (XAG/USD) trades calmly near $78.70 during the European trading session on Friday. The white metal is broadly sideways as investors await the announcement of a timeline for another round of talks between the United States (US) and Iran.
Washington has announced that both the US and Iran will resume negotiations soon, which previously ended without a breakthrough, before the expiration of the two-week ceasefire on April 21.
Meanwhile, US President Donald Trump has expressed confidence that a deal with Iran is “very close”, as the nation has “agreed to almost everything”. Trump clarified that Iran seems now more “willing to do things today than they previously weren't”, which includes giving up nuclear ambitions and handing over enriched uranium.
Hopes of a US-Iran permanent truce continue to keep the US Dollar (USD) under pressure, a scenario that is technically risk-reward favorable for the Silver price.
The US Dollar Index (DXY), which tracks the Greenback’s value against six major currencies, looks set for a negative closing for the second straight week. The Iran optimism has capped oil prices, which has anchored inflation expectations again, and forcing traders to pare dovish Federal Reserve (Fed) bets.
Theoretically, diminishing dovish Fed prospects bode well for non-yielding assets, such as Silver.
Silver technical analysis
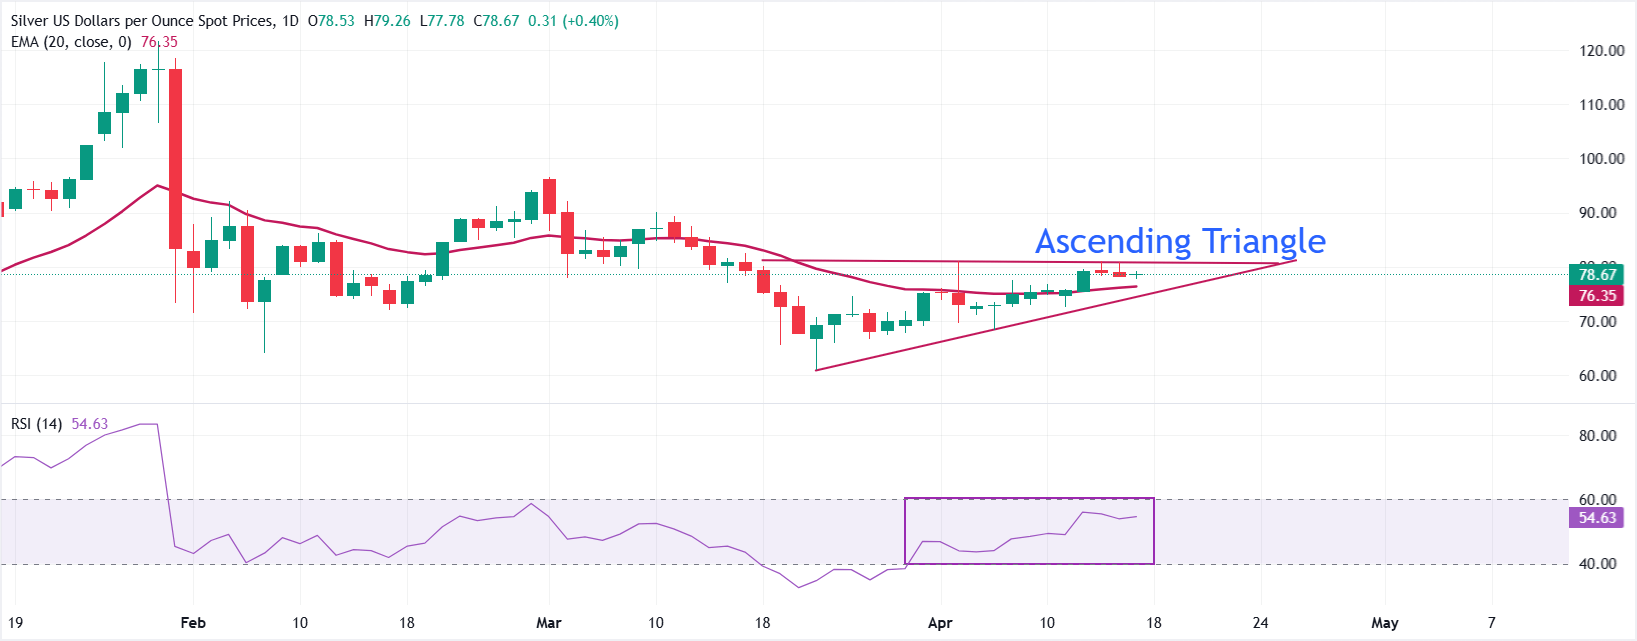
XAG/USD trades flat at around $78.68 during the press time. The near-term bias of the Silver price seems neutral as it remains sticky to the flattening 20-period Exponential Moving Average (EMA) at $76.35.
The upward-sloping border of the Ascending Triangle formation drawn from $60.86, last referenced around $75.97, reinforcing an underlying bid after the recent pullback.
The Relative Strength Index (RSI) continues to wobble inside the 40.00-60.00 zone, reflecting indecisiveness among market participants.
On the topside, initial resistance is seen near the horizontal border of the triangle formation, with a reference break level at $80.76; a daily close above this area would open the way for further recovery towards the March 13 high of $85.46.
On the downside, immediate support is the 20-period EMA at $76.35 and the rising trend-line region around $75.97, where failure would weaken the current constructive tone and expose a deeper correction within the broader advance.
(The technical analysis of this story was written with the help of an AI tool.)
Silver FAQs
Silver is a precious metal highly traded among investors. It has been historically used as a store of value and a medium of exchange. Although less popular than Gold, traders may turn to Silver to diversify their investment portfolio, for its intrinsic value or as a potential hedge during high-inflation periods. Investors can buy physical Silver, in coins or in bars, or trade it through vehicles such as Exchange Traded Funds, which track its price on international markets.
Silver prices can move due to a wide range of factors. Geopolitical instability or fears of a deep recession can make Silver price escalate due to its safe-haven status, although to a lesser extent than Gold's. As a yieldless asset, Silver tends to rise with lower interest rates. Its moves also depend on how the US Dollar (USD) behaves as the asset is priced in dollars (XAG/USD). A strong Dollar tends to keep the price of Silver at bay, whereas a weaker Dollar is likely to propel prices up. Other factors such as investment demand, mining supply – Silver is much more abundant than Gold – and recycling rates can also affect prices.
Silver is widely used in industry, particularly in sectors such as electronics or solar energy, as it has one of the highest electric conductivity of all metals – more than Copper and Gold. A surge in demand can increase prices, while a decline tends to lower them. Dynamics in the US, Chinese and Indian economies can also contribute to price swings: for the US and particularly China, their big industrial sectors use Silver in various processes; in India, consumers’ demand for the precious metal for jewellery also plays a key role in setting prices.
Silver prices tend to follow Gold's moves. When Gold prices rise, Silver typically follows suit, as their status as safe-haven assets is similar. The Gold/Silver ratio, which shows the number of ounces of Silver needed to equal the value of one ounce of Gold, may help to determine the relative valuation between both metals. Some investors may consider a high ratio as an indicator that Silver is undervalued, or Gold is overvalued. On the contrary, a low ratio might suggest that Gold is undervalued relative to Silver.
Artigos Recomendados


