

Silver Price Forecast: XAG/USD consolidates near four-week high, below mid- $53.00s
- Silver bulls pause for a breather following the recent strong gains to a nearly four-week top.
- The constructive technical setup backs the case for a further near-term appreciating move.
- Any corrective slide below $53.00 could be seen as a buying opportunity and remain limited.
Silver (XAG/USD) is seen consolidating its strong gains registered over the past four days and oscillating in a range during the Asian session on Thursday. The white metal currently trades around the $53.35-$53.40 region, just below a nearly four-week top touched on Wednesday, and seems poised to appreciate further.
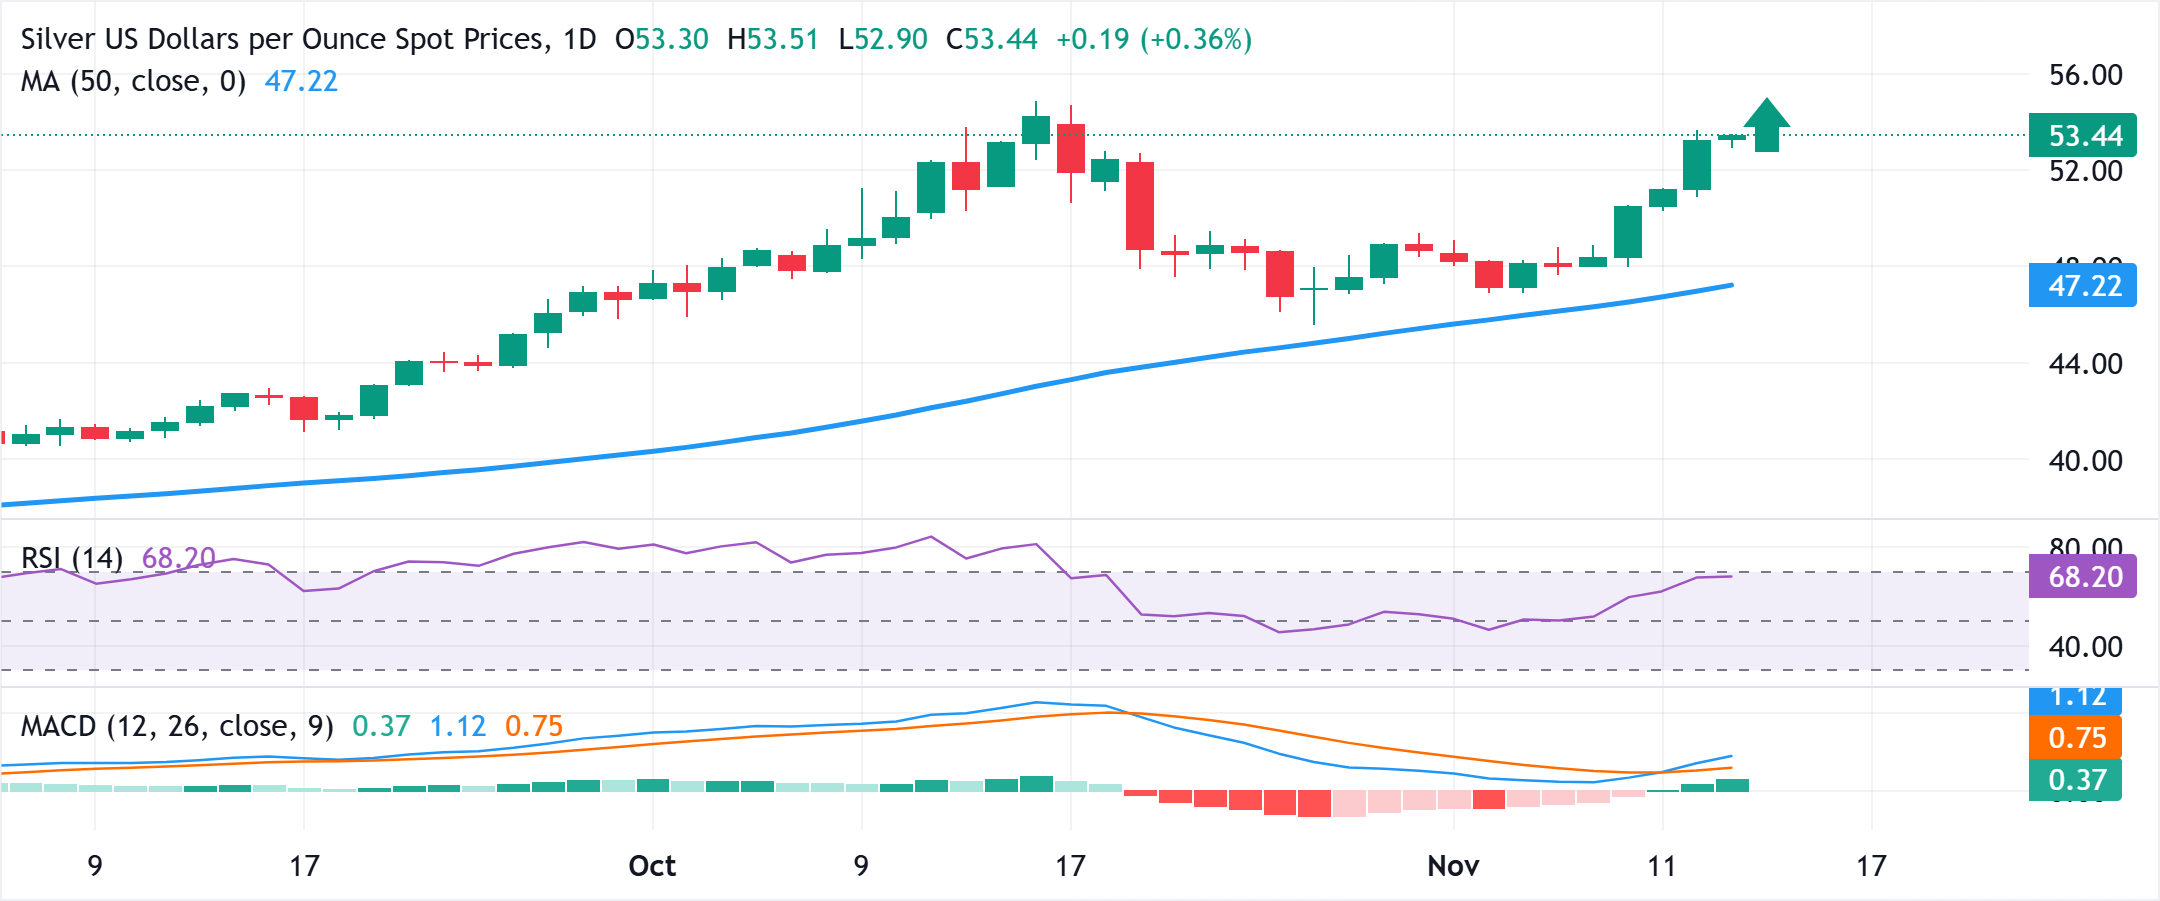
From a technical perspective, the recent goodish rebound from the vicinity of the 50-day Simple Moving Average (SMA) and the subsequent move up favor the XAG/USD bulls. Moreover, oscillators on the daily chart have been gaining positive traction and are still away from being in the overbought territory, validating the constructive outlook for the white metal.
Hence, some follow-through strength beyond the overnight swing high, around the $53.65-$53.70 region, towards reclaiming the $54.00 round figure, looks like a distinct possibility. A sustained strength beyond the latter would set the stage for an extension of the positive momentum towards retesting the all-time peak, around the $54.85 zone, touched in October.
On the flip side, any meaningful corrective slide below the $53.00 mark could attract some buyers near the $52.45 intermediate support, which should help limit the downside for the XAG/USD near the $52.00 round figure. Failure to defend the said support levels, however, could prompt some technical selling and drag the white metal to the $51.30-$51.20 area.
Silver daily chart
Silver FAQs
Silver is a precious metal highly traded among investors. It has been historically used as a store of value and a medium of exchange. Although less popular than Gold, traders may turn to Silver to diversify their investment portfolio, for its intrinsic value or as a potential hedge during high-inflation periods. Investors can buy physical Silver, in coins or in bars, or trade it through vehicles such as Exchange Traded Funds, which track its price on international markets.
Silver prices can move due to a wide range of factors. Geopolitical instability or fears of a deep recession can make Silver price escalate due to its safe-haven status, although to a lesser extent than Gold's. As a yieldless asset, Silver tends to rise with lower interest rates. Its moves also depend on how the US Dollar (USD) behaves as the asset is priced in dollars (XAG/USD). A strong Dollar tends to keep the price of Silver at bay, whereas a weaker Dollar is likely to propel prices up. Other factors such as investment demand, mining supply – Silver is much more abundant than Gold – and recycling rates can also affect prices.
Silver is widely used in industry, particularly in sectors such as electronics or solar energy, as it has one of the highest electric conductivity of all metals – more than Copper and Gold. A surge in demand can increase prices, while a decline tends to lower them. Dynamics in the US, Chinese and Indian economies can also contribute to price swings: for the US and particularly China, their big industrial sectors use Silver in various processes; in India, consumers’ demand for the precious metal for jewellery also plays a key role in setting prices.
Silver prices tend to follow Gold's moves. When Gold prices rise, Silver typically follows suit, as their status as safe-haven assets is similar. The Gold/Silver ratio, which shows the number of ounces of Silver needed to equal the value of one ounce of Gold, may help to determine the relative valuation between both metals. Some investors may consider a high ratio as an indicator that Silver is undervalued, or Gold is overvalued. On the contrary, a low ratio might suggest that Gold is undervalued relative to Silver.
Artigos Recomendados


